International Transport Forum 2 rue André Pascal
75775 Paris Cedex 16 France T +33 (0)1 45 24 97 10 F +33 (0)1 45 24 13 22 Email : [email protected] Web: www.internationaltransportforum.org
Infrastructure 1995-2011
Trends, Policies, Data
Transport infrastructure is a vital social and economic asset. Its
construction and maintenance absorb signifi cant resources while
decisions on infrastructure have impacts that last for decades.
The International Transport Forum has collected statistics on
investment and maintenance expenditure in transport infrastructure
since the late 1970s. This report presents aggregate trends in inland
transport infrastructure investment and maintenance since 1995 and
provides data on road, rail, inland waterway, sea port and airport
spending for the International Transport Forum member countries for
the period 1995-2011.
In preparation for the International Transport Forum’s 2013 Summit
on Funding Transport, a survey was carried out to collect information
on transport policies in member countries. The report presents
broad conclusions on these policies, as well as on infrastructure
performance, funding and strategic plans.
2013-05/Photo credits: echo3005 /
Shutterstock
Spending on Transport
Infrastructure
1995-2011
Spending on Transport Infrastructure
1995-2011
Trends, Policies, Data
THE INTERNATIONAL TRANSPORT FORUM
The International Transport Forum at the OECD is an intergovernmental organisation with 54 member countries. It acts as a strategic think-tank, with the objective of helping shape the transport policy agenda on a global level and ensuring that it contributes to economic growth, environmental protection, social inclusion and the preservation of human life and well-being. The International Transport Forum organises an annual summit of Ministers along with leading representatives from industry, civil society and academia.
The International Transport Forum was created under a Declaration issued by the Council of Ministers of the ECMT (European Conference of Ministers of Transport) at its Ministerial Session in May 2006 under the legal authority of the Protocol of the ECMT, signed in Brussels on 17 October 1953, and legal instruments of the OECD.
The Members of the Forum are: Albania, Armenia, Australia, Austria, Azerbaijan, Belarus, Belgium, Bosnia-Herzegovina, Bulgaria, Canada, Chile, China, Croatia, the Czech Republic, Denmark, Estonia, Finland, France, FYROM, Georgia, Germany, Greece, Hungary, Iceland, India, Ireland, Italy, Japan, Korea, Latvia, Liechtenstein, Lithuania, Luxembourg, Malta, Mexico, Moldova, Montenegro, the Netherlands, New Zealand, Norway, Poland, Portugal, Romania, Russia, Serbia, Slovakia, Slovenia, Spain, Sweden, Switzerland, Turkey, Ukraine, the United Kingdom and the United States.
The International Transport Forum’s Research Centre gathers statistics and conducts co-operative research programmes addressing all modes of transport. Its findings are widely disseminated and support policymaking in Member countries as well as contributing to the annual summit.
TABLE OF CONTENTS
1. INTRODUCTION ... 5
2. TRENDS IN INLAND TRANSPORT INFRASTRUCTURE SPENDING ... 6
2.1. Trends in the GDP share ... 6
2.2. Volume of investment in inland transport infrastructure ... 9
2.2. Modal split of investment ... 10
2.3. Road maintenance ... 11
3. SUMMARY OF POLICY PRIORITIES ... 13
3.1. Infrastructure and performance ... 13
3.2. Strategic plans and major projects ... 15
Strategic plans ... 15
Major projects ... 21
3.3. Funding ... 23
ANNEX: STATISTICAL TABLES 1995-2011 ... 24
1. INTRODUCTION
The International Transport Forum statistics on investment and maintenance expenditure in transport infrastructure are based on a survey sent to 52 member countries1. The survey
covers total investment (defined as new construction, extensions, reconstruction, renewal and major repair) in road, rail, inland waterways, maritime ports and airports, including all sources of financing. For maintenance, the questionnaire covers only expenditures financed by public administrations.
The lack of common definitions and practices to measure transport infrastructure spending hinders comparisons between countries and spending options. Data for road and rail infrastructure are the most comprehensive while data on sea port and airport spending are less detailed in coverage and definition. While our survey covers all sources of financing a number of countries exclude private spending, including Japan and India. Around 65% of countries report data on urban spending while for the remaining countries data on spending in this area are missing. Caution is therefore required when comparing investment data between countries. However, data for individual countries and country groups are
consistent over time and useful for identifying underlying trends and changes in levels of spending, especially for inland transport infrastructure. These issues of definitions and methods are addressed in a companion report Understanding the Value of Transport
Infrastructure – Guidelines for macro-level measurement of spending and assets (ITF/OECD
2013) that aims to improve the international collection of related statistics.
The ITF has collected and published data on this topic since the late 1970s. The latest survey covers years 1995-2011. In order to draw up a summary of aggregate trends for selected countries, data has been calculated in Euro values at both constant (2005) and current prices. In preparation for the International Transport Forum’s 2013 Summit on Funding Transport a survey was carried out to collect information on transport policies in ITF member countries and the information obtained is also summarised in the current report. The topics covered in the questionnaire include infrastructure performance
indicators, major projects, funding and strategic plans. Over 30 countries responded to the survey.The present report presents aggregate trends in inland transport infrastructure investment and maintenance since 1995 in Chapter 2. Chapter 3 presents some broad conclusions from the survey on transport policies. The Annex presents statistical tables on transport infrastructure investment and maintenance in International Transport Forum member countries for the period 1995-2011. Detailed country data, coverage, country responses from the survey as well as a detailed note on the methodology followed are available on the International Transport Forum website at:
http://www.internationaltransportforum.org/statistics/investment/invindex.html
1. Data contacts for new ITF states Chile and China were not yet available at the time of data collection.
2. TRENDS IN INLAND TRANSPORT INFRASTRUCTURE SPENDING
2.1. Trends in the GDP share
The most recent data on gross fixed capital formation (investment) in inland transport infrastructure (road, rail and inland waterways) as a percentage of Gross Domestic Product (GDP) shows a slowly declining trend for the OECD as a whole over the period since 1995. The investment share of GDP declined steadily from 1.0% in 1995 to 0.85% in 2004 after which it levelled off for few years. The level of investment rose temporarily between 2008 and 2009, likely driven by economic stimulus spending and declining GDP. After 2009, the investment share has declined back to 0.85% in the OECD area (Figure 1).
Figure 1. Investment in inland transport infrastructure in the OECD 1995-2011
(as a percentage of GDP, at current prices and exchange rates)
Source: International Transport Forum at the OECD estimate.
Note: OECD includes 31 countries; excludes non-ITF states Israel and Chile (at the time of data collection); no data for Korea. See methodological note on page 54 for details on data and coverage.
The International Transport Forum (and the former ECMT) has collected data on investment and maintenance expenditure on transport infrastructure since the late 1970s. In Western Europe, the investment share of GDP declined steadily from 1.5% in 1975 to 1.2 % in 1980 and further to 1.0% in 1982 after which it levelled off. Our latest data show that since 1995 the GDP share of investment in inland transport infrastructure has remained between 0.8% and 0.9% in Western European countries (WEC). There are only few exceptions from this trend, notably Greece, Spain, Switzerland and Portugal which show significantly higher GDP shares over the period (reaching 1.6% – 2.0%). Since 2007, however, Greece and Portugal have converged closer to the WEC average, investments declining to around 1.0% of GDP. Data for North America also show a constant GDP share (0.6%) below the OECD average.
0 0.2 0.4 0.6 0.8 1 1.2 1995 1996 1997 1998 1999 2000 2001 2002 2003 2004 2005 2006 2007 2008 2009 2010 2011 %
The latest estimates indicate a slight growth in investment as a share of GDP, reaching 0.7% since 2009. These changes are, however, marginal and the investment share of GDP has remained relatively constant both in Western European countries and North America (see Figure 2).
Figure 2. Investment in inland transport infrastructure by region 1995-2010
(as a percentage of GDP, at current prices and exchange rates)
Source: International Transport Forum at the OECD.
Note: WECs include Austria, Belgium, Denmark, Finland, France, Germany, Greece, Iceland, Ireland, Italy, Luxembourg, Netherlands, Norway, Portugal, Spain, Sweden, Switzerland, Turkey and the United Kingdom. CEECs include Albania, Bulgaria, Croatia, Czech Republic, Estonia, FYROM, Hungary, Latvia, Lithuania, Montenegro, Poland, Romania, Serbia, Slovakia and Slovenia. North America include Canada, Mexico and the United States. Australasia include Australia and New Zealand. Data for Japan exclude private investment.
Trends for developing and transition economies differ markedly from those described above. The share of investment in inland transport infrastructure in Central and Eastern European countries (CEECs), which until 2002 had remained at around 1.0% of GDP, has grown sharply, reaching 2.0% in 2009 – the highest figure ever reported by these
countries. Rising levels of investment in transition economies reflect efforts to meet rising needs especially for road network capital. Investment share of GDP fell to 1.7% in 2010, likely affected by the economic crisis. Data for 2011 show again increase, investment share reaching 1.8%. In the Russian Federation, investment share of GDP has also been high compared with Western European countries but more volatile. Investment in inland transport infrastructure as a percentage of GDP reached 1.9% in 2000 after which it has varied between 1.2% and 1.7%. For the last two years the share has remained at 1.4% of GDP.
Historically, transport infrastructure investment in Japan was relatively high in relation to GDP but has been in decline since the 1990s. Expenditures were affected by general budget cuts towards the end of the 1990’s. Subsequently, modification of the allocation of
revenues from gasoline tax, earlier earmarked for highway development and maintenance, has further reduced the level of investment in roads in Japan.
0 0.5 1 1.5 2 2.5
WEC CEEC North America Australasia Japan Russian Federation
An investment level of 1% per GDP became a de facto political benchmark in Western European countries in the 1980s, though with no theoretical basis behind it. The investment needs for transport infrastructure depend on a number of factors, such as the quality and age of the existing infrastructure, geography of the country and transport-intensity of the country’s productive sector, among other things. The fact that the share of GDP dedicated to transport infrastructure has tended to remain constant in many countries suggests that investment levels may be affected by factors other than real investment needs. Level of transport spending may be guided by historical budget levels, institutional budget allocation procedures or budgetary constraints taking into account also needs in the other sectors of the economy (e.g. education, health care). The impact of government policy can also be identified, as for example in Japan and in the data for Australasia. Here, the share of infrastructure investment in GDP grew 50% partly as a result of the last five-year investment plan in Australia. Australia added 10% of route-kilometres of railway track mainly to support the development of their mining industry in 2009–2012. New Zealand has invested in state highway network, rebuilding the land transport system in Christchurch and the surrounding Canterbury region following major earthquakes.
The difference between Western European countries and developing economies suggests there is a relationship between transport infrastructure spending and the level of income. Figure 3 plots total spending (investment and maintenance) on road infrastructure as a percentage of GDP against GDP per capita using data for over 40 countries between 1995 and 2011. This panel of over 600 observations gives strong support to the conclusion that the level of (road) spending generally declines with the level of GDP per capita.
There are several potential reasons for this declining trend. Further, as efficiency and productivity increase production becomes less transport intensive, potentially weakening the link between the GDP growth and transport demand and therefore infrastructure investments.
Figure 3. Relationship between road spending and level of income
Source: International Transport Forum at the OECD. 0 1 2 3 4 5 6 0 10000 20000 30000 40000 50000 60000 70000 80000 90000 Road spending per G DP (in cons tant 2005 Euor s, % )
GDP per capita (constant 2005 Euros)
ASIA AUSNZ CIS NAMER WEC CEEC
2.2. Volume of investment in inland transport infrastructure
The volume of investment (expenditure in real terms) in the OECD total (excluding Japan) has grown around 30% in the last 15 years. Japan has followed a different trajectory (volume nearly halving in the same period) and its economy is large enough to affect the overall volume for the OECD significantly. If data for Japan are included, the volume of investment in the OECD peaked in 2003 after which it has remained fairly stable slightly above the 1995 level. The latest data show a 6% fall in investment since 2009 as volume declines close to the 1995 level (Figure 4).
Figure 4. Volume of investment in inland transport infrastructure 1995-2010
(at constant 2005 prices, 1995=100)
Source: International Transport Forum at the OECD.
In Western European countries, the volume of investment started growing in 2002, and was nearly 30% above the 1995 level in 2006 after which the volume declined. The latest data for 2011 show volume only 10% higher than the 1995 level. The volume of inland infrastructure investment in North America grew by around 30% from 1995 to 2001. Our estimate suggests a slow decline in investment volume that continued all the way through 2008. Recent data indicate growth in the volume of investment in North America, returning to the 2001 level in real terms in 2011 (Figure 5).
The volume of infrastructure investment has accelerated strongly in developing and transition economies, notably in Central and Eastern European countries since 2003. This growth turned negative after reaching a record level in 2009. Investment in inland
transport infrastructure declined 11% in real terms from 2009 to 2010. Data for 2011 show a renewed growth as volume of investment grew again by 10% (Figure 5).
60 70 80 90 100 110 120 130 140 1995 1996 1997 1998 1999 2000 2001 2002 2003 2004 2005 2006 2007 2008 2009 2010 2011
Figure 5. Volume of investment in inland transport infrastructure by region 1995-2010
(at constant 2005 prices, 1995=100)
Source: International Transport Forum at the OECD. 2.2. Modal split of investment
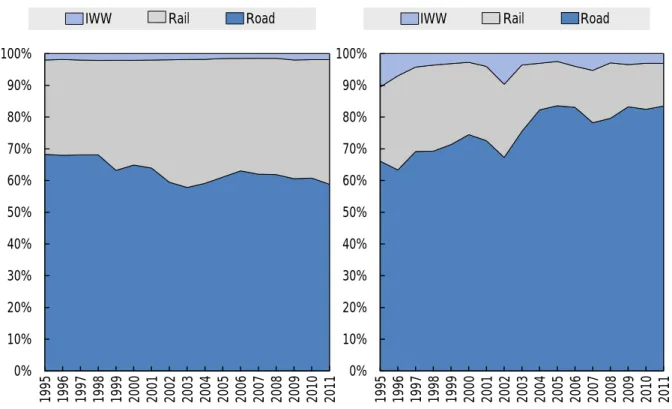
The share of rail investment of total inland transport infrastructure investment has increased from 17% to 23% for the OECD total from 1995 to 2011, according to our estimates. This trend is mainly determined by developments in Japan and Europe. Data presented in Figure 6 show long-run trends in the modal share of investment in Western European and Central and Eastern European countries. In the Western European countries, the share of investment in rail infrastructure has increased steadily from around 20% of total investment in inland transport infrastructure in 1975 to 30% in 1995 and further to 40% in 2011. The trend observed in our data for Western Europe is partly a reflection of political commitment to development of railways and the most recent data does not seem to indicate any change in this respect.
Whereas Western European countries have increasingly directed their investment toward rail, Central and Eastern European countries are investing more heavily in roads. The share of roads in inland transport infrastructure investment increased from 66% in 1995 to 84% in 2005 in this region. The last few years, however, suggest a stabilisation of the trend and the modal split of investment has remained at 2005 level in 2011 (Figure 5). Russian Federation differs from the above trends. The share of road has declined from 60% in 1995 to around 45% in 2011 of the total inland transport infrastructure investment. Rail share, in turn has increased from 37% to account for over half (53%) in the same period, according to our data. 0 50 100 150 200 250 300 350 1995 1996 1997 1998 1999 2000 2001 2002 2003 2004 2005 2006 2007 2008 2009 2010 2011
Figure 6. Distribution of infrastructure investment between modes
(Euros, current prices, current exchange rates)
Source: International Transport Forum at the OECD. 2.3. Road maintenance
In many countries observers have raised concerns about underfunding of road assets and the state of existing road infrastructure and its impacts on the competitiveness of the economy. Funding for road maintenance, particularly, may be postponed on the
expectation that a lack of maintenance will not result imminent asset failure. This concern is, however, difficult to verify due to lack of data on the condition of road assets.
The available data on road spending suggest that the balance between road maintenance and investment has been relatively constant over time in many regions. The share of public expenditure on maintenance in total road expenditure has remained between 25% and 35%. In the 28 OECD countries for which comparable data are available through 2009, the share of maintenance in total road spending grew overall from 27% in 1995 to 33% in 2005 after which it gradually declined, to 30% in 2009. This declining trend is reinforced by data on 18 OECD countries up until 2011 which suggest further decline to 27% in 2011. Data further suggest that funds allocated for road maintenance have declined especially in Central and Eastern European countries over the last few years, falling from above 35% in early 2000 to 26% of total road spending in 2011. In the eleven Western European
countries for which comparable data are available, data suggest a surge in maintenance spending in 2005 after which the maintenance share has gradually fallen back to previous levels (27% of total spending). Similarly, the road maintenance share in North America has gradually declined from 35% in 1995 to around 30% in 2009 after which lack of
comparable data hinders further analysis. 0% 10% 20% 30% 40% 50% 60% 70% 80% 90% 100% 1995 1996 1997 1998 1999 2000 2001 2002 2003 2004 2005 2006 2007 2008 2009 2010 2011
Western European countries
IWW Rail Road
0% 10% 20% 30% 40% 50% 60% 70% 80% 90% 100% 1995 1996 1997 1998 1999 2000 2001 2002 2003 2004 2005 2006 2007 2008 2009 2010 2011
Central and Eastern European countries
Although these conclusions are affected by the quality and coverage of data, they do suggest an overall declining share of maintenance on total road spending especially over the last few years (Figure 7).
Figure 7. Public road maintenance share of total road expenditure 2010
(Euros, current prices, current exchange rates)
Source: International Transport Forum at the OECD.
Note: OECD 18 include Austria,Canada, Czech Republic, Estonia, Finland, France, Iceland, Ireland, Luxembourg, Mexico, New Zealand, Norway, Poland, Slovakia, Slovenia, Sweden, Turkey and the United Kingdom. WECs include Austria, Finland, France, Iceland, Ireland, Luxembourg, Netherlands, Norway, Sweden, Turkey and the United Kingdom. CEECs include Albania, Croatia, Czech Republic, Estonia, FYROM, Latvia, Lithuania, Poland, Serbia, Slovakia and Slovenia.
20 22 24 26 28 30 32 34 36 38 1995 1996 1997 1998 1999 2000 2001 2002 2003 2004 2005 2006 2007 2008 2009 2010 2011 %
3. SUMMARY OF POLICY PRIORITIES
A survey was carried out in 2012/2013 to collect information on transport investment policies in ITF member countries. The topics in the questionnaire include infrastructure performance, major projects, funding and strategic plans.
3.1. Infrastructure and performance
All 31 countries participating in the survey emphasise that transport plays a vital role in economic and social development. Regardless of country, it facilitates trade, stimulates economic growth and connects different communities. All countries, both advanced and emerging economies, cite the importance of an efficient and reliable transportation system. Efficient transport infrastructure is seen as important in providing economic and social benefits by improving market accessibility and productivity, ensuring balanced regional economic development, creating employment and promoting labour mobility. Deficiencies in the transport infrastructure and related performance (e.g. reliability, vulnerability), are considered a cost to the economy and society.
The results of the survey show that advanced economies and emerging economies have different priorities for the infrastructure development. Infrastructure construction, network improvement and rolling stock renewal are keywords for many Central and Eastern
European countries. Advanced economies, where extensive transport networks are already well developed, stress the importance of improving the performance and safety of
infrastructure while minimizing environmental impacts.
Middle income countries focus mainly on construction and rehabilitation of inland transport infrastructure because a network of sufficient quality is either incomplete or the
infrastructure is in poor condition. Railways and roads are priorities for construction and rehabilitation. The examples below from the survey reveal an urgent need to construct new infrastructure and improve the quality of existing infrastructure. This is reflected in rising levels of investment in developing economies (see Figure 1) reflecting efforts to
compensate for the earlier underinvestment in capital stock, reinforced by growing traffic in growing economies.
• One third or 2 400 km of road in Montenegro is unpaved. There are no motorways.
• Despite Serbia’s geographical location on important transport corridors – the cross road of 8 countries in Southeast Europe – its motorway network density is only 4.8 km/1 000 km2, compared with Austria (20.97 km/1 000 km2) or the Czech
Republic (13.3 km/1 000 km2).
• Although the rail network density in Serbia is comparable to the EU average,
Serbian railway lines are affected by extensive speed restrictions. About 50% of the rail network allows maximum speed of only up to 60 km/h.
• Rail transport delays in Slovakia occur due to obsolescence and depreciation of materials and equipment, bridges and culverts which are at the end of their technical lifetime.
The survey shows that advanced economies focus on the quality of transport service and its impact on social well-being in their transport strategies. Seamlessness, efficiency and safety are important considerations in strategic plans. Environment and noise reduction are also important elements of national transport policies, incorporating environmental
protection to tackle climate change, with ambitious CO2 reduction goals. To illustrate the point, Germany and France aim to reduce CO2 emissions by 40% and 20% respectively by 2020, and 80% and 75% respectively by 2050.
Although the transportation system in many developed economies is generally of high quality and efficient, road congestion (and related unreliability) is still a major issue in many countries - particularly in and around major cities. The survey indicates that
countries expect to see significant growth in the levels of congestion in the longer term as economies recover from recession. These challenges are different from many Central and Eastern European countries which report bottlenecks due to dilapidated, inadequate road networks which are in urgent need of rehabilitation or complete reconstruction.
Punctuality is perceived as a major rail performance issue and rail capacity faces
infrastructure bottlenecks in many regions. For example, punctuality for both passenger and freight trains has been decreasing in Sweden due to infrastructure capacity constraints, especially in the busy Stockholm–Gutenberg and Stockholm–Malmö corridors. Similar capacity problems, including not only infrastructure but also frequency of service, are echoed by the United Kingdom and Austria, reporting passenger crowding during peak hours. The developing economies also cite “obsolete equipment” and dilapidated and insufficient infrastructure as a cause for delays.
Several responses suggested increasing usage of “network intelligence” and better coordination as a measure to improve railway performance. The following examples illustrate these measures:
•
To alleviate congestion in the corridor through the Rocky Mountains, Canada’s two major railways operate in co-production “double tracking” mode, meaning that one railway’s single track line will be used for travel in one direction and the other railway’s track will be used in the other direction.•
In Sweden, the combination of traffic with different speeds entails in itself a limitation of capacity – a limitation that can be reduced with more intelligent systems for prioritising and separating different types of traffic.Many countries believe that inland waterways could potentially play a bigger role in freight transport to relieve road and rail congestion. It is considered an environmentally
sustainable mode of transport. Inland waterways are part of the Trans-European Transport Network (TEN-T) planning. It is also a vital mode of transport in North America, connecting the Great Lakes through St Lawrence Seaway to the Atlantic Ocean.
Overall, there is still capacity reserve for inland waterways despite aging infrastructure in general. In the transition economies, the performance of inland waterways is affected by missing links, such as missing E20–E30 connection (Danube-Oder-Elbe) and E51 (Vah-Odra) sections in Slovakia. Serbia reported 24 critical sections on the Serbian part of Danube which require dredging of riverbed and/or special training on navigation.
In general, central governments play less direct role in the development and financing in aviation and maritime sectors. However, government agencies do normally create a regulatory environment to oversee the commercial activities of airports and seaports, ensuring a certain level of service quality in line with national interests. In many countries, airports and seaports are privatised legal entities and thus investment and maintenance figures may not be publicly available (see Annex tables). Countries covered in the survey reported continuous investment to improve the performance of aviation and maritime infrastructure. Major construction projects are mainly reported in middle income countries where existing infrastructure is in need of upgrade.
Airport punctuality is a concern shared by several countries. To illustrate this, the ten major airports in the United Kingdom recorded more delays than the EU average. London
Heathrow runway and passenger terminals operate at full capacity as does Gatwick’s runway. Tokyo, with the 3rd busiest city airports system, also experiences air-side traffic
congestion. To enhance airport capacity, Japan has implemented a range of projects at Narita and Haneda, constructing new runways and terminals. Efforts are also made to improve air traffic control system as part of the projects.
Environmental and social factors may also impact aviation sector performance. For example, Stockholm Arlanda Airport’s emissions ceiling and noise pollution requirements lead to considerable limitations of the accessibility of air traffic to the airport and the scope of overall air traffic.
Sea ports are integral to the freight transportation system. Both coastal and landlocked countries acknowledge the importance of multimodal transportation to connect the hinterland to maritime ports. Port capacity and efficiency are critical to economic
performance and new tools for performance measurement that better reflect efficiency and reliability are under development in several countries. For example, Canada has introduced new port utilization indicators and supply chain fluidity indicators.
Some seaports are close to capacity, such as Felixtowe container port in the UK and are being expanded coupled with new port development in less constrained conditions elsewhere (London gateway). Even where seaports have additional capacity to handle more cargo, there are often major projects to improve land-side accessibility. Examples include the Port of Antwerp and Port of Zeebrugge in Belgium.
3.2. Strategic plans and major projects Strategic plans
A number of broad conclusions may be drawn from the responses to the survey despite the very diverse economic and social development among member countries. Most countries formulate their strategic plans around three main themes:
• Economic performance; • Environment; and • Safety.
All strategic transport policies aim to deliver an effective, efficient, safe and accessible transport system that supports economic growth with minimum adverse environmental impact.
Economic performance
All countries emphasise the vital role of transportation in facilitating trade movement and economic growth, employment and social inclusion. Economic competitiveness is
unanimously cited as the first and foremost objective of national transport strategy. With global supply chains evolving, trade movement on the rise and new markets
emerging, governments and private stakeholders emphasise the urgent need to establish or improve both the capacity and efficiency of logistics network. For example, freight transport and logistics are now the 3rd largest sector of the German economy with an
annual turnover of more than 220 billion Euros and 3 million employees. With its central geographical location in Europe, one of the main objectives of Germany’s transport policy is to enhance the competitiveness of Germany as a centre for logistics.
Many responses highlighted the importance of trade corridors and a need to further improve connectivity to ensure efficient and seamless flows of cargo. Maritime transport remains the backbone of international trade, with over 80% of world cargo by volume transported by sea. Ports are therefore critical links in global supply chains. Hinterland connections are increasingly central to the competitiveness of ports and the overall efficiency of the supply chain. High quality road, rail and inland shipping links greatly extend the reach of ports and high volume connections offer the possibility of locating key services – warehousing and even customs processing – away from constrained waterfronts.
Canada’s gateways and trade corridors: a system-wide approach
To strengten Canada’s economic competitiveness and facilitating more international trade, the Canadian government released the National Policy Framework identifying three
strategic gateways and corridors:
- Asia-Pacific Gateway and Corridor Initiative; - Ontario-Québec Continental Gateway; - Atlantic Gateway and Trade Corridor.
Canada’s gateways and trade corrdiors
Each gateway/corridor focuses on Canada’s external trade with particular regions. Strategic transportation infrastrcuture projects have been laid out to develop a sustainable, secure and efficient multimodal transportation system that supports businesses. Since 2007, substantial information gathering, analysis and consultation with private stakeholders has allowed Transport Canada to identify real issues and challenges which impact the efficiency of the corridors.
A fluidity indicator was developed in 2008 in order to evaluate how gateways and strategic trade corridors interact together operationally. This indicator examines end-to-end supply chain performance by focusing on the time component – measuring the total transit time of inbound containers from overseas markets to strategic North American inland destinations via various Canadian gateways. Initial phases of this indicator project targeted inbound container movements for Pacific Gateway markets (British Columbia ports) with future phases to cover inbound movements and outbound movements at other gateways.
Several major transport infrastructure projects initiated in Central and Eastern European Countries (CEEC) aim to complete the core network within the Trans-European Transport Network (TEN-T) corridor. Establishing an efficient trans-European transport network constitutes a key element in the re-launched Lisbon Strategy for competitiveness and employment in Europe and plays an equally central role in the attainment of the objectives of the Europe 2020 Strategy. The European Union is supporting implementation of Europe’s strategic TEN-T transport network through several financial instruments – the TEN-T
programme, the European Cohesion Funds, the European Regional Development Fund and the European Investment Bank’s loans and credit guarantees, including its new Project Bond.
Major transport infrastructure projects in the Czech Republic
The basic core network to support development of the TEN-T corridors is scheduled to be completed by 2030 and with the comprehensive network to be completed by 2050. A list of selected transport infrastructure projects in the Czech Republic follows:
• Modernisation of Class 1 roads with a focus on building expressways and by-passes for towns and in sections with sufficiently dense traffic flows, with the reconstruction of selected Class 1 roads into motorways (by 2050);
• Completion of railway transit corridors (by 2018) and modernisation of the other routes within the TEN-T network and tracks of national importance (connection of all regions to high-capacity railway infrastructure by 2050);
• Modernisation of railway junctions on the TEN-T network (by 2018, the Prague and Brno junctions by 2030);
• Modernisation of routes which are important for servicing large industrial zones (e.g. Mladá Boleslav, Kvasiny, Nošovice and others);
• Ensure interoperability of the railway network, introduction of GSM-R (Global System for Mobile Communications – Railway), ensure interoperability of the railway network,
introduction of European Train Control System;
• Construction and modernisation of inland water routes within the core TEN-T network; • Development of the logistics of freight transport, building a network of multimodal
transport terminals to parameters based on the AGTC agreement (European Agreement on Important International Combined Transport Lines and Related Installations) ;
• Support for the introduction of intelligent transport system in all modes of transport including on-board applications (on an ongoing basis).
Environment
Countries participating in the survey acknowledge environmental protection as one of the main elements in their strategic transport policies. Many advanced economies have set ambitious targets for achieving environmentally sustainable transport systems, aiming for an efficient transport system which is also highly resilient towards climate change and contributes to achieving a low carbon economy to ensure long term sustainable
development. For example, South Korea, emphasised strategies for green transportation addressing climate change in its 2nd Revised National Intermodal Transport Plan in 2011.
Transport policy will play an even greater role in protecting the environment and tackling climate change. Emerging economies also stress the importance of minimizing
environmental impacts although the transport policies are more directed towards physical construction of infrastructure.
Achieving environmental sustainability does not necessarily require extensive investments and countries proposed a number of measures for improving the carbon footprint of the transport system. These include:
• Improve local public transport in urban and rural areas – individual trips account for the largest percentage of energy consumption and increase avoidable congestions.
• Shift more traffic to railways and waterways where this is viable and appropriate - truck transportation uses significantly more fuel per tonne-kilometre of freight moved than does freight transport on waterways and railways.
• Make smarter use of existing infrastructure and bring it to optimum level of use by creating an integrated network and developing electronic traffic management systems and other technological solutions.
Emission reduction strategies and targets in Germany
Across all sectors, the German Government is committed to reducing CO2-emissions by 40% by 2020 and by 80% by 2050. As a consequence, besides expanding the use of alternative fuel options, the Government is keen on mainstreaming battery-electric and Hydrogen-powered drive trains as a major component towards reducing transportation’s dependency on fossil fuels and CO2 emissions, especially in connection with a shift of the energy system towards renewable sources.
In May 2011, the German Federal Government adopted a comprehensive Electric Mobility Programme as part of an overall strategy towards turning mobility into a more
environmentally and climate-friendly direction. The Federal Government has joined forces with the private sector, academia, the Federal States, municipalities and other stakeholders and is providing substantial funding for a wide range of research and demonstration
projects for advancing vehicle technology and establishing the corresponding infrastructure. To achieve a more sustainable transport system, the Government’s policy approach is based on a triangle of knowledge provision, research and innovation and investment in modern infrastructure. Taking care of social inclusion and aiming for an optimized share between alternative transport modes based on their specific qualities is an integral part of the approach.
Safety
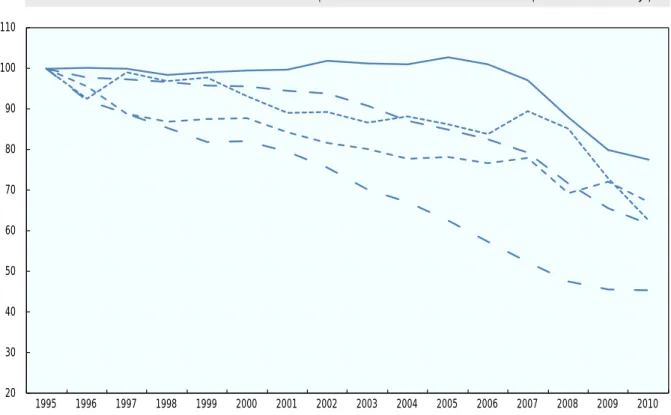
Several countries identify road safety as a priority and have set quantitative targets to reduce road fatalities. Indeed, road deaths continue to decrease in most of the countries, carrying forward the significant reductions in the number of road deaths accomplished already. The average annual reduction in the number of deaths between 2001 and 2010 has been higher than in the three preceding decades. Increasingly effective road safety policies have contributed to this development.
Figure 8. Road fatalities 1995-2010 (1995=100)
Source: International Transport Forum at the OECD.
Countries have different policies and implement various measurements to ensure safe and secure transport. The examples below illustrate projects to improve traffic safety:
• Projects in Iceland to improve traffic safety include widening sections of three major roads connecting to the capital area to separate opposing traffic flows, replacing old mountain roads by a tunnel project in Dýrarfjörðurt and constructing a network of bicycle infrastructure with over and underpasses to connect all the municipalities in the capital area.
• Establishment of a disaster resistant regional network in Japan by developing high standard arterial highways that connect major cities and developing ring roads to secure routes for evacuation, rescue and logistics in case of a large scale earthquake in Tokyo, in addition this will alleviate congestion.
20 30 40 50 60 70 80 90 100 110 1995 1996 1997 1998 1999 2000 2001 2002 2003 2004 2005 2006 2007 2008 2009 2010 North America Australasia Western European countries Central and Eastern European countries Japan
Major projects
Major transport projects mentioned in the survey reflect the three strategic themes above. The majority of transport infrastructure investments are directed on roads (see also
Chapter 2.2). Major projects include investment in national roads and motorways, by means of new construction, expansion of existing infrastructure and improvement of infrastructure quality.
Other common projects involve building bypasses or city tunnels to relieve bottlenecks around urban areas (e.g. Sweden) and the development of ring roads in major
metropolitan areas to alleviate traffic congestion (e.g. Japan). Many projects are also related to the construction and rehabilitation of tunnels and bridges (e.g. Gotthard road tunnel and Belchen road tunnel in Switzerland, new bridges connecting Ontario to Michigan and the island of Montréal to the South Shore in Canada).
Railways have in recent years received increasing attention in all regions. Electrification and modernisation of tracks to accommodate higher speed trains are priorities for several Central and Eastern European countries, including Slovenia, Slovakia, Serbia, Czech Republic and Moldova. Railways have an important role in Russian transport policy
connecting western Russia to its Eastern territories. Western European countries, including Germany, France and the United Kingdom as well as Japan and South Korea all have current and future projects to expand their high speed rail networks. In Switzerland, the new Lötschberg rail tunnel was opened to traffic in June 2007 and the new Gotthard Base tunnel will be operational at the end of 2016.
Current and future railway projects in Turkey
Turkey has an extensive rail infrastructure investment program, including High Speed Rail projects, construction of new lines and double-tracking, renewal and rehabilitation of existing tracks as well as electrification and signalization projects. The High Speed Rail projects will significantly reduce the journey time between major cities. Construction of new conventional lines and double-tracking projects involve nearly 200 kilometres of new tracks with overall future length of the second tracks extending more than 330 kilometres. More than 6 400 kilometres of tracks have been renewed in the last nine years while the plans for 2012 include more than 100 kilometres of tracks to be renewed.
Major projects on inland waterways focus mainly on building new locks, upgrading canals systems and connecting the missing sections within the TEN-T corridor in Europe. Parallel to the trend in Europe, where the transport policy increasingly emphasises the use of inland waterways, the United States Transportation Secretary launched the “America Marine Highway program” in 2010 to improve the use of inland waterways and coastal shipping.
America Marine Highway program
The America Marine Highway program consists of 11 corridors, 4 connectors and 3 crossings. This is the first step of efforts to gradually use waterways and coast lines to relieve congestion along surface corridors; the vast majority of American freight movements are transported by truck. It will also achieve reduced greenhouse gas emissions and energy savings. The project can potentially create new employment for skilled mariners and shipbuilders, and help start businesses along the corridors, with federal grants made available to support the initiatives. There are specific initiatives in upgrading aging locks and other infrastructure along the St Lawrence and Great Lakes seaways.
USA Marine Highway Corridors
Projects for upgrading and modernizing airports and seaport facilities are underway in all countries. As with airports, the performance of a seaport relies heavily on its accessibility. First rate facilities and efficient operations in the port are not sufficient, intermodal
accessibility with to a reliable logistics network is required. Inland transport, especially road and rail usually forms the bacbone network, facilitating the fluidity of freight cargo
transported to/from the ports. Several countries report major investment projects both in airport and seaport capacity. Examples of these include:
• BAA (now Heathrow) is investing over GBP 5 billion between 2008-2014 period in various upgrades, which include GBP1 billion for the construction of a new Terminal 2 to accommodate 20 million passengers per year.
• Zurich Airport has several current and future projects including upgrading its
passenger terminal, renovating facilities and replacing its obsolete noise baffles to a new fully enclosed noise protection hangar.
• In December 2008, the EBRD and European Investment Bank signed a loan agreement worth 45.25 million Euros with Chisinau Airport (Moldova) for its modernization project.
• One of the major projects in Mexico is the expansion of the Port of Lazaro Cardenas, one of the largest deep-water ports. Over USD 400 million will be invested to triple the port container handling capacity, build a new terminal for mineral bulk cargo and to construct 180 metres of dock and other dredging works for 15 new berths. In addition, 53 million USD has been set aside for bridge construction to better connect the port to the highway network.
3.3. Funding
Public budgets remain the principal source of funding for transport infrastructure investment. However, the survey indicates that countries are increasingly looking for alternative ways for funding transport infrastructure. Nearly all countries indicated the use of Public-Private Partnership (PPP) in transport infrastructure projects. The level of private participation differs widely by type of asset. Other sources of funding, mainly for CEECs, include financial arrangements under various EU programmes, the European Investment Bank, and EBRD and World Bank loans.
Road investments are generally publicly financed. Investment funds, used in some countries, are usually financed through a combination of contributions from the general state budget and gasoline and diesel tax revenues. Other revenues include automobile import tariffs (e.g. South Korea), driver license fees (e.g. Canadian provinces and American states) or motorway charges (e.g. Switzerland).
Significant private finance is raised for local road investment funds and airports through the sales of state and municipal bonds (e.g. in the USA). With the tightening of limits on
spending under state budgets, private investment through public-private partnerships are increasing solicited for the development and investment of road transport projects, mainly on motorways, bridges and tunnels. The regulatory framework for public-private
partnerships has recently been reformed in a number of countries to create standard model contracts (e.g. India) and limit contingent liabilities (e.g. UK) (see Better Regulation of
Private-Public Partnerships for Transport Infrastructure, International Transport Forum
2013). Some countries that have so far seen relatively little use of private-public
partnerships for transport infrastructure, such as the USA, may see a significant increase in the volume of transactions in the future. More generally, transactions are suppressed by a shortage of debt finance as a result of the financial crisis. Some countries have made very limited, or no use of PPPs for road infrastructure, including Sweden, New Zealand, Iceland and the Swiss Confederation.
In the railway sector, infrastructure investments are most often financed by the
government. The USA and Canada are notable exceptions. In most European countries, railway operators are state owned enterprises. In Germany, for example, the Federal government is responsible for funding new construction and upgrading the infrastructure. However, railway infrastructure companies have to bear the maintenance cost of the rail network through a charge for the use of the network according to the European Union regulation on track access charges. In Japan, the construction costs of high speed rail lines
are shared by the national and local government. Whilst maintenance and renewal of the trunk lines is the responsibility of the privatised railways, for extensions and new lines that are not able to generate a commercial return, funds are given to JRTT (Japan Railway Construction, Transport and Technology Agency) to construct the lines. On completion, JRTT leases the tracks to operators. In the United States, the major party responsible for investment, maintenance and capacity enhancement are the Class 1 freight railroads. On projects where a major public benefit is possible, local/state/federal governments may share funding of improvements.
Investment in inland waterways in Europe and North America (e.g. St Lawrence and the Great Lakes seaways system) are funded mainly by public money.
Funding for airports and seaports depends very much on their legal ownership but usually large hub-airports are financially independently through (usually regulated) landing charges while small aerodromes receive public funding. Depending on the country, major airports and seaports are either privately owned (e.g. UK) or state own enterprises or entities with a public-private partnership status (e.g. most continental European countries) while minor aerodromes and ports are usually owned by local municipalities. Airport costs are covered by user charges, i.e. passengers and airline, and increasingly by non-aviation related revenues, i.e. parking, retail, advertising, food and beverages, rents for the use of airport property – hotels, warehousing etc. Other sources of funding include public funds or bonds (e.g. USA).
Seaport revenues come generally either from fixed or variable port tariffs and other dockage or wharf charges. In Mexico, ports operate under a public-private association scheme, which is adapted from the Build-Operate-Transfer (BOT) model. Ports are often self-sufficient and make their own investments. Private investments are normally geared to the construction or upgrade of operation facilities (e.g. cargo terminals, warehouses) while long term port investment like entrance channels, coastal protection and breakwaters are entirely financed by public money.
The recent economic crisis has had an impact on funding on transport infrastructure in most of the countries examined. In addition to increased interest in public-private partnerships, the reported impact general falls under one of three categories:
• A certain level of austerity is in place, with a budget squeeze on transport funding; • Transport infrastructure spending has increase because of economic stimulus
packages;
• Following the crisis and slow-down in the construction sector, costs fell below anticipated levels and this lead to the acceleration of some infrastructure development projects.
ANNEX: STATISTICAL TABLES 1995-2011
Table A1. Investment in road infrastructure, million Euros, current prices and exchange rates Table A2. Investment in rail infrastructure, million Euros, current prices and exchange rates
Table A3. Investment in inland waterway infrastructure, million Euros, current prices and exchange rates Table A4. Investment in sea port infrastructure, million Euros, current prices and exchange rates Table A5. Investment in airport infrastructure, million Euros, current prices and exchange rates
Table B1. Maintenance expenditure in road infrastructure, million Euros, current prices and exchange rates Table B2. Maintenance expenditure in rail infrastructure, million Euros, current prices and exchange rates
Table B3. Maintenance expenditure in inland waterway infrastructure, million Euros, current prices and exchange rates Table B4. Maintenance expenditure in sea port infrastructure, million Euros, current prices and exchange rates Table B5. Maintenance expenditure in airport infrastructure, million Euros, current prices and exchange rates Table C1. Gross Domestic Product, 1000 billion Euros, current prices and exchange rates
Table C2. Population Table C3. Deflators
Table C4. Euro conversion rates
Table A1. Investment in road infrastructure, million Euros, current prices and exchange rates Country 1995 1996 1997 1998 1999 2000 2001 2002 Albania 15 14 28 73 108 108 65 Armenia Australia 2 424 2 926 3 332 3 536 3 930 3 697 3 259 3 429 Austria 457 426 365 430 391 475 640 532 Azerbaijan 1 30 48 47 Belarus Belgium 1 069 987 954 1 134 1 253 1 300 1 173 995 Bosnia Bulgaria Canada 3 576 3 335 3 478 3 155 3 210 3 728 4 396 3 981 Croatia 71 135 185 341 340 304 305 616 Czech Republic 283 306 382 374 323 309 303 518 Denmark 352 404 400 388 419 455 497 399 Estonia 8 12 10 17 21 22 22 47 Finland 457 429 436 443 458 488 508 520 France 10 439 10 504 10 390 10 164 9 924 10 545 10 376 10 160 FYROM 36 35 31 29 29 29 29 37 Georgia 18 33 42 Germany 10 216 11 126 10 916 10 850 11 146 11 967 11 558 11 100 Greece 1 402 1 604 1 692 Hungary 131 123 299 281 209 177 237 283 Iceland 75 69 81 140 110 129 109 123 India Ireland 283 281 375 446 606 780 908 1 084 Italy 4 980 5 052 5 144 6 258 6 365 6 930 4 582 5 071 Japan 71 561 62 572 60 876 60 366 69 806 79 260 67 594 59 979 Korea 72 69 Latvia 3 4 2 2 6 13 16 12 Liechtenstein 14 28 26 27 23 24 30 30 Lithuania 15 24 40 96 130 109 70 112 Luxembourg 114 107 101 113 146 166 186 213 Malta 3 7 10 8 7 11 8 16 Mexico 579 540 1 287 806 1 112 1 283 1 150 1 447 Moldova 1 10 14 8 2 2 1 2 Montenegro 1 Netherlands 1 122 1 350 1 500 1 727 1 847 2 279 New Zealand 169 181 Norway 826 782 869 952 1 002 909 1 018 1 161 Poland 638 180 227 299 297 1 019 1 094 1 035 Portugal 737 748 970 905 552 961 1 685 1 620 Romania 356 394 456 487 441 631 736 634 Russia 1 883 2 452 3 108 2 348 1 665 2 579 2 345 2 078 Serbia 28 75 148 75 33 57 80 139 Slovakia 53 79 315 300 204 227 201 260 Slovenia 186 284 293 263 352 372 284 337 Spain 4 263 4 010 3 977 4 787 4 328 4 792 5 558 6 874 Sweden 912 1 014 891 1 046 926 912 1 007 1 295 Switzerland 2 520 2 419 2 336 2 298 2 603 2 716 2 765 2 847 Turkey 157 281 503 401 361 408 331 348 Ukraine United Kingdom 5 224 4 864 5 082 4 783 4 758 5 564 5 930 6 247 United States 30 335 32 522 40 438 42 780 49 231 61 267 69 359 63 701
Table A1. Investment in road infrastructure, million Euros, current prices and exchange rates (cont.) 2003 2004 2005 2006 2007 2008 2009 2010 2011 Country 61 91 68 175 253 500 487 242 210 Albania Armenia 4 086 5 194 6 736 6 973 8 025 9 263 9 196 11 200 13 792 Australia 650 720 687 802 870 875 665 390 303 Austria 34 48 82 260 374 1 327 1 272 1 545 1 562 Azerbaijan Belarus 1 118 1 432 1 562 1 508 1 281 1 432 1 432 Belgium Bosnia 272 166 134 169 101 281 344 Bulgaria 3 938 4 174 5 497 6 780 7 810 8 751 10 891 15 394 15 061 Canada 1 047 877 750 875 1 066 1 101 909 515 466 Croatia 627 1 031 1 415 1 491 1 493 2 041 1 985 1 721 1 294 Czech Republic 587 728 928 1 191 1 029 936 714 937 Denmark 48 56 102 130 126 142 119 137 158 Estonia 533 599 595 650 802 973 922 890 932 Finland 10 448 11 271 11 355 12 099 12 489 12 623 12 648 11 942 11 876 France 42 28 23 23 39 45 43 32 38 FYROM 41 40 62 91 122 124 219 232 216 Georgia 10 790 10 710 10 200 10 730 10 845 11 410 12 160 11 710 11 610 Germany 1 636 1 507 1 592 1 845 1 946 Greece 243 1 427 1 704 584 646 976 1 564 841 Hungary 171 143 152 211 186 242 121 79 39 Iceland 2 332 3 832 4 606 5 403 5 817 6 235 India 1 169 1 190 1 153 1 495 1 425 1 319 1 173 841 463 Ireland 6 874 7 572 9 169 14 280 13 664 13 051 5 641 3 389 Italy 49 862 43 290 40 103 36 585 31 560 31 861 37 207 35 774 Japan 67 57 60 61 58 19 Korea 58 63 161 181 241 265 135 140 224 Latvia 25 26 27 Liechtenstein 142 137 165 242 312 437 448 422 343 Lithuania 188 135 128 176 157 138 148 183 220 Luxembourg 13 10 8 Malta 1 683 1 999 2 854 2 542 2 164 2 545 3 023 3 938 3 912 Mexico 2 4 2 6 28 26 13 14 Moldova 1 4 3 37 51 11 23 18 15 Montenegro 2 328 2 334 1 636 1 654 1 680 2 194 2 363 2 300 2 287 Netherlands 200 269 347 396 487 512 579 732 840 New Zealand 1 074 1 138 1 463 1 474 1 718 1 985 2 396 2 622 2724 Norway 1 010 1 237 1 875 2 605 3 443 4 508 5 340 6 510 8 319 Poland 1 537 1 933 2 112 1 940 1 453 1 366 951 1 511 Portugal 707 1 095 1 331 1 950 2 806 3 891 3 105 2 850 3 283 Romania 2 113 3 182 3 790 4 872 7 299 9 899 6 240 6 210 8 414 Russia 169 185 174 351 406 379 252 229 339 Serbia 210 240 360 411 520 567 662 342 432 Slovakia 470 496 450 573 666 694 406 221 128 Slovenia 7 321 7 244 8 580 8 411 8 077 8 522 8 588 7 818 5 911 Spain 1 399 1 443 1 298 1 407 1 423 1 604 1 574 1 653 1 871 Sweden 2 734 2 730 2 766 2 711 2 674 2 840 2 997 3 388 Switzerland 377 634 921 1 967 1 947 2 233 2 918 5 419 5 181 Turkey Ukraine 5 195 4 949 5 632 6 341 6 202 6 043 6 583 6 472 5 147 United Kingdom 53 075 48 959 52 890 58 538 54 360 53 576 56 711 59 893 55 532 United States
Table A2. Investment in rail infrastructure, million Euros, current prices and exchange rates Country 1995 1996 1997 1998 1999 2000 2001 2002 Albania 3 1 1 2 2 1 6 Armenia Australia 571 803 748 648 565 411 367 663 Austria 521 590 710 979 1 120 1 199 1 071 1 191 Azerbaijan 10 6 5 9 25 Belarus Belgium 668 537 635 637 764 1 012 856 1 049 Bosnia Bulgaria 44 27 14 23 22 78 78 51 Canada 291 276 411 480 512 608 474 452 Croatia 7 13 29 25 25 19 21 36 Czech Republic 112 160 280 302 269 371 394 473 Denmark 726 1 034 872 818 635 564 460 478 Estonia 4 0 0 15 24 19 15 18 Finland 226 192 224 254 264 233 204 225 France 2 766 2 963 3 024 2 879 2 891 2 955 2 444 3 045 FYROM 8 8 7 7 9 9 7 9 Georgia 42 Germany 5 747 5 200 4 745 4 423 7 350 5 305 5 481 7 437 Greece 591 304 983 Hungary 85 103 80 136 188 197 228 278 Iceland X X X X X X X X India 789 2 408 2 490 Ireland 29 2 9 4 5 85 141 237 Italy 1 950 2 013 2 078 2 170 3 681 4 549 4 856 5 525 Japan 8 456 7 520 6 198 6 187 8 309 10 139 9 590 9 095 Korea 31 35 Latvia 7 10 21 27 26 38 30 36 Liechtenstein X X X X X X X X Lithuania 4 17 22 29 20 18 25 58 Luxembourg 23 168 29 36 30 39 72 69 Malta X X X X X X X X Mexico 168 157 234 282 382 430 365 338 Moldova 5 4 5 3 1 1 2 8 Montenegro Netherlands 487 503 488 710 816 1 348 New Zealand Norway 324 489 390 349 197 363 199 189 Poland 248 282 307 337 237 198 113 108 Portugal 196 260 476 536 342 401 418 523 Romania 72 51 43 46 30 43 57 106 Russia 1 161 1 482 1 722 982 1 180 2 612 3 271 2 053 Serbia 13 17 20 32 16 3 4 6 Slovakia 59 107 121 64 37 53 170 241 Slovenia 16 15 20 Spain 767 816 686 944 1 391 1 840 2 456 3 652 Sweden 1 141 1 049 701 763 683 590 557 666 Switzerland 1 079 1 170 1 232 1 290 1 343 1 463 1 644 2 012 Turkey 45 48 61 68 81 73 58 72 Ukraine United Kingdom 2 414 2 734 3 363 3 909 4 820 4 874 5 876 6 749 United States 3 301 4 111 5 169 6 058 5 668 7 021 6 891 6 097
Table A2. Investment in rail infrastructure, million Euros, current prices and exchange rates (cont.) 2003 2004 2005 2006 2007 2008 2009 2010 2011 Country 1 2 2 1 1 1 0 0 1 Albania Armenia 749 1 106 1 493 1 252 1 962 1 727 2 285 3 612 5 492 Australia 1 145 1 335 1 330 1 489 1 505 1 683 2 062 1 936 2 143 Austria 5 7 19 12 4 11 2 3 3 Azerbaijan Belarus 959 976 916 1 012 1 009 1 223 1 223 Belgium Bosnia 26 31 46 39 44 72 50 130 90 Bulgaria 490 356 572 599 646 617 493 699 842 Canada 104 128 94 122 92 126 98 83 81 Croatia 417 411 485 465 612 1 217 740 564 447 Czech Republic 338 342 241 178 232 373 357 396 863 Denmark 16 20 20 21 30 23 37 35 94 Estonia 275 328 281 234 211 327 361 288 355 Finland 3 634 3 680 4 118 4 214 4 505 5 119 5 047 4 915 5 148 France 3 0 1 1 1 2 4 2 0 FYROM 19 11 14 62 212 48 80 78 249 Georgia 7 228 6 404 3 411 3 971 3 836 3 816 3 412 3 807 3 920 Germany 1 699 1 786 278 239 253 Greece 280 155 171 91 376 298 317 275 Hungary X X X X X X X X X Iceland 1 314 1 504 1 425 1 328 1 437 1 501 2 515 2 994 3 080 India 247 184 184 172 244 Ireland 7 403 8 809 10 175 8 970 7 702 7 109 5 687 4 773 Italy 7 523 6 217 6 057 6 736 6 883 7 367 9 602 11 308 10 198 Japan 34 30 38 38 37 Korea 41 33 40 33 37 61 64 78 54 Latvia X X X X X X X X X Liechtenstein 85 70 68 50 76 85 67 107 116 Lithuania 88 107 127 104 138 150 172 157 150 Luxembourg X X X X X X X X X Malta 201 192 223 370 563 498 438 435 649 Mexico 10 6 9 6 10 25 8 7 7 Moldova Montenegro 1 298 1 051 1 100 703 845 820 778 1 097 1 136 Netherlands New Zealand 200 222 193 258 310 286 358 479 528 Norway 194 220 236 353 647 904 650 690 925 Poland 704 484 415 307 329 392 360 403 333 Portugal 99 58 109 102 311 316 177 169 161 Romania 3 231 3 648 4 021 4 168 5 436 9 507 6 575 9 066 9 861 Russia 5 4 4 4 2 2 6 12 7 Serbia 91 91 160 225 287 215 175 273 293 Slovakia 21 59 42 13 53 129 100 131 106 Slovenia 3 791 4 368 5 764 6 336 8 345 8 981 9 780 8 255 7 581 Spain 652 943 1 124 1 061 1 253 1 319 1 319 1 434 1 400 Sweden 2 004 2 116 2 191 2 351 2 329 2 622 2 888 3 036 3 414 Switzerland 116 222 226 451 499 672 756 1 493 1 470 Turkey Ukraine 7 493 5 450 5 758 7 940 7 733 7 562 6 342 6 387 6 652 United Kingdom 6 042 United States
Table A3. Investment in inland waterway infrastructure, million Euros, current prices and exchange rates Country 1995 1996 1997 1998 1999 2000 2001 2002 Albania 0 0 0 0 Armenia Australia X X X X X X X X Austria 3 0 0 0 0 0 0 1 Azerbaijan Belarus Belgium 151 125 181 129 139 152 153 153 Bosnia Bulgaria 463 Canada 5 5 7 6 Croatia 1 1 2 2 2 Czech Republic 1 0 2 6 3 11 9 17 Denmark X X X X X X X X Estonia X X X X X X X X Finland 2 2 1 0 1 0 3 4 France 107 59 69 85 104 114 114 115 FYROM X X X X X X X X Georgia X X X X X X X X Germany 711 757 741 828 849 828 844 810 Greece X X X X X X X X Hungary 1 1 0 0 0 0 7 6 Iceland X X X X X X X X India Ireland X X X X X X X X Italy 10 9 9 22 11 30 26 16 Japan X X X X X X X X Korea X X X X X X X X Latvia X X X X X X X X Liechtenstein X X X X X X X X Lithuania 1 0 0 0 0 0 0 0 Luxembourg 0 0 3 1 0 1 1 2 Malta X X X X X X X X Mexico X X X X X X X X Moldova Montenegro X Netherlands 203 261 319 402 379 512 New Zealand X X X X X X X X Norway X X X X X X X X Poland 10 X X X X X X X Portugal 1 6 9 1 0 1 1 9 Romania 244 150 110 107 96 105 169 104 Russia 73 66 87 62 28 48 91 62 Serbia 12 14 15 12 4 5 6 14 Slovakia 21 19 19 10 3 1 1 1 Slovenia X X X X X X X X Spain X X X X X X X X Sweden X X X X X X X X Switzerland 8 7 39 39 17 17 0 4 Turkey X X X X X X X X Ukraine United Kingdom United States 1 176 1 329 1 475 1 691 1 926 4 427 4 088 3 893
Table A3. Investment in inland waterway infrastructure, Million Euros, current prices and exchange rates (cont.) 2003 2004 2005 2006 2007 2008 2009 2010 2011 Country 0 0 0 0 0 0 0 0 0 Albania Armenia X X X X X X X X X Australia 3 12 7 7 4 3 5 11 8 Austria Azerbaijan Belarus 153 153 156 162 178 188 188 Belgium Bosnia 38 26 85 197 405 0 0 0 0 Bulgaria Canada 2 3 2 1 2 2 4 3 3 Croatia 12 12 10 19 14 22 59 58 22 Czech Republic X X X X X X X X X Denmark X X X X X X X X X Estonia 2 4 1 2 5 2 2 2 1 Finland 132 109 108 162 168 141 182 188 197 France X X X X X X X X X FYROM X X X X X X X X X Georgia 825 790 790 800 820 905 1 180 1 100 1 040 Germany X X X X X X X X X Greece 7 1 2 4 4 0 3 1 Hungary X X X X X X X X X Iceland India X X X X X X X X X Ireland 35 51 53 56 29 34 27 42 Italy X X X X X X X X X Japan X X X X X X X X X Korea X X X X X X X X X Latvia X X X X X X X X X Liechtenstein 0 0 0 2 3 4 1 1 2 Lithuania 1 1 0 1 0 0 0 1 1 Luxembourg X X X X X X X X X Malta X X X X X X X X X Mexico Moldova X X X X X X X X X Montenegro 479 486 284 312 263 270 361 252 263 Netherlands X X X X X X X X X New Zealand X X X X X X X X X Norway X 14 7 7 13 21 25 25 29 Poland 6 8 20 13 10 7 5 1 1 Portugal 164 191 140 213 359 490 536 423 519 Romania 87 140 73 51 58 102 59 68 301 Russia 12 19 15 30 24 36 19 21 26 Serbia 1 1 1 1 0 1 2 3 1 Slovakia X X X X X X X X X Slovenia X X X X X X X X X Spain X X X X X X X X X Sweden 0 1 0 0 0 0 0 0 0 Switzerland X X X X X X X X X Turkey Ukraine United Kingdom 2 349 United States