R E S E A R C H
Open Access
Integrated cost-benefit analysis of tsetse
control and herd productivity to inform
control programs for animal African
trypanosomiasis
Anne Meyer
1†, Hannah R. Holt
1*†, Farikou Oumarou
2, Kalinga Chilongo
3, William Gilbert
1, Albane Fauron
1,
Chisoni Mumba
4and Javier Guitian
1Abstract
Background:Animal African trypanosomiasis (AAT) and its tsetse vector are responsible for annual losses estimated in billions of US dollars ($). Recent years have seen the implementation of a series of multinational interventions. However, actors of AAT control face complex resource allocation decisions due to the geographical range of AAT, diversity of ecological and livestock systems, and range of control methods available.
Methods:The study presented here integrates an existing tsetse abundance model with a bio-economic herd
model that captures local production characteristics as well as heterogeneities in AAT incidence and breed. These models were used to predict the impact of tsetse elimination on the net value of cattle production in the districts of Mambwe, in Zambia, and Faro et Déo in Cameroon. The net value of cattle production under the current situation was used as a baseline, and compared with alternative publicly funded control programmes. In Zambia, the current baseline is AAT control implemented privately by cattle owners (Scenario Z0). In Cameroon, the baseline (Scenario C0) is a small-scale publicly funded tsetse control programme and privately funded control at farm level. The model was run for 10 years, using a discount rate of 5%.
Results:Compared to Scenario C0, benefit-cost ratios (BCR) of 4.5 (4.4–4.7) for Scenario C1 (tsetse suppression using insecticide treatment of cattle (ITC) and traps + maintenance with ITC barrier), and 3.8 (3.6–4.0) for Scenario C2 (tsetse suppression using ITC and traps + maintenance with barrier of targets), were estimated in Cameroon. For Zambia, the benefit-cost ratio calculated for Scenarios Z1 (targets, ITC barrier), Z2 (targets, barrier traps), Z3 (aerial spraying, ITC barrier), and Z4 (aerial spraying, barrier traps) were 2.3 (1.8 - 2.7), 2.0 (1.6-2.4), 2.8 (2.3–3.3) and 2.5 (2.0–2.9), respectively. Sensitivity analysis showed that the profitability of the projects is relatively resistant to variations in the costs of the interventions and their technical efficiency.
Conclusions:It is envisioned that the methodologies presented here will be useful for the evaluation and design of existing and future control programmes, ensuring they have tangible benefits in the communities they are targeting.
Keywords:Trypanosomiasis, Sub-Saharan Africa, Cameroon, Zambia, Cost-benefit analysis, Vector control, Tsetse, Cattle, Bio-economic model
* Correspondence:[email protected] †Equal contributors
1Department of Pathobiology and Population Sciences, Royal Veterinary
College, Hatfield, UK
Full list of author information is available at the end of the article
Background
According to 2013 estimates, half of the world’s poor live in sub-Saharan Africa (World Bank, 2017) and 63% of them are located in rural areas. Ensuring food security in rural areas of sub-Saharan Africa is an important challenge, and sustainable development of agriculture is recognised as a key strategy for poverty reduction [1]. Animal African trypanosomiasis (AAT) is a devastating livestock disease, responsible for total annual losses esti-mated in the billions of dollars (US$) in sub-Saharan Africa [2, 3]. The disease is caused by a parasite proto-zoan of the genusTrypanosoma; its primary vector, tse-tse flies (Glossinaspp.), infests around 10 million km2of sub-Saharan Africa [4]. AAT affects the health and prod-uctivity of livestock to the extent that it influences where people settle, as well as the intensity and diversity of both crop and livestock industries [5]. The impact of AAT itself can be reduced by curative and prophylactic trypanocide applications and the breeding of trypanoto-lerant cattle. However, there is increasing resistance to trypanocides [6, 7] and farmers are often reluctant to use trypanotolerant breeds [8]. Vaccines are unavailable, and reduction of transmission relies on the control of the tsetse vectors by insecticide treatment of cattle (ITC), the use of traps or insecticide-treated targets (ITT), ground or aerial insecticide spraying, and redu-cing the risk of exposure to the vector through changes in livestock management. In addition to AAT, vector control plays a major role in combatting Rhodesian human African trypanosomiasis (HAT) [9], for which cattle are an important reservoir [10], and contributes to global efforts against Gambian HAT (caused byT. brucei gambiense) [11]. The most appropriate tools for control and the scale at which to implement them depend on the socio-economic and political context, physical envir-onment, the eco-epidemiological cycle of AAT, tsetse demographics and available resources [12].
Over the last 15 years, the Pan African Tsetse and Trypanosomiasis Eradication Campaign (PATTEC), estab-lished by the African Union, has supported a series of multinational interventions to control AAT and HAT in partnership with national governments [13]. Within this campaign, the African Development Bank has directed 72 million US$ in loans and grants to support the creation of tsetse-free areas in sub-Saharan African countries [13]. Despite this revitalised atmosphere of international co-operation and opportunity, decisions over the allocation of limited resources are still difficult, due to the enormous geographical range of the disease, the diversity of eco-logical and livestock systems within that range, and the variety of disease and vector control methods available. Hence, there is a need for transparent frameworks and tools for priority setting and resource allocation for future AAT control programmes [14, 15]. Predictions of the
efficiency of resource allocation under different control scenarios using techniques such as cost-benefit analyses would be highly valuable in the planning of future pro-grammes. For instance, selected macro-level economic evaluations provide important information for area priori-tisation and the planning of AAT control programmes at regional level [16–18]. However, a disadvantage of such approaches is that aggregated indicators may overlook important heterogeneities at a small scale. Although area-wide tsetse elimination approaches have been advocated for over a decade [19–21], they require intensive planning, coordination and funding. Fifteen years after the launch of the PATTEC campaign, elimination activities are re-stricted to limited areas (Deme Valley in Ethiopia and Niayes area in Senegal), and in the absence of renewed funding opportunities, future large-scale elimination cam-paigns are uncertain. Local government services still play an important role in AAT control [22], but they are con-strained by limited funds, infrastructure and human re-sources. A model that aids understanding of disease dynamics at a local level is therefore needed, to ensure choices of operational areas and control tools to maximise returns on investments.
Adapting previous work by Shaw et al. [12, 18, 23], this study proposes a framework for conducting a cost-benefit analysis of possible AAT control interventions in an administrative area, capturing within-population het-erogeneities in term of disease incidence and livestock productivity. In this paper, we focus on AAT in cattle only. For illustration, we applied the framework to the Faro et Déo district of Cameroon and the Mambwe Dis-trict of Zambia. Livestock owners in these areas rely heavily on chemotherapy and chemoprophylaxis, but with increasing levels of trypanocide resistance being reported [6,24], both districts have been proposed as potential tar-gets for coordinated tsetse and trypanosomiasis (T&T) control in their respective countries.
Methods
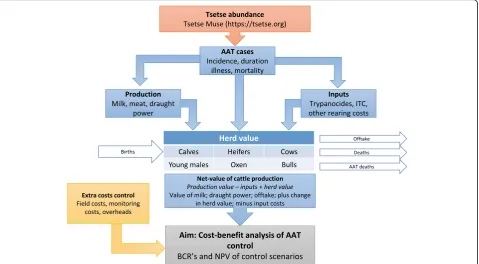
Conceptual framework for cost-benefit analysis
calving rate as well as reduced mortality. A reduction in the incidence of disease resulted in costs saved due to reduced preventative and therapeutic action taken by farmers; in addition, the extra value of a larger herd under the AAT control scenarios was calculated [12,26]. Extra costs (costs of implementing the control interven-tions) and revenue foregone (revenue lost under AAT control, i.e. reduction in salvage slaughter) as a result of the interventions were also compared to the baseline scenarios. Possible external factors such as changes in crop output, changes in pressure on natural resources and changes to herd management were not included. The total costs and benefits were estimated on an annual basis and totalled for each Scenario over a 10-year period using a discount rate of 5%. The economic per-formance indicators net present value (NPV) and the benefit-cost ratio (BCR) were then calculated.
Study areas and scenarios considered
Cameroon case study
The Faro et Déo District of Cameroon is part of the most important cattle-producing region in the country (Adamaoua Region), supplying both local and inter-national markets [27]. Glossina morsitans submorsitans,
Glossina fuscipes fuscipesandGlossina tachinoidesare the main tsetse species present. Despite a long history of
tsetse control in the district [28], a cross-sectional study in 2010 estimated an overall AAT prevalence of up to 40.7%, thus still representing a significant threat to cattle production [29]. Currently, the district is divided into three zones: namely, the plateau, where tsetse popula-tions have been suppressed, the buffer zone, used as a bar-rier to tsetse invasion from the valley to the plateau, and the tsetse-infested valley [27]. The current T&T control activities in place in the district (“Scenario C0”) include the regular use of trypanocides by farmers and small-scale control activities ran by the Mission Spéciale d’Eradication des Glossines (MSEG), which is part of the Department of Veterinary Services. The MSEG maintains a limited num-ber of traps and targets, primarily in the buffer zone and carries out intermittent ground spraying. This is supple-mented with some prophylactic trypanocide treatment and ITC for transhumant cattle moving between the tsetse-infested valley and the tsetse-free plateau. To in-form the allocation of future funding, two alternative sce-narios modelled the expansion of the current control activities into the infested zone (Scenarios C1 and C2). As the tsetse population is not isolated, a barrier would be re-quired to prevent reinvasion from the Faro Game Park in the North and the Nigerian Gashaga Forest Reserve in the West. Scenarios C1 and C2 differed by the implementa-tion of a barrier using ITC and ITT, respectively.
[image:3.595.60.540.89.353.2]Zambia case study
The Mambwe District is part of the Luangwa Valley in the Eastern Province of Zambia, which has very high tsetse densities due to favourable vegetation and climate as well as an abundance of wildlife hosts [30]. Around three-quarters of this district is infested by tsetse, with
Glossina morsitans morsitans being the main species
present [31] and Glossina pallidipes also of epidemio-logical importance. The third species in the area,
Glossina brevipalpis,is considered insignificant as a vec-tor. The current baseline situation (“Scenario Z0”) con-sists of T&T control implemented by cattle owners only, who use a combination of insecticides and prophylactic and curative trypanocides. A study in a neighbouring district (Katete) revealed that 99% of the trypanocides were purchased indirectly from veterinary camps and district veterinary offices [32]. Four alternative local tsetse elimination campaigns under consideration for implementation by the Tsetse and Trypanosomiasis Control Unit (TTCU) of the Department of Veterinary Services were modelled for this district: two based on ITT (Scenarios Z1 and Z2) and two based on sequential aerial spraying (SAT) (Scenarios Z3 and Z4). As the current cattle density in Mambwe is low (2.4 head per km2), the use of ITC was not considered as an appropri-ate option for these settings. However, it might be used as a barrier, based on our model of cattle demographics. Therefore, implementation of a barrier to prevent tsetse reinvasion from the neighbouring South Luangwa National Park was accounted for, using ITC (Scenarios Z1 and Z3) and ITT (Scenarios Z2 and Z4), respectively.
Implementing the control scenarios
Costs included in the different scenarios
The costs of implementing the control interventions were divided between administrative overheads, field costs and monitoring costs. The latter costs included ini-tial entomological and parasitological surveys as well as subsequent T&T monitoring activities, all of which var-ied in relation to the level of the control activity. Budgets from the current control programme ran by the MSEG in Cameroon were consulted to obtain the costs of the current control programme (Scenario C0). To estimate the costs incurred by scenarios C1 and C2, current costs were extrapolated to the level of activity required to achieve tsetse elimination in the area. The control costs for the Mambwe District were inferred from the budget of previous control activities conducted by the TTCU in the Western Province of Zambia and complemented with data from the literature where necessary [23]. The detailed costs used in the calculations are available as supplementary material (Additional file 1: Table S1). In our simulation, ITC was applied at a density of four adult cattle per km2, as previous work predicted that
local elimination would be achieved when applied at this density [33]. Although cattle density was lower than this cut-off in Mambwe at the start of the control programme, this is likely to increase once tsetse is suppressed in the district. The use of insecticide-impregnated, odour-baited targets was planned during the attack phase of Scenarios C1, C2, Z1 and Z2. This type of artificial baits has been used effectively in the past to eliminate savannah species of tsetse, for instance in Zambia and Zimbabwe [34]. The density of targets effectively used to eliminate savannah tsetse ranged from three to five per km2in previous trials [35–38]. A density of four targets per km2was chosen in this study. Scenarios Z3 and Z4 were based on the use of five cycles of SAT, as successfully used in neighbouring Botswana [39]. The barrier sizes were set as 8 km wide by 240 km long, and 8 km wide by 85 km long, in Faro et Déo and Mambwe, respectively, as recommended by pre-vious work [35].
Simulating control scenarios
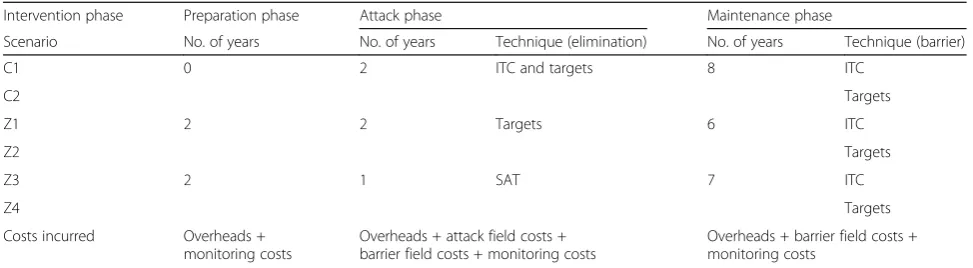
The interventions were split into three phases: (i) preparation phase when T&T surveys and awareness campaigns are conducted, and staff is recruited and trained; (ii) attack phase, when the interventions to eliminate the tsetse population in the area are de-ployed; and (iii) maintenance phase, when the barriers are maintained to prevent re-invasion from the adja-cent areas. As a dedicated T&T unit already operates in the Faro et Déo District, conducting entomological surveys and engaging with farmers, no preparatory phase was considered for this study area. The publicly available Tsetse Muse model (http://www.tsetse.org/ muse [36]) was used to predict the likely reduction in tsetse density under each scenario. Based on tsetse surveys on the Adamaoua plateau, a non-isolated starting population of 2500 females per km2 and 80 males per 100 females was simulated [37]. Birth, deaths, age structure and kill rates were set to recom-mended values [36]. The control techniques planned for each scenario and described above were used as inputs to run the tsetse abundance model. The time to eliminate tsetse predicted by the Tsetse Muse sim-ulations was used to define the duration of the differ-ent scenario phases, allowing for additional time to accommodate potential delays and logistical issues. The duration of each phase in the different scenarios and the timing of the different control costs are shown in Table 1. Barriers would be set-up at the be-ginning of the attack phase, as this proved successful in a similar campaign in Botswana [39].
Estimating AAT incidence under the control scenarios
population at risk, varied according to the stage in the control programme and the zone within the study area where the control program is implemented. Three zones were considered in the Faro et Déo District based on different risks of AAT [27]. Estimates of the current annual incidence in the different zones of Faro et Déo were extracted from a year-long study conducted in sedentary herds in 2004 [6]. For transhumant herds, these data were combined with a prevalence study con-ducted in the valley between October and December 2005, which is when transhumant cattle enter the valley [38]. Over 1-year, the mean cumulative incidence values for sedentary herds on the plateau, sedentary herds in the valley and transhumant herds were 6.5, 53 and 22.6%, respectively. In Faro et Déo, 90% of the herds in the district were considered transhumant in the dry season, when the tsetse burden is at its lowest, while 10% were sedentary: of these, 2.5% resided in the valley, and 7.5% resided in the plateau (MSEG data). In the case of Zambia, the AAT incidence was considered to be homogenous in the infested area of the Mambwe District, which represents 80% of the total surface of the district (TTCU). During a longitudinal study in the Eastern Province of Zambia, 155 new infections were detected in 85 sentinel cattle over a period of 19 months [40]. The monthly incidence of AAT in cattle was esti-mated at 6 and 10% in two studies in the area [32, 40]. It was assumed therefore that the current annual incidence of AAT in Mambwe District ranged between 72 and 100%.
Based on AAT incidence surveys conducted in areas where tsetse had been eliminated, we considered that post-elimination AAT annual incidence in the different scenarios would lie between 1% and 5% [15,28,41–43]. Under the baseline scenarios (C0 and Z0), we considered that the current annual incidence of AAT in each district would remain stable. Under the control scenarios (C1 and C2, Z1 to Z4), we considered that the current AAT incidence would decrease proportionally with the de-crease in tsetse density predicted by the vector
abundance model, to reach the post-elimination value at the end of the attack phase.
Bio-economic herd model
An animal-level herd model was developed to simulate the demographic, production and disease events within the cattle herd in the study area on an annual basis. The model included six age-sex cattle classes (calf, heifer, young male, cow, adult ox and adult bull) and accounted for the use of two different breeds of cattle in the study area. Recent surveys showed that one and two breeds of cattle are kept in the Mambwe and Faro et Déo districts, respectively [44, 45]. The model incorporated the differ-ent breeds of cattle and heterogeneities in AAT risk within the Faro et Déo study area. Annual rates of mor-tality and offtake were calculated for the different age-sex classes to develop annual projections of herd growth. Unlike previous models, this model was stochastic to in-corporate variability in cattle type and productivity, and uncertainty and variability surrounding estimates of AAT frequency and impact.
Model parameters
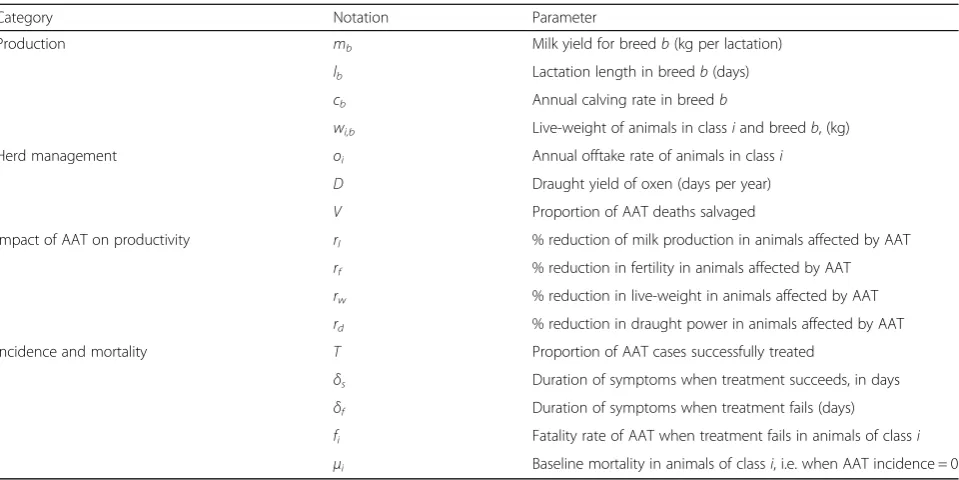
[image:5.595.55.542.98.232.2]A comprehensive literature review was conducted to identify all of the relevant parameters for the cattle sys-tem and select appropriate values. Relevant observa-tional, experimental infection and field studies of AAT, entomological surveys and studies of productivity of cat-tle were used to parametrize the model. Also, data from official sources (MSEG and TTCU) and a field study comprising interviews of cattle owners in the area were utilised appropriately [44, 45]. The main parameters used in the model are presented in Table 2. A full description of the parameter values used within the two case studies along with their source is provided in Additional file 1: market prices for inputs and outputs (Additional file1: Tables S1 and S2), production parame-ters (Additional file 1: Table S3), herd management pa-rameters (Additional file 1: Table S4), and AAT-related parameters (Additional file1: Tables S5 and S6).
Table 1Timing of the different T&T control scenarios in relation to the additional costs
Intervention phase Preparation phase Attack phase Maintenance phase
Scenario No. of years No. of years Technique (elimination) No. of years Technique (barrier)
C1 0 2 ITC and targets 8 ITC
C2 Targets
Z1 2 2 Targets 6 ITC
Z2 Targets
Z3 2 1 SAT 7 ITC
Z4 Targets
Costs incurred Overheads + monitoring costs
Overheads + attack field costs + barrier field costs + monitoring costs
Overheads + barrier field costs + monitoring costs
Model analysis
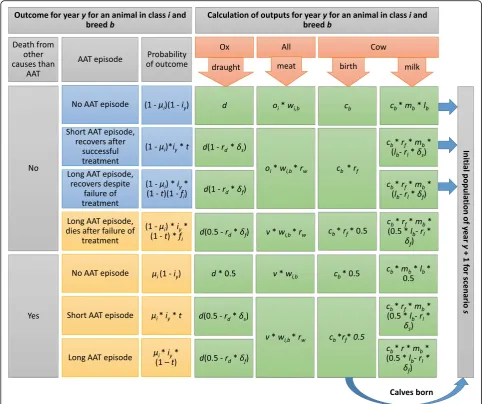
Census data obtained from the MSEG and the TTCU was used to define the initial herd structure (Additional file 1: Table S7). For each yearY of the simulation of a ScenarioS, distributions of annual incidence determined the probability that each animal experienced an AAT event. Infection sequelae regarding the duration of ill-ness and mortality were established for each affected animal to calculate the impact of AAT on its production during year y (Fig. 2). The total value of the herd pro-duction PY,S was calculated as the sum of the market
values of the milk production, meat production and draught output of each animal. It was assumed that oxen and cows which died would do so halfway through their annual production cycle and that animals bred for meat production would die before they were slaughtered and have salvage value only (see Additional file 1: Table S8 for a full list of assumptions). The total value of the production inputs IY,Swas calculated as the sum of the
market values of the inputs related to AAT control (pre-ventive trypanocides, curative trypanocides and insecti-cides) and the other inputs (non-AAT related rearing costs). Each animal with an AAT episode that year incurred one additional trypanocide dose. It was also assumed that farmers would cease the use of trypanocide prophylaxis and ITC once AAT was suppressed. Extra revenue was calculated as the total discounted value of cattle productionPY,0under the baseline Scenarios (C0,
Z0) for yearYsubtracted from the total discounted value of cattle production PY,S under each control Scenario
(C1 and 2, Z1 to Z4) for the same yearY. The difference
between the total herd value under the baseline and con-trol Scenarios was calculated at the end of the 10-year projection period (H10,S - H10,0). The reduction in the
total value of salvaged meat and the rearing costs of the additional cattle were incorporated in the additional costs. We assumed that all cattle products could be mar-keted and prices would remain inelastic under the differ-ent control Scenarios.
Model environment
The herd model was developed in R version 3.3.0 [46] using the packages mc2d, psychometric and msm. The additional costs linked to the control interventions were calculated in an Excel spreadsheet, using the cattle population size estimated in the herd model. Local prices were converted to US$ using average conversion rates from the year the data was collected (https:// www.oanda.com/currency/average) and adjusted for the inflation rate accrued between the year the data was col-lected and the reference year of this study (2016) as de-scribed in Shaw et al. [25]. Annual rates of mortality and offtake were calculated for the different age-sex classes to develop annual projections of herd growth, and the model was run for 1000 iterations. The cost calculation was conducted in a deterministic manner.
Sensitivity analysis
[image:6.595.59.539.108.348.2]Sensitivity analysis was used to examine the effect on the projects’ profitability of different variations from the initial study assumptions, reflecting potential de-partures from the processes and outcomes of the
Table 2Main parameters used in the bio-economic herd model. The indices i and b refer to the age-sex cattle class (calf, heifer, young male, cow, adult bull and adult ox) and breed respectively
Category Notation Parameter
Production mb Milk yield for breedb(kg per lactation)
lb Lactation length in breedb(days)
cb Annual calving rate in breedb
wi,b Live-weight of animals in classiand breedb, (kg)
Herd management oi Annual offtake rate of animals in classi
D Draught yield of oxen (days per year)
V Proportion of AAT deaths salvaged
Impact of AAT on productivity rl % reduction of milk production in animals affected by AAT rf % reduction in fertility in animals affected by AAT rw % reduction in live-weight in animals affected by AAT rd % reduction in draught power in animals affected by AAT
Incidence and mortality T Proportion of AAT cases successfully treated
δs Duration of symptoms when treatment succeeds, in days
δf Duration of symptoms when treatment fails (days)
interventions. An increase in intervention costs (by 25% and 50%, respectively) a reduction in the technical inter-vention efficiency (final AAT incidence of 10%) and a reduction in the price of commodities due to an increase in supply was simulated. Estimates of the relative reduc-tions in the prices of a commodity which might occur due to an increased supply and reductions in inputs were calculated on an annual basis using data from Kristjanson et al. [17]. The revenue obtained from milk, meat and draft in each scenario were then adjusted for purposes of sensitivity analysis.
Results
Net value of cattle production in the study areas
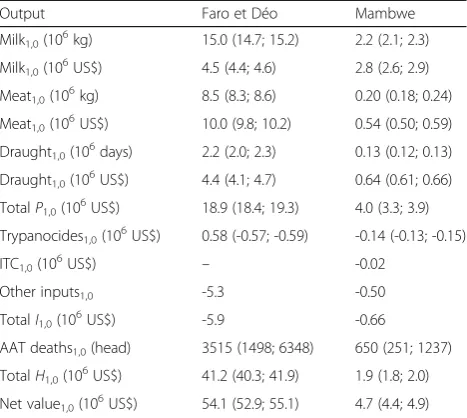
The annual net value of cattle under the baseline Scenarios was estimated to be 54.1 and 4.7 million
US$ or 322 and 433 US$ per head in the Faro et Déo and Mambwe districts, respectively (Table3). The major-ity of production revenue was estimated to derive from meat production in Faro et Déo, and milk production in Mambwe. Annual total spending on AAT control by farmers was estimated at 578,670 US$ (3.4 US$ per head) in Faro et Déo and 162,910 US$ (15 US$ per head) in Mambwe under the current control practices and AAT in-cidence. The majority of this was due to the purchase of preventative trypanocides. The cost of AAT-related inputs incurred per head of cattle was higher in Mambwe, due to the purchase of more trypanocides and the use of ITC, which is provided by the MSEG in Faro et Déo. Under the current AAT incidence levels, around 2% and 6% of the total herd were lost to AAT annually in Faro et Déo and Mambwe, respectively.
Fig. 2Infection outcomes and associated production outputs considered in the cost-benefit analysis, calculated at animal-level a given breed (b)
[image:7.595.56.541.88.492.2]Costs of the control programmes
The total control costs for Scenarios C1 and C2 were estimated at 1184 and 1768 US$ per km2 of infested area, respectively, using a discount rate of 5% (Table 4). The control costs for the Mambwe District ranged from 735 to 960 US$ per km2 of the infested area for the different Scenarios. The total control costs for Faro et Déo were higher as only a third of the district is infested and this includes some activities in the cleared plateau (such as monitoring).
Results of the cost-benefit analysis
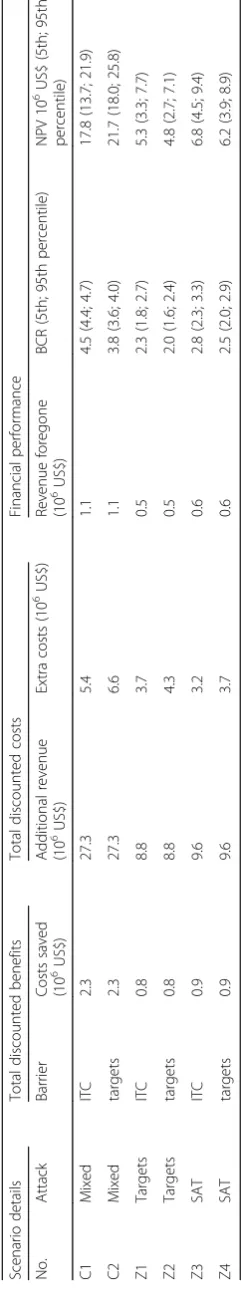
The benefit-cost ratios calculated for the different scenarios ranged between 2.0–4.5 (Table 5). The use of SAT in Mambwe as an elimination method yielded a higher BCR than the use of targets. The total discounted
control costs and benefits for the 10-year period were estimated at 3.8 and 10.5 million US$ for Scenario Z3, respectively, which was the most cost-beneficial scenario for this study area. Total discounted costs and benefits were 6.5 and 29.6 million US$ for Scenario C1, which was the most profitable. The Zambian scenarios yielded NPVs between 4.8 and 6.8 million US$.
Sensitivity analysis
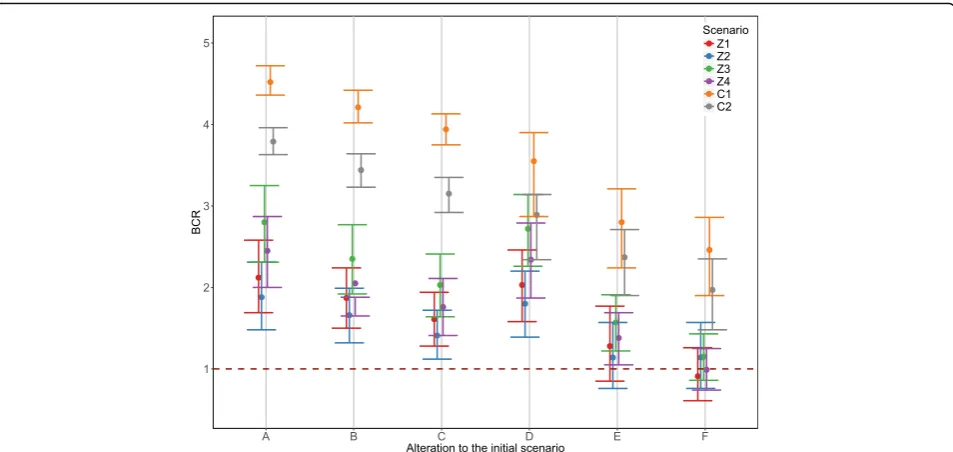
In response to increased commodities and the absence of any extreme market events, it was estimated that the annual price of meat, milk and draft in Cameroon could be reduced by up to 4.0%, 46.3% and 16.9% over the 10-year simulation period. In Zambia, estimates commodity prices were estimated to decrease by up to 42.6%, 73.3% and 48.1% for meat, milk and draft, respectively. This was simulated in Scenario E of the sensitivity analysis and remained profitable, with BCRs all higher than one. All other scenarios remained profitable (Fig. 3), except for Scenarios Z1 and Z4, when Scenario E was combined with a 50% increase in intervention costs. Overall, these results suggest the economic justification of control pro-grammes is fairly robust and slight deviations from the planned processes or our model assumptions and out-comes regarding cost increases, or lower efficiency, are unlikely to significantly affect the profitability of the con-trol programme.
Discussion
[image:8.595.57.291.121.330.2]AAT is deemed to be one of the main constraints to agricultural development in affected areas of sub-Saharan Africa [47] and has received increasing atten-tion from internaatten-tional organisaatten-tions and funding agen-cies in recent years. The proposed framework integrates an established decision support tool, aimed at optimising resource allocation regarding tsetse population manage-ment, with a detailed analysis of cattle productivity under different AAT control scenarios. Integration of
Table 3Total net value of the cattle production (median, 5th and 95th percentiles) in the study areas for year 1 under the current AAT incidence (s = 0)
Output Faro et Déo Mambwe
Milk1,0(106kg) 15.0 (14.7; 15.2) 2.2 (2.1; 2.3)
Milk1,0(106US$) 4.5 (4.4; 4.6) 2.8 (2.6; 2.9)
Meat1,0(106kg) 8.5 (8.3; 8.6) 0.20 (0.18; 0.24)
Meat1,0(106US$) 10.0 (9.8; 10.2) 0.54 (0.50; 0.59)
Draught1,0(106days) 2.2 (2.0; 2.3) 0.13 (0.12; 0.13)
Draught1,0(106US$) 4.4 (4.1; 4.7) 0.64 (0.61; 0.66)
TotalP1,0(106US$) 18.9 (18.4; 19.3) 4.0 (3.3; 3.9)
Trypanocides1,0(106US$) 0.58 (-0.57; -0.59) -0.14 (-0.13; -0.15)
ITC1,0(106US$) – -0.02
Other inputs1,0 -5.3 -0.50
TotalI1,0(106US$) -5.9 -0.66
AAT deaths1,0(head) 3515 (1498; 6348) 650 (251; 1237)
TotalH1,0(106US$) 41.2 (40.3; 41.9) 1.9 (1.8; 2.0)
Net value1,0(106US$) 54.1 (52.9; 55.1) 4.7 (4.4; 4.9)
Table 4Detailed control costs incurred in Faro et Déo and Mambwe districts over the 10-year projection period, in USD per km2 infested except otherwise indicated
Study areas Faro et Déo Mambwe
Field costs SAT na 506
ITC (excl. barrier) 151 na
Targets (excl. barrier) 365 448
ITC (for barrier) (US$ per km2barrier) 618 735
Targets (for barrier) (US$ per km2barrier) 1559 1792
Monitoring costs (US$ per km2district) 87 80
Administrative overheads 196 166
Scenarios C0 C1 C2 Z1 Z2 Z3 Z4
Total discounted control costs (per km2infested)a 680 1184 1768 735 898 799 960
a
For Faro et Déo the total discounted control costs do not include the costs carried over from the baseline control programme
[image:8.595.56.539.575.715.2]these methods enables better-informed decisions regard-ing the pairregard-ing of priority tsetse-infested areas with a combination of control methods. The techniques are demonstrated in two example areas where the control effort depends on scarce national resources.
This study produced BCRs for AAT control interven-tions ranging between 2.0 and 4.6, indicating local tsetse elimination would be cost-beneficial in both settings. As farmers are currently paying for a large amount of trypa-nocide and insecticide doses, tsetse elimination would significantly reduce these costs and may slow down the development of trypanocide resistance in both study areas (a benefit not accounted for in this study). It is difficult to compare these results between settings due to the wide range of tsetse control methods which can be utilised, the varying impact that AAT can have on a community, the lack of economic analyses of AAT control programmes and the methodological variability of the existing ones [15]. They are within the range of values estimated by other authors; however, for example, a study in Senegal produced BCRs ranging between 0.98 and 4.26 [48]. In year 10, the estimated value of the pro-duction (milk, meat and draught power as well as herd value) was around 20% higher than the baseline in all scenarios. A herd model parametrized with data from Burkina Faso estimated that, compared to the reference herd, the monetary output from cattle production might increase by 12% to 74%, according to the different scenarios and the intensity of the production losses at-tributable to the AAT challenge [49]. This suggests that our assumptions are rather conservative; however, a
large proportion of the production increase arises as a result of increasing herd size rather than increasing productivity, especially in Mambwe. Both study areas are situated on the wildlife-livestock interface, and livestock expansion is likely to be challenging in this regard due to competition for resources and space and lack of infra-structure [50,51].
Net-present values for the study area in Cameroon were around 22 million US$, generating an additional 2000 US$ per km2. In Zambia, control of AAT was esti-mated to generate an additional 1061 to 1503 US$ per km2. In a previous survey of cattle-owning households across 17 study areas in five AAT-affected countries, communities in this region of Cameroon were con-cluded to have the highest vulnerability to AAT [14]. This was due to the high importance of cattle in this set-ting, a production system that includes large trypanosen-sitive transhumant herds, the reportedly high occurrence of treatment failure, constant AAT challenge and a lack of tsetse control in some areas [14]. This may explain the slightly higher profitability for Cameroon despite a much lower annual incidence, especially considering that cattle density in the area is 15.2 cattle/km2, which is closer to average cattle densities in tsetse-free sub-Saharan African regions [17]. Work by Shaw et al. [25] showed that the benefits of different control options are heavily influenced by cattle densities. Intervention costs in both study areas were comparable with other esti-mates [17, 23,25, 33, 52]. The proportion of field costs to total costs in the two case studies varied between 67% and 89% according to the scenario considered. Other
Fig. 3Benefit-cost ratios of the control scenarios under different perturbations to the initial parameters (median, 5th and 95th percentiles). Details
[image:10.595.60.537.87.313.2]studies estimated the proportion of the field costs to be around 60% to 65% for similar techniques and an elimination campaign using the sterile insect technique [23,48]; the lower proportion of field costs in the latter is likely related to the high overheads associated with the sterile insect technique.
The outputs from Tsetse Muse suggested that the techniques used in the attack phase of the different scenarios could eliminate tsetse in the study areas. However, successful examples of this are usually in isolated populations, and such populations are rare [15]. Indeed, previous control campaigns in Cameroon reportedly cleared areas of tsetse in the region, which however subsequently suffered from re-invasion or resurgence followed the cessation of control activities [27]. Previous elimination campaigns against savannah tsetse species using similar techniques were successful, for example in the Kwando-Zambezi tsetse belt encompassing the Western Province of Zambia and neighbouring countries, in Botswana and Zimbabwe [39,53]. In this study, barriers would need to be maintained, and monitoring activ-ities conducted continuously unless sequential elimination of the entire tsetse belt was achieved.
Cost-benefit studies should be supported by recent es-timates of key parameters such as frequency of trypano-some infection and impact (e.g. duration of morbidity, mortality), livestock and tsetse demographics. Where available, this work used data collected from the specific study areas; however, there were key-data gaps. For example, the impact that AAT has on production parameters (milk, fertility, draught and meat yield) was extracted from literature reporting data collected in other settings and may vary according to factors such as breed, management system and trypanosome species present. A comprehensive review of the impacts was conducted, and this uncertainty was accounted for and incorporated in distributions. The initial mortality was high as the model assumed a high proportion of treat-ment failures. This was triangulated using several sources including interviews of farmers obtained from previous studies in the area, a previous study of resist-ance of trypanosome isolates and investigator experience in the area [6, 44, 45]. The mortality rate used in the model was extrapolated from an experimental field study of untreated zebu cattle in Kenya [54] but it is unlikely to give an accurate representation of field conditions in our study areas. However, this study was chosen as this breed (Orma Boran) exhibits some trypanotolerance, un-like breeds used in most experimental infection studies. Although Fulani, Gudali and Angoni breeds are consid-ered trypanosensitive, it was assumed that many cattle were previously exposed to the disease (due to the high incidence in the study areas) and therefore they were not immunologically naïve [55,56]. This is supported by
interviews of cattle farmers in the study areas; less than 50% of farmers attributed cattle deaths in their herd to AAT in the previous 2 years, despite reporting AAT as a constant challenge, which is in agreement with the field experience of the investigators [44, 45]. Data on annual incidence rates were extracted from studies conducted several years ago and may not represent current levels. While this represents a limitation to this model, local ex-perts suggested that the incidence rates are still high in both districts. Also, a recent study conducted in the Dis-trict of Mayo Rey, close to the Faro et Déo disDis-trict, esti-mated a prevalence of trypanosome infection in cattle of over 50% [57]. Although control activities have not reached the district of Mayo Rey, this suggests a high burden in this area of Cameroon; thus, the estimate that around 16% of transhumant cattle (entering the infested zone) are affected in a given year is reasonable. When studying the profitability of potential control projects, the benefits of eliminating tsetse increase over time, as the cattle population develops while the costs of main-taining barriers remain stable. Therefore, it is important to consider the long-term impact of these projects. However, the validity of model assumptions, such as in-elasticity of market prices may be questionable over time. The choice of a 10-year projection is a reasonable compromise between these two constraints.
the patchy distribution of cattle in some seasons. As the cattle density in Mambwe is around 2.4 cattle per km2 at present, an ITC barrier is unlikely to prevent reinvasion into the Mambwe District effectively. Hence, Scenarios Z1 and Z3 are not applicable at present but might be feasible in the future as cattle farming is a growing activity in the district. Economic analysis should be used as one of a range of tools, and the feasibility of planned interventions given current resources, infrastructure, technical expertise and the environmental and socio-political context should be considered [63, 64].
This study complements other research in the area of AAT control, aiming at informing optimal resource allocation and priority setting as well as estimations of costings [23, 65]; however, this study extends previ-ous investigations by considering local dynamics and heterogeneities, including the consideration of differ-ent zones, breeds in Faro et Déo and farmer-based in-terventions. The study also summarises key factors that influence the impact of AAT on cattle produc-tion and profitability of control operaproduc-tions (Table 2
and Additional file 1), to advocate for appropriate data collection during control campaigns to allow ex-ante as-sessments. Existing control programmes provide a wealth of information for designing future control programmes. However, these are resources which are currently not fully exploited [15].
Conclusions
As demonstrated in two study areas in Cameroon and Zambia, cost-benefit analysis can inform a priori the areas and control scenarios in which investment is likely to be most cost-beneficial. The data of this study have indicated that the elimination of tsetse populations from these study areas, particularly Faro et Déo will bring overall economic benefits for cattle farmers in these areas. The model allowed local heterogeneities, including different zones where cattle have different exposures to the disease to be considered. It is envisioned that the methodologies presented here can be adapted to other settings to aid the design andex-anteassessments of future initiatives.
Additional files
Additional file 1:Detailed data used to parameterize the bio-economic
model and key assumptions [66–85]. (DOCX 33 kb)
Abbreviations
AAT:animal African trypanosomiasis; BCR: benefit-cost ratio; HAT: human
African trypanosomiasis; ITC: insecticide treatment of cattle; ITT:
insecticide-treated targets; MSEG: Mission Spéciale d’Eradication des Glossines; NPV: net
present value; PATTEC: Pan African Tsetse and Trypanosomiasis Eradication Campaign; SAT: sequential aerial spraying; T&T: tsetse and trypanosomiasis; TTCU: Tsetse and Trypanosomiasis Control Unit
Acknowledgements
The authors would like to thank Professor Jonathan Rushton for his invaluable advice.
Funding
This work was funded by the Department for International Development
(DFID) of the UK government as part of GALVmed’s Animal African
Trypanosomosis Program [DFID Program: Controlling African Animal Trypanosomosis (AAT)] (Aries code 202040-101).
Availability of data and materials
The data supporting the conclusions of this article are included within the article and its additional file. The R script used for the economic model is available by request from HRH or AM. Tsetse Muse is an open source
software available fromtsetse.org.
Authors’contributions
The study was conceived by JG, HRH and AF. AM and WG contributed further to the design. AM designed the bio-economic herd model which was critically revised by HRH and WG. Extraction of data from MSEG and TTCU budgets and additional local data collection was performed by FO, KC and CM. AF, AM and HRH conducted the literature review to gather additional data. AM performed the cost-benefit analysis for Zambia and HRH performed the cost-benefit analysis for Cameroon. HRH and AM drafted the manuscript, which was critically revised by WG, CM and JG. All authors read and approved the final manuscript.
Ethics approval and consent to participate
Data for this study was primarily from secondary sources. However, the project was approved by the Clinical Research and Ethical Review Board of the Royal Veterinary College (project number 2504).
Consent for publication Not applicable.
Competing interests
The authors declare they have no competing interests.
Publisher’s Note
Springer Nature remains neutral with regard to jurisdictional claims in published maps and institutional affiliations.
Author details
1
Department of Pathobiology and Population Sciences, Royal Veterinary College, Hatfield, UK.2Mission Spéciale d’Eradication des Glossines,
Ngaoundéré, Cameroon.3Department of Veterinary Services, Tsetse and
Trypanosomiasis Control Unit, Ministry of Fisheries and Livestock, Lusaka, Zambia.4Department of Disease Control, School of Veterinary Medicine, University of Zambia, P.O. Box 32379, Lusaka, Zambia.
Received: 5 September 2017 Accepted: 29 January 2018
References
1. Christiaensen L, Demery L, Kuhl J. The (evolving) role of agriculture in poverty
reduction -an empirical perspective. J Devel Econ. 2011;96(2):239–54.
2. PATTEC. Pan African Tsetse and Trypanosomosis Eradication Campaign. A
continental plan of action for the eradication of tsetse and trypanosomosis. The OAU pathway for the PATTEC. Nairobi: OAU/STRC Publication; 2000.
3. Swallow BM. Impacts of trypanosomiasis on African agriculture (no. 2).
Rome, Italy: Food and Agriculture Organization; 2000.
4. Connor R. The diagnosis, treatment and prevention of animal
trypanosomiasis under field conditions. Programme for the control of African animal trypanosomiasis and related development: ecological and technical aspects, FAO animal production and health paper. Rome, Italy: Food and Agriculture Organization; 1992.
5. Ilemobade A. Tsetse and trypanosomosis in Africa: the challenges, the
opportunities. Onderstepoort J Vet Res. 2009;76(1):35–40.
6. Mamoudou A. Trypanosomosis and trypanocidal drug resistance on the
7. Sinyangwe L, Delespaux V, Brandt J, Geerts S, Mubanga J, Machila N. Trypanocidal drug resistance in eastern province of Zambia. Vet Parasitol.
2004;119(2–3):125–35.
8. Agyemang K. Trypanotolerant livestock in the context of trypanosomiasis
intervention strategies. In: PAAT technical and scientific series no 7. Rome, Italy: Programme Against African Trypanosomiasis, Food and Agriculture Organization of the United Nations; 2005. p. 73.
9. Welburn SC, Maudlin I, Simarro PP. Controlling sleeping sickness - a review.
Parasitology. 2009;136(14):1943–9.
10. World Health Organisation. Trypanosomiasis, human African (sleeping
sickness) Fact Sheet. 2016;http://www.who.int/mediacentre/factsheets/
fs259/en/. Accessed 21 Mar 2017.
11. Sutherland CS, Stone CM, Steinmann P, Tanner M, Tediosi F. Seeing
beyond 2020: an economic evaluation of contemporary and emerging
strategies for elimination ofTrypanosoma brucei gambiense. Lancet Glob
Health. 2017;5(1):e69–79.
12. Shaw AP. Economic guidelines for strategic planning of tsetse and
trypanosomiasis control in West Africa (no. 5). Food and Agriculture Organization: Rome, Italy; 2003.
13. Schofield CJ, Kabayo JP. Trypanosomiasis vector control in Africa and Latin
America. Parasit Vectors. 2008;1(1):24.
14. Holt HR, Selby R, Mumba C, Napier GB, Guitian J. Assessment of animal
African trypanosomiasis (AAT) vulnerability in cattle-owning communities of sub-Saharan Africa. Parasit Vectors. 2016;9(1):53.
15. Meyer A, Holt HR, Selby R, Guitian J. Past and ongoing tsetse and animal
trypanosomiasis control operations in five African countries: a systematic review. PLoS Negl Trop Dis. 2016;10(12):e0005247.
16. Hendrickx G, Rocque S, Reid R, Wint W. Spatial trypanosomosis
management: from data-layers to decision making. Trends Parasitol.
2001;17(1):35–41.
17. Kristjanson PM, Swallow BM, Rowlands GJ, Kruska RL, de Leeuw PN.
Measuring the costs of African animal trypanosomosis, the potential
benefits of control and returns to research. Agr Sys. 1999;59(1):79–98.
18. Shaw A, Cecchi G, Wint G, Mattioli R, Robinson T. Mapping the economic
benefits to livestock keepers from intervening against bovine
trypanosomosis in eastern Africa. Prev Vet Med. 2014;113(2):197–210.
19. Mattioli R, Feldmann U, Hendrickx G, Wint W, Jannin J, Slingenbergh J.
Tsetse and trypanosomiasis intervention policies supporting sustainable
animal-agricultural development. J Food Agr Environ. 2004;2:310–4.
20. Klassen W. Area-wide integrated pest management and the sterile insect
technique. In: Sterile Insect Technique. Dordrecht: Springer; 2005. p. 39–68.
21. Vreysen MJ. Prospects for area-wide integrated control of tsetse flies
(Diptera: Glossinidae) and trypanosomosis in sub-Saharan Africa. Rev Soc
Entomol Argent. 2006;65(1–2):1–21.
22. Bouyer J, Bouyer F, Donadeu M, Rowan T, Napier G. Community- and
farmer-based management of animal African trypanosomosis in cattle.
Trends Parasitol. 2013;29(11):519–22.
23. Shaw A, Torr S, Waiswa C, Cecchi G, Wint GRW, Mattioli RC, Robinson T.
Estimating the costs of tsetse control options: an example for Uganda. Prev
Vet Med. 2013;110:290–303.
24. Delespaux V, Geerts S, Brandt J, Elyn R, Eisler M. Monitoring the
correct use of isometamidium by farmers and veterinary assistants in Eastern Province of Zambia using the isometamidium-ELISA. Vet
Parasitol. 2002;110(1–2):117–22.
25. Shaw A, Wint GRW, Cecchi G, Torr S, Mattioli RC, Robinson T. Mapping the
benefit-cost ratios of interventions against bovine trypanosomosis in
eastern Africa. Prev Vet Med. 2015;122:406–16.
26. Rushton J, Thornton PK, Otte M. Methods of economic impact assessment.
Rev Sci Tech (OIE). 1999;18(2):315–42.
27. Mamoudou A, Zoli A, Van Den Bossche P, Delespaux V, Cuisance D,
Geerts S. Half a century of tsetse and animal trypanosomosis control on the Adamawa plateau in Cameroon. Rev Elev Med Vet Pays Trop.
2009;62:33–8.
28. Mamoudou A, Zoli A, Mbahin N, Tanenbe C, Clausen P-H, Marcotty T, et al.
Prevalence and incidence of bovine trypanosomosis on the Adamaoua plateau in Cameroon 10 years after the tsetse eradication campaign. Vet
Parasitol. 2006;142(1):16–22.
29. Tanenbe C, Gambo H, Musongong G, Boris O, Achukwi M: Prévalence de la
trypanosomose bovine dans les départements du Faro et Déo, et de la Vina au Cameroun: bilan de vingt années de lutte contre les glossines. Rev Elev
Med Vet Pays Trop. 2010;63(3–4):63–9.
30. Grant C. Whose knowledge matters in trypanosomiasis policy
making in Zambia? STEPS working paper 73. Brighton, UK: Social, Technological and Environmental Pathways to Sustainability (STEPS) Centre; 2014. p. 27.
31. Van den Bossche P, Staak C. The importance of cattle as a food source for
Glossina morsitans morsitansin Katete District, Eastern Province, Zambia.
Acta Trop. 1997;65(2):105–9.
32. Van den Bossche P, Doran M, Connor RJ. An analysis of trypanocidal drug
use in the Eastern Province of Zambia. Acta Trop. 2000;75(2):247–58.
33. Vale G, Torr S, Maudlin I, Holmes P, Miles M. Development of bait
technology to control tsetse. In: Maudlin I, Holmes PH, Miles MA, editors.
The trypanosomiases. Wallingford: CABI Publishing; 2004. p. 509–23.
34. Hargrove J. Tsetse eradication: sufficiency, necessity and desirability,
Research Report, Department for International Development. Edinburgh: University of Edinburgh; 2003.
35. Hargrove J. Target barriers for tsetse flies (Glossinaspp.) (Diptera:
Glossinidae): quick estimates of optimal target densities and barrier widths.
Bull of Entomol Res. 1993;83(02):197–200.
36. Vale GA. Torr SJ user-friendly models of the costs and efficacy of tsetse
control: application to sterilizing and insecticidal techniques. Med Vet
Entomol. 2005;19(3):293–305.
37. Achukwi MD, Gillingwater J, Nloga AMN, Simo G. Lack of evidence for
sufficiently isolated populations ofGlossina morsitans submorsitanson the
Adamawa plateau of Cameroon following geometric morphometric analysis. Advances Entomol. 2013;1(01):1.
38. Mamoudou A, Zoli A, Tchoua P. Parasitological prevalence of bovine
trypanosomosis in the Faro and Deo division valley of the Adamaoua
plateau. Cameroon Intl J Biol Chem Sci. 2009;3(5):1192–7.
39. Kgori P, Modo S, Torr SJ. The use of aerial spraying to eliminate tsetse from
the Okavango Delta of Botswana. Acta Trop. 2006;99(2):184–99.
40. Simukoko H, Marcotty T, Vercruysse J, Van den Bossche P. Bovine
trypanosomiasis risk in an endemic area on the eastern plateau of Zambia.
Res Vet Sci. 2011;90(1):51–4.
41. Girmay G, Arega B, Tesfaye D, Berkvens D, Muleta G, Asefa G.
Community-based tsetse fly control significantly reduces fly density and trypanosomosis prevalence in Metekel zone, northwest, Ethiopia. Trop Anim Health Pro 2016;48(3):633-642.
42. Magona J, Greiner M, Mehlitz D. Impact of tsetse control on the age-specific
prevalence of trypanosomosis in village cattle in southeast Uganda. Trop
Anim Health Pro. 2000;32(2):87–98.
43. Magona J, Okuna N, Katabazi B, Omollo P, Okoth J, Mayende J, Drabile D.
Control of tsetse and animal trypanosomosis using a combination of tsetse-trapping, pour-on and chemotherapy along the Uganda-Kenya border. Rev
Elev Med Vet Pays Trop. 1998;51(4):311–5.
44. Fauron A, Omarou F, Selby R, Holt H, Napier G, Guitian J. Baseline study for
the integration of novel treatments, vaccines and diagnostics into Animal African Trypanosomosis control programmes - Cameroon [http://vetvac.org/ galvmed/docRep/view_one.php?kp_doc=61] Accessed 21 Mar 2017.
45. Holt HR, Mumba C, Salines M, Selby R, Napier G, Guitian J. Baseline study for
the integration of novel treatments, vaccines and diagnostics into Animal African Trypanosomosis control programmes - Zambia [http://vetvac.org/ galvmed/docRep/view_one.php?kp_doc=64] Accessed 21 Mar 2017.
46. R Core Team. R. A language and environment for statistical computing.
Vienna, Austria: R Foundation for Statistical Computing; 2014.
47. Feldmann U, Dyck VA, Mattioli RC, Jannin J. Potential impact of tsetse
fly control involving the sterile insect technique. In: Dyck V, Hendrichs J, Robinson A, editors. Sterile insect technique: principles and practice in area-wide integrated pest management. Dordrecht: Springer; 2005.
p. 701–23.
48. Bouyer F, Seck MT, Dicko AH, Sall B, Lo M, Vreysen MJB, et al. Ex-ante
benefit-cost analysis of the elimination of aGlossina palpalis gambiensis
population in the Niayes of Senegal. PLoS Negl Trop Dis. 2014;8(8):e3112.
49. Brandl F. The use of a herd simulation model for the estimation of
direct economic benefits of tsetse control. Application to the pastoral zone of Sideradougou, Burkina Faso. Rev Elev Med Vet Pays Trop. 1985;
38(4):364–70.
50. Ripple WJ, Newsome TM, Wolf C, Dirzo R, Everatt KT, Galetti M, et al.
Collapse of the world’s largest herbivores. Sci Adv. 2015;1(4):e1400103.
51. Prins HH. Competition between wildlife and livestock in Africa. In: Prins H,
Grootenhuis J, Dolan T, editors. Wildlife conservation by sustainable use.
52. Adam Y, Cecchi G, Kgori PM, Marcotty T, Mahama CI, Abavana M, et al. The sequential aerosol technique: a major component in an integrated strategy of intervention against riverine tsetse in Ghana. PLoS Neg Trop Dis. 2013;7(3):e2135.
53. Warnes ML, Van den Bossche P, Chihiya J, Mudenge D, Robinson TP,
Shereni W, Chadenga V. Evaluation of insecticide-treated cattle as a barrier to re-invasion of tsetse to cleared areas in northeastern Zimbabwe. Medical
Vet Entomol. 1999;13(2):177–84.
54. Dolan RB. The Orma Boran: a trypanotolerant east African breed: Fifteen
years of research on Galana Ranch in Kenya. Nairobi, Kenya: KETRI (Kenya
Trypanosomiasis Research Institute); 1998:https://www.ilri.org/biometrics/
Publication/Full%20Text/Dolan.pdfAccessed 21 Mar 2017.
55. Murray M, Trail J. Genetic resistance to animal trypanosomiasis in Africa.
Prev Vet Med. 1984;2(1–4):541–51.
56. Murray M, Morrison W, Murray P, Clifford D, Trail J. Trypanotolerance - a
review. World Anim Rev. 1979;31:2–12.
57. Abdoulmoumini M, Jean EN, Suh PF, Youssouf MM. Prevalence and impact
of bovine trypanosomiasis in Mayo Rey division, a Soudano-Sahelian zone
of Cameroon. J Parasitol Vector Biol. 2015;7(5):80–8.
58. World Bank. What would it take for Zambia’s beef and dairy industries to
achieve their potential? Finance & Private Sector Development Unit of the World Bank; 2011. p. 98.
59. Thomson G, Penrith ML, Atkinson M, Atkinson S, Cassidy D, Osofsky S.
Balancing livestock production and wildlife conservation in and around southern Africa's transfrontier conservation areas. Transbound Emerg Dis.
2013;60(6):492–506.
60. Cumming D. Constraints to conservation and development success at the
wildlife-livestock-human interface in southern African transfrontier conservation areas: a preliminary review. In: Technical report to the Wildlife
Conservation Society’s AHEAD Program. New York: Wildlife Conservation
Society; 2011. p. 37.
61. Barnes J, Boyd C, Cannon J. Economic incentives for rangeland
management in northern Botswana: implications for biodiversity. In: Roc
VIIth International Rangelands Congress; 2003. p. 203–12.
62. Mizutani F, Muthiani E, Kristjanson P, Recke H. Impact and value of
wildlife in pastoral livestock production systems in Kenya: possibilities for healthy ecosystem conservation and livestock development for the poor. In: Osofsky S, Cleaveland S, Karesh W, Kock M, Nyhus P, Starr L, Yang A, editors. Conservation and development interventions at the wildlife/livestock interface: implications for wildlife, livestock and human health. Durban, South Africa: The World Conservation
Union; 2005. p. 121–32.
63. Kamuanga M. Socio-economic and cultural factors in the research and
control trypanosomiasis. In: PAAT Technical and Scientific Series, vol. 4: Programme Against African Trypanosomiasis, Food and Agriculture Organization of the United Nations; 2003. p 71.
64. FAO. Workshop on strategic planning of area-wide tsetse and
trypanosomiasis control in West Africa. Ouagadougou, Burkina-Faso: Programme Against African Trypanosomiasis, Food and Agriculture Organization of the United Nations; 2001. p. 66.
65. Muhanguzi D, Okello WO, Kabasa JD, Waiswa C, Welburn SC, Shaw AP. Cost
analysis of options for management of African animal trypanosomiasis using interventions targeted at cattle in Tororo District; south-eastern Uganda. Parasit Vectors. 2015;8(1):387.
66. Conservation Farming Unit. Conservation Farming & Conservation
Agriculture Handbook for ox farmers in agro-ecological regions l & lla. Lusaka, Zambia: Conservation Farming Unit; 2007.
67. Deffo V, Pamo E, Tchotsoua M, Lieugomg M, Arene C, Nwagbo E.
Determination of the critical period for cattle farming in Cameroon. Int J
Livest Prod. 2011;2(5):59–68.
68. Bayemi P, Webb E, Manjeli Y, Naoussi P. Economic opportunity survey of
small scale dairy farms of the north-west province of Cameroon. Trop Anim
Health Pro. 2007;39(8):583–92.
69. Ndi C, Tambi NE, Agharih NW. Reducing calf wastage from the
slaughtering of pregnant cows in Cameroon. World Anim Rev. 1993; 77:v1650T0g.
70. Mumba C, Pandey G, van der Jagt C. Milk production potential, marketing
and income opportunities in key traditional cattle keeping areas of Zambia. Livest Res Rural Dev. 2013;25(4):article number 73.
71. Mumba C, Häsler B, Muma J, Munyeme M, Sitali D, Skjerve E, Rich K.
Practices of traditional beef farmers in their production and marketing of
cattle in Zambia. Trop Anim Health Pro. 2018;50(1):49–62.
72. Bayemi P, Bryant M, Perera B, Mbanya J, Cavestany D, Webb E. Milk
production in Cameroon: a review. Livest Res Rural Dev. 2005;17(6):article number 60.
73. Walker CA. Milking capacity of indigenous cattle in Zambia. In: Annual
Report. Lusaka: Ministry of Agriculture; 1964.
74. Njoya A, Awa D, Bouchel D. Influence de la complémentation et de la
prophylaxie sur la viabilité des ovins Foulbé au Nord Cameroun. Rev Elev
Méd Vét Pays Trop. 1997;50:227–33.
75. Wagenaar K, Diallo A, Sayers A. Productivity of transhumant Fulani cattle in
the inner Niger delta of Mali. International Livestock Centre for Africa: Addis Ababa, Ethiopia; 1986.
76. Domestic Animal Diversity Information System (DAD-IS), Angoni breed- Zambia.
http://www.fao.org/dad-is/. Accessed 21 Mar 2017.
77. Van den Bossche P. Some general aspects of the distribution and
epidemiology of bovine trypanosomosis in southern Africa. Int J Parasitol.
2001;31(5):592–8.
78. FAO/IEOA. Genetic characterization of indigenous cattle breeds in Zambia
-which way forward?
http://www-naweb.iaea.org/nafa/news/2011-zambia-cattle-breeds.html. Accessed 5 Feb 2018.
79. Rege J, Ayalew W, Getahun E, Hanotte O, Dessie T. DAGRIS (domestic
animal genetic resources information system). Addis Ababa, Ethiopia: International Livestock Research Institute; 2006.
80. Mwenya WNM. The diversity and conservation status of livestock and
poultry genetic resources in Zambia. In: Proceedings of the planning and priority setting workshop on animal genetic resources in the SADC region. Gaborone, Botswana: International Livestock Centre for Africa; 2001.
81. Nfor BM, Corazzin M, Fonteh FA, Aziwo NT, Galeotti M, Piasentier E. Quality
and safety of beef produced in central African sub-region. Ital J Anim Sci. 2014;13(2):3114.
82. Wilson RT. The environmental ecology of oxen used for draught power.
Agric Ecosys Environ. 2003;97(1):21–37.
83. Shaw A. Assessing the economics of animal trypanosomosis in Africa - history
and current perspectives. Onderstepoort J Vet Res. 2009;76(1):27–32.
84. Mamoudou A, Delespaux V, Chepnda V, Hachimou Z, Andrikaye JP, Zoli A,
Geerts S. Assessment of the occurrence of trypanocidal drug resistance in trypanosomes of naturally infected cattle in the Adamaoua region of Cameroon using the standard mouse test and molecular tools. Acta Trop.
2008;106(2):115–8.
85. Torr S, Vale G. Tsetse muse: an interactive programme to assess the impact
of control operations on tsetse populations. Final technical report. London, UK: Department for International Development; 2005.
• We accept pre-submission inquiries
• Our selector tool helps you to find the most relevant journal
• We provide round the clock customer support
• Convenient online submission
• Thorough peer review
• Inclusion in PubMed and all major indexing services
• Maximum visibility for your research
Submit your manuscript at www.biomedcentral.com/submit