RESEARCH
Identification of potential transcriptomic
markers in developing pediatric sepsis: a
weighted gene co-expression network analysis
and a case–control validation study
Yiping Li
1†, Yanhong Li
1,2†, Zhenjiang Bai
3†, Jian Pan
1, Jian Wang
1*and Fang Fang
1*Abstract
Background: Sepsis represents a complex disease with the dysregulated inflammatory response and high mortality rate. The goal of this study was to identify potential transcriptomic markers in developing pediatric sepsis by a co-expression module analysis of the transcriptomic dataset.
Methods: Using the R software and Bioconductor packages, we performed a weighted gene co-expression network analysis to identify co-expression modules significantly associated with pediatric sepsis. Functional interpretation (gene ontology and pathway analysis) and enrichment analysis with known transcription factors and microRNAs of the identified candidate modules were then performed. In modules significantly associated with sepsis, the intramod-ular analysis was further performed and “hub genes” were identified and validated by quantitative real-time PCR (qPCR) in this study.
Results: 15 co-expression modules in total were detected, and four modules (“midnight blue”, “cyan”, “brown”, and “tan”) were most significantly associated with pediatric sepsis and suggested as potential sepsis-associated modules. Gene ontology analysis and pathway analysis revealed that these four modules strongly associated with immune response. Three of the four sepsis-associated modules were also enriched with known transcription factors (false discovery rate-adjusted P < 0.05). Hub genes were identified in each of the four modules. Four of the identified hub genes (MYB proto-oncogene like 1, killer cell lectin like receptor G1, stomatin, and membrane spanning 4-domains A4A) were further validated to be differentially expressed between septic children and controls by qPCR.
Conclusions: Four pediatric sepsis-associated co-expression modules were identified in this study. qPCR results sug-gest that hub genes in these modules are potential transcriptomic markers for pediatric sepsis diagnosis. These results provide novel insights into the pathogenesis of pediatric sepsis and promote the generation of diagnostic gene sets.
Keywords: Transcriptomic markers, Co-expression modules, Pediatric sepsis, Diagnosis, Hub genes
© The Author(s) 2017. This article is distributed under the terms of the Creative Commons Attribution 4.0 International License (http://creativecommons.org/licenses/by/4.0/), which permits unrestricted use, distribution, and reproduction in any medium, provided you give appropriate credit to the original author(s) and the source, provide a link to the Creative Commons license, and indicate if changes were made. The Creative Commons Public Domain Dedication waiver (http://creativecommons.org/ publicdomain/zero/1.0/) applies to the data made available in this article, unless otherwise stated.
Background
Sepsis represents a complex disease with the dysregu-lated inflammatory response and high mortality rate. It is the world’s leading killer of children [1]. However, current
knowledge of the pathogenesis of sepsis is limited [2, 3]. In the past decade, several studies have reported the transcriptional profiling of sepsis using microarrays to identify candidate genes involved in sepsis development [4–7]. Co-expression module analysis of transcriptomic dataset has the likelihood of discovering robust candi-dates for diagnosis and treatment. Therefore, we investi-gated gene expression patterns between pediatric sepsis patients and healthy controls in this study based on pub-lic microarray dataset. Network construction and module
Open Access
*Correspondence: [email protected]; [email protected]
†Yiping Li, Yanhong Li and Zhenjiang Bai contributed equally to this work 1 Institute of Pediatric Research, Children’s Hospital of Soochow University,
Suzhou, China
detection were performed. The importance of candidate modules identified in this study were evaluated, and modules most significantly associated with sepsis were further interpreted by enrichment analysis, intramodular analysis and quantitative real-time PCR (qPCR).
To carry out these analyses, we used the R software (v3.3.2) [8] and Bioconductor packages [9] for data pre-procession and weighted gene co-expression net-work analysis. Functional interpretation and netnet-work construction of co-expression modules were also per-formed using DAVID [10, 11] and Cytoscape [12] soft-ware, respectively. Enrichment analysis of the candidate module genes with known transcription factors and microRNAs was also performed using WebGestalt [13]. Validation of gene expression patterns was performed by qPCR in this study.
Methods
Microarray datasets search and selection
In this study, we searched public microarray datasets till Jul 12, 2016, according to the keywords “sepsis” in Gene Expression Omnibus (GEO) database [14]. The datasets obtained were further selected for subsequent analysis,
and our selection criteria were: (a) case–control data-set; (b) dataset using whole blood from children for gene expression analysis; (c) dataset providing detailed gene expression data; (d) dataset with sample size (septic chil-dren and controls in total) larger than 100. Animal stud-ies and studstud-ies of adults were excluded.
Pre‑procession of microarray gene expression dataset One dataset fulfilled the selection criteria and was used for further analysis. This eligible dataset (GSE13904) was generated using the Affymetrix Human Genome U133 Plus 2.0 Array from 99 pediatric sepsis patients (32 sep-sis and 67 septic shock patients) and 18 normal controls [7]. Raw data saved in.CEL files of the eligible dataset was downloaded from GEO database, and then pre-processed (background correction, quantile normalization, log2 transformed) using the Robust Multichip Average (RMA) method of the R package “affy” [15]. Next, the hybridiza-tion probes were mapped to genes (Entrez IDs) according to the platform table. Probes mapping to multiple genes and probes not mapping to genes were excluded. When multiple probes mapped to the same gene, arithmetic
[image:2.595.60.542.380.711.2]mean of probe values were calculated to represent gene expression.
Weighted gene co‑expression network analysis
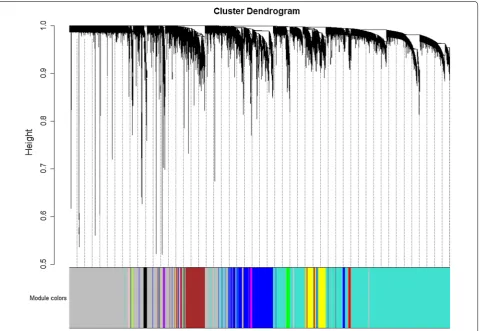
Weighted gene co-expression network analysis was car-ried out using the R package “WGCNA” [16] in this study. Pre-processed gene expression data were first checked for missing values and outliers. The genes and samples which passed the test were collected for network analysis. One-step network construction and module detection were then performed, with the soft-thresholding power β set to 14 according to the criterion of approximate scale-free topology (Additional file 1), the minimum module size set to 30, and the threshold for merging of modules set to 0.25. Modules significantly associated with sepsis were identified based on the correlation between mod-ule eigengenes and sample types (sepsis patients versus healthy controls). Gene relationships to sepsis and mod-ules were then evaluated by gene significance (GS, cor-relation of individual gene expression with sepsis) and
module membership (MM, correlation of individual gene expression with module eigengene). Network construc-tion of co-expression modules was also performed using Cytoscape 3.4.0 [12] software.
Enrichment analysis
Functional interpretation [gene ontology (GO) analysis and Kyoto Encyclopedia of Genes and Genomes (KEGG) pathway analysis] of the co-expression genes in sepsis-associated modules was further performed using DAVID 6.8 [10, 11]. In GO analysis, a P value threshold of 0.05 was used to identify significantly enriched GO terms [17]. In pathway analysis, enrichment analysis was carried out using the hypergeometric test with a P value threshold of 0.05 based on the KEGG database [18]. Enrichment analysis of the candidate module genes with known tran-scription factors and microRNAs was also performed using WebGestalt [13], according to the criteria: (a) false discovery rate (FDR)-adjusted P value < 0.05; (b) a mini-mum number of genes in a category: two.
Table 1 Top 4 sepsis-associated co-expression modules
a Student asymptotic P value for correlation
Module Correlation coefficient with pediatric sepsis Pa Number of genes
Midnight blue − 0.67 2 × 10⁻¹⁶ 39
Cyan 0.65 2 × 10⁻¹⁵ 39
Brown 0.54 4 × 10⁻¹⁰ 1382
Tan − 0.53 1 × 10⁻⁹ 80
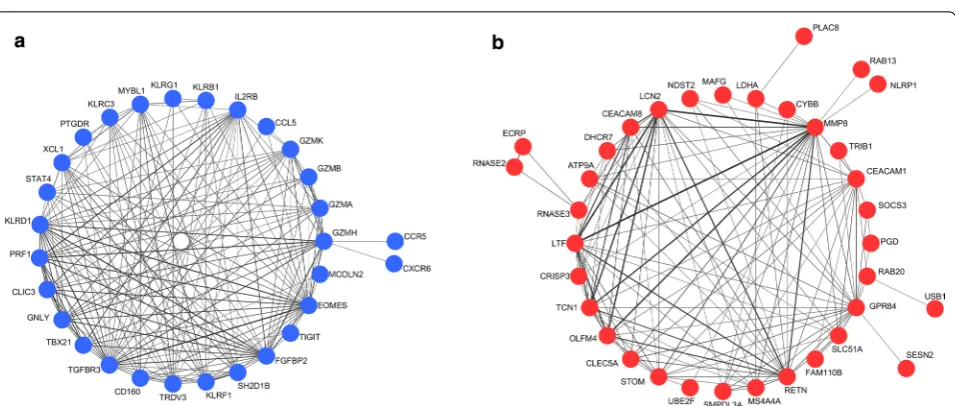
Fig. 2 Co-expression networks of the top 2 sepsis-associated modules. a Network of module “midnight blue”. b Network of module “cyan”. Edge
[image:3.595.59.543.100.172.2] [image:3.595.60.538.208.411.2]Table
2
Summar
y of the GO and pa
th
w
ay analy
sis r
esults of the f
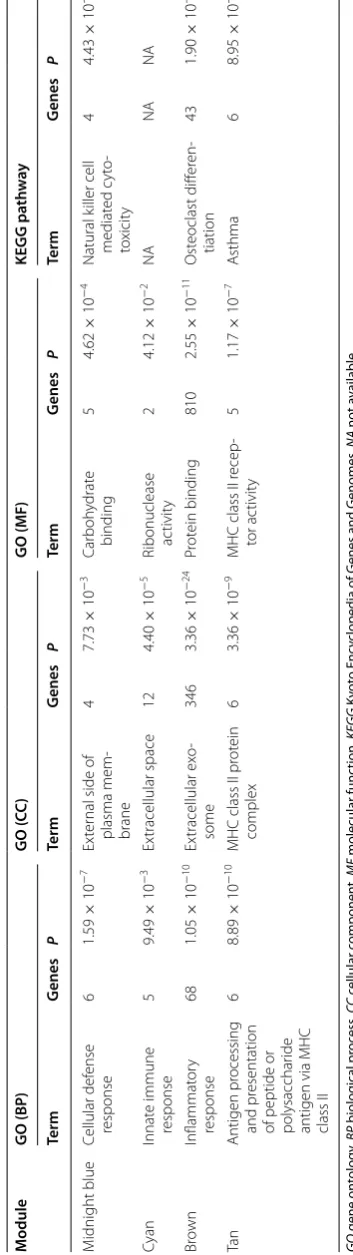
our sepsis-asso cia ted mo dules GO gene on tology , BP biolog ical pr oc ess , CC c ellular c omponen t, MF molecular func tion, KEGG K yot o Enc
yclopedia of G
enes and G
enomes , NA not a vailable M odule GO (BP ) GO ( CC ) GO (MF) KEGG pa th w ay Term G enes P Term G enes P Term G enes P Term G enes P M idnight blue Cellular def ense response 6 1.59 × 10 − 7 Ex ter
nal side of
plasma mem -brane 4 7.73 × 10 − 3 Car boh ydrat e binding 5 4.62 × 10 − 4 Natural k iller cell mediat ed c yt o-to xicit y 4 4.43 × 10 − 3 Cyan Innat e immune response 5 9.49 × 10 − 3 Ex tracellular space 12 4.40 × 10 − 5
Ribonuclease ac
tivit y 2 4.12 × 10 − 2 NA NA NA Br own Inflammat or y response 68 1.05 × 10 − 10 Ex tracellular ex o-some 346 3.36 × 10 − 24 Pr ot ein binding 810 2.55 × 10 − 11 Ost eoclast diff er en -tiation 43 1.90 × 10 − 12 Ta n Antigen pr ocessing and pr esentation
of peptide or polysacchar
ide
antigen via MHC class II
6 8.89 × 10 − 10
MHC class II pr
ot ein complex 6 3.36 × 10 − 9
MHC class II r
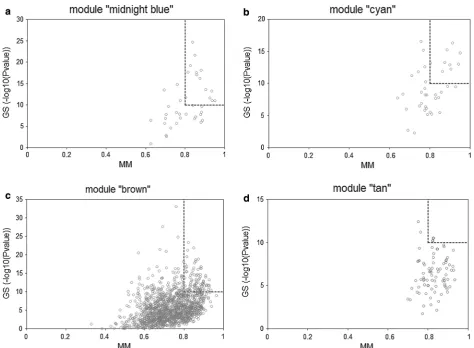
[image:4.595.213.390.97.726.2]Intramodular analysis and quantitative real‑time PCR For modules significantly associated with sepsis, the intramodular analysis was performed and “hub genes” were identified according to the criteria: (a) LOG10 (P value of GS) ≥ 10; (b) MM ≥ 0.8.
Validation of hub gene expression patterns was per-formed by qPCR in this study. 45 pediatric sepsis patients were included. 16 children who were sched-uled for minor elective surgery such as circumcision or inguinal hernia repair were also included as the control group. All heparinized blood samples were obtained from Children’s Hospital of Soochow Univer-sity. Informed consent was obtained from each partici-pating individual’s guardian. The study procedure was approved by the ethics committee of Children’s Hospital of Soochow University.
Mononuclear cells (MNCs) were isolated, and then stored at − 80 °C before RNA extraction. Total RNA was
extracted using RNAiso (TaKaRa, Dalian, China). The RNA was reverse-transcribed using oligo-dT, and mouse mammary tumor virus reverse transcriptase. qPCR was performed with SYBR Green master mix. Primers designed were shown in Additional file 2. Gene expres-sion was normalized to β-actin mRNA. The relative expression of gene transcript was calculated using the 2−ΔΔCt method. Comparison of clinical characteristics between study groups was performed using the Mann– Whitney U test for continuous variables and the Fisher’s exact test for categorical variables. Mann–Whitney U test was also performed to determine the expression dif-ference between septic children and the control group. Statistical analyses were performed with GraphPad Prism software (GraphPad Software Inc.). All P values are two-sided. P < 0.05 was considered as statistically significant.
In addition, the diagnostic performance of hub genes were also evaluated in the validation group (45 septic chil-dren and 16 controls) by receiver operating characteristic (ROC) curve plotting and area under the curve (AUC) values calculation using the R package “pROC” [19]. Results
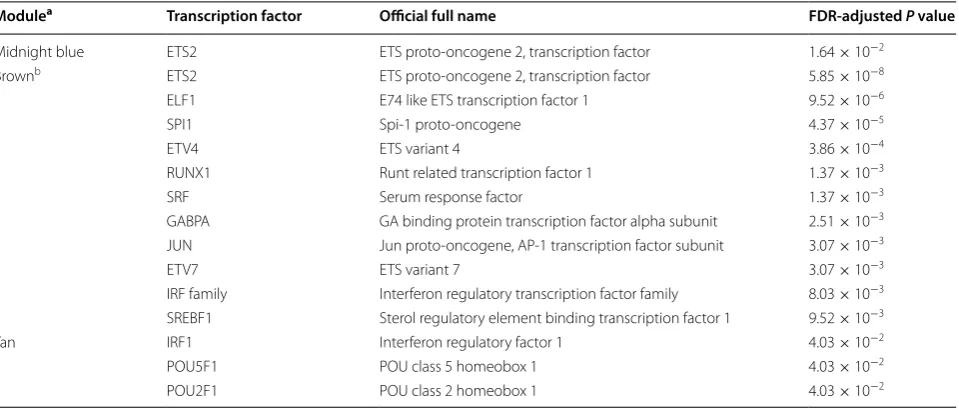
Co‑expression modules in pediatric sepsis development Original search identified one eligible microarray dataset (GSE13904) [7]. Pre-processing of this dataset resulted in expression data of 20,464 genes in 99 pediatric sep-sis samples and 18 normal controls. According to the parameters (soft-thresholding power β = 14, minimum Table 3 Summary of the transcription factor enrichment analysis results of the four sepsis-associated modules
FDR false discovery rate
a No significantly enriched transcription factor was identified in module “cyan”
b Transcription factors with FDR-adjusted P value < 0.01 were listed for module “brown” for the sake of brevity
Modulea Transcription factor Official full name FDR‑adjusted P value
Midnight blue ETS2 ETS proto-oncogene 2, transcription factor 1.64 × 10⁻²
Brownb ETS2 ETS proto-oncogene 2, transcription factor 5.85 × 10⁻⁸
ELF1 E74 like ETS transcription factor 1 9.52 × 10⁻⁶
SPI1 Spi-1 proto-oncogene 4.37 × 10⁻⁵
ETV4 ETS variant 4 3.86 × 10−4
RUNX1 Runt related transcription factor 1 1.37 × 10⁻³
SRF Serum response factor 1.37 × 10⁻³
GABPA GA binding protein transcription factor alpha subunit 2.51 × 10⁻³
JUN Jun proto-oncogene, AP-1 transcription factor subunit 3.07 × 10⁻³
ETV7 ETS variant 7 3.07 × 10⁻³
IRF family Interferon regulatory transcription factor family 8.03 × 10⁻³
SREBF1 Sterol regulatory element binding transcription factor 1 9.52 × 10⁻³
Tan IRF1 Interferon regulatory factor 1 4.03 × 10⁻²
POU5F1 POU class 5 homeobox 1 4.03 × 10⁻²
POU2F1 POU class 2 homeobox 1 4.03 × 10⁻²
Fig. 3 Enriched transcription factors of particular interest. ETS2 and
[image:5.595.60.540.101.306.2] [image:5.595.59.290.363.435.2]module size = 30, and the threshold for merging of mod-ules = 0.25) and the hierarchical clustering dendrogram (Fig. 1) used for the module identification in this study, 15 modules in total were detected with sizes ranging from 8359 to 39 genes. Among the 15 candidate modules, four modules (module “midnight blue”, module “cyan”, module “brown”, and module “tan”) were most signifi-cantly associated with sepsis and suggested as potential sepsis-associated modules (see Table 1). Co-expression networks of the top 2 sepsis-associated modules (module “midnight blue” and module “cyan”) are shown in Fig. 2. Enrichment analysis results
Advanced analyses (GO analysis and pathway analy-sis) were carried out for further functional investigation of the four sepsis-associated co-expression modules. Table 2 presented a summary of the GO and pathway analysis results. In the GO analysis, the top GO biologi-cal process terms enriched are “cellular defense response”
in module “midnight blue”, “innate immune response” in module “cyan”, “inflammatory response” in module “brown”, and “antigen processing and presentation of peptide or polysaccharide antigen via MHC class II” in module “tan”. In the pathway analysis, the most signifi-cant pathways identified were natural killer cell-mediated cytotoxicity in module “midnight blue”, osteoclast differ-entiation in module “brown”, and asthma in module “tan”, when we mapped the module genes to the KEGG data-base. No significantly enriched pathway was identified in module “cyan”.
Enrichment analysis of genes in the four sepsis-asso-ciated modules with known transcription factors and microRNAs was also performed using WebGestalt [13]. As presented in Table 3, three of the four sepsis-associated modules were enriched with known tran-scription factors (FDR-adjusted P value < 0.05). Among them, transcription factors of particular interest are ETS proto-oncogene 2, transcription factor (ETS2) and the
Fig. 4 Scatterplots of the intramodular analysis results and hub genes identified in the four sepsis-associated modules. a Scatterplot for module
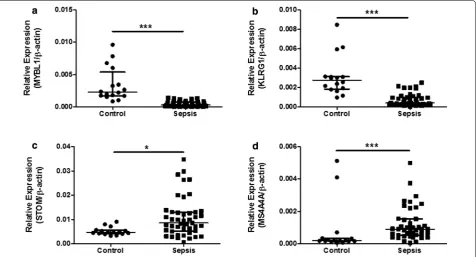
[image:6.595.60.535.339.687.2]their difference in expression between 45 septic children and 16 controls (Table 4) by qPCR. As presented in Fig. 6, the expression levels of MYBL1 and KLRG1 in the sep-sis group were significantly lower than those of the con-trol group (P < 0.001 respectively, see Fig. 6a, b). While STOM and MS4A4A were significantly overexpressed in sepsis samples, compared with controls (P = 0.04 and P < 0.001 respectively, see Fig. 6c, d). As for diagnostic prediction quality, the four hub genes showed good per-formance as well according to the ROC analysis in the validation group (45 septic children and 16 controls) (see Fig. 7). Both the qPCR results and ROC analysis results suggest that the four hub genes (MYBL1, KLRG1, STOM and MS4A4A) could be novel diagnostic biomarkers for pediatric sepsis.
Discussion
Some genes have been reported to be up-regulated or down-regulated in pediatric sepsis patients [5, 7]. Iden-tification of the most important candidate genes and pathways involved in sepsis pathogenesis is a challenge currently. Growing high-throughput transcriptomic data
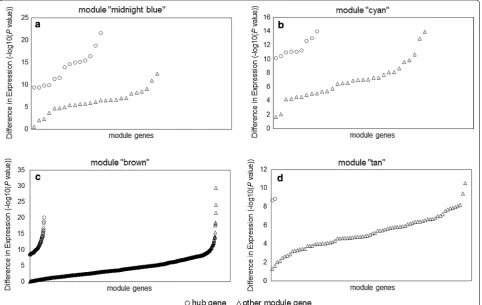
Fig. 5 Differences in expression of hub genes and other module genes between 99 pediatric sepsis samples and 18 normal controls from dataset
GSE13904. a Differences in expression for module “midnight blue”. b Differences in expression for module “cyan”. c Differences in expression for module “brown”. d Differences in expression for module “tan”
interferon regulatory transcription factor (IRF) fam-ily, as they function in the regulation of multiple sepsis-associated co-expression modules (see Fig. 3). However, no significantly enriched microRNA was identified in this study.
Hub gene identification and validation
[image:7.595.58.541.381.686.2]enables weighted gene co-expression network analysis of microarray datasets which has the likelihood of dis-covering robust candidates for diagnosis and treatment. Hence in this study, we performed a weighted gene co-expression network analysis of public microarray dataset
to identify potential transcriptomic markers in develop-ing pediatric sepsis.
In this analysis, 15 co-expression modules were iden-tified, among which four modules (module “midnight blue”, module “cyan”, module “brown”, module “tan”) were significantly associated with pediatric sepsis and were potential sepsis-associated modules. The enrich-ment analysis indicated that transcription factors (ETS2 and the IRF family) play roles in the regulation of mul-tiple sepsis-associated modules. So far there is increas-ing evidence that the IRF family plays a part in sepsis [20,
21]. Whereas little is known about the impact of ETS2 on sepsis and further investigation is needed.
Through intramodular analysis, 123 hub genes in total were identified in the four sepsis-associated co-expression modules, including hub genes known to play roles in sepsis, and hub genes without previous studies in sepsis. Among those novel hub genes, we assessed the expression patterns of MYBL1, KLRG1, STOM and MS4A4A from the top 2 sepsis-associated modules (module “midnight blue” and module “cyan”) by qPCR. Significantly different expressions between pediatric sepsis patients and controls were detected for all four genes, validating the intramodular analy-sis results. MYBL1 belongs to the MYB family and is
Fig. 6 qPCR results of MYBL1, KLRG1, STOM and MS4A4A between 45 septic children and 16 controls. a MYBL1 relative expression comparison
between pediatric sepsis patients and controls (Mann–Whitney U test, ***P < 0.001). b KLRG1 relative expression comparison between pediatric sepsis patients and controls (Mann–Whitney U test, ***P < 0.001). c STOM relative expression comparison between pediatric sepsis patients and controls (Mann–Whitney U test, *P = 0.04). d MS4A4A relative expression comparison between pediatric sepsis patients and controls (Mann–Whit-ney U test, ***P < 0.001)
Table 4 Clinical characteristics of the validation group
aP value of the Mann–Whitney U test bP value of the Fisher’s exact test
Characteristic Sepsis Control P
Number 45 16
Age, median years [range] 1.50 [0.08–13.42] 1.92 [0.08–10.50] 0.95a
Gender 0.22b
Male 27 13
Female 18 3
Infection site
Lung (%) 15 (33.3) – –
Brain (%) 11 (24.4) – –
Others (%) 19 (42.2) – –
Septic shock (%) 17 (37.8) – –
[image:8.595.56.290.100.278.2] [image:8.595.62.539.414.671.2]ICU stay, median days
[range] 5.38 [0.08, 30.00] – –
Fig. 7 Receiver operating characteristic (ROC) curves of the hub genes on diagnosis of pediatric sepsis. AUC: area under the ROC curve. a ROC curve of MYBL1. b ROC curve of KLRG1. c ROC curve of STOM. d ROC curve of MS4A4A
involved in adenoid cystic carcinoma and pediatric glioma [22, 23]. KLRG1 encodes a receptor on antigen-experienced T cells and natural killer cells [24, 25]. It is suggested as a senescent marker of human T cells [26]. In tumor microenvironment, KLRG1 is significantly overexpressed in T cells [27]. STOM encodes a major lipid-raft protein stomatin, which locates at the plasma membrane of multiple cell types [28–30], and is asso-ciated with non-small cell lung cancer [31] and erb-b2 receptor tyrosine kinase 2-positive breast cancer [32]. MS4A4A, a member of the membrane-spanning 4-domains subfamily A, is reported to be a cell-surface marker of plasma cells and M2 macrophages [33]. It is also up-regulated in the autopsied brain tissue of Alzheimer’s disease patients [34]. In this study, ROC
analysis results further indicate that the four hub genes (MYBL1, KLRG1, STOM and MS4A4A) had good diagnostic performance in sepsis, close to that of genes previously reported [35]. Although the exact contributions of the four and other novel hub genes to sepsis are not clear yet, further research is necessary as those genes could be potential transcriptomic markers for sepsis.
[image:9.595.57.538.87.486.2]and pathway information available at present. Hence, to achieve a more convincible conclusion, further analysis using larger sample size is required. Stratified analyses on different factors such as age, gender, disease severity, and platform usage are also needed. Functional studies should be performed as well to address the exact roles of the candidate hub genes in pediatric sepsis.
Conclusions
In conclusion, we identified four candidate co-expres-sion modules that were differentially expressed between pediatric sepsis patients and normal controls. GO, and pathway analyses revealed that those candidate modules strongly associated with immune response. Transcrip-tion factors associated with the modules were also iden-tified through enrichment analysis in this study. qPCR results suggest hub genes (MYBL1, KLRG1, STOM and MS4A4A) in the candidate modules as promising poten-tial transcriptomic markers for pediatric sepsis diagno-sis. To the best of our knowledge, there is no reported weighted gene co-expression network analysis for sepsis so far. We hope this study can help in the diagnosis and treatment of pediatric sepsis.
Abbreviations
AUC: area under the curve; BP: biological process; CC: cellular component; ETS2: ETS proto-oncogene 2, transcription factor; FDR: false discovery rate; GEO: Gene Expression Omnibus; GO: gene ontology; GS: gene significance; ICU: Intensive Care Unit; IRF: interferon regulatory transcription factor; KEGG: Kyoto Encyclopedia of Genes and Genomes; KLRG1: killer cell lectin-like receptor G1; MF: molecular function; MM: module membership; MNCs: mononuclear cells; MS4A4A: membrane spanning 4-domains A4A; MYBL1: MYB proto-oncogene like 1; NA: not available; qPCR: quantitative real-time PCR; RMA: Robust Multichip Average; ROC: receiver operating characteristic; STOM: stomatin.
Authors’ contributions
FF and WJ designed the study, analyzed the data and drafted the manuscript; LYP, LYH, and BZJ acquired patient data and performed laboratory experi-ments; PJ contributed to the study design and writing of the manuscript. All authors read and approved the final manuscript.
Author details
1 Institute of Pediatric Research, Children’s Hospital of Soochow University,
Suzhou, China. 2 Department of Nephrology, Children’s Hospital of Soochow
University, Suzhou, China. 3 Pediatric Intensive Care Unit, Children’s Hospital
of Soochow University, Suzhou, China.
Acknowledgements
Not applicable. Additional files
Additional file 1. Analysis of network topology for candidate soft-thresh-olding powers (βs).
Additional file 2. Primers designed for validation of hub gene expression patterns by qPCR.
Competing interests
The authors declare that they have no competing interests.
Availability of data and materials
The datasets supporting the conclusions of this article are within the article and its additional files.
Consent for publication
All authors approve the publication of this manuscript.
Ethics approval and consent to participate
The study procedure was approved by the ethics committee of Children’s Hospital of Soochow University, and informed consent was obtained from each participating individual’s guardian.
Funding
This work was supported by grants from National Natural Science Founda-tion [Grant Number 81501840]; Jiangsu Provincial Medical Youth Talent [Grant Number QNRC2016768]; Suzhou science and technology development project [Grant Number SYSD2014102]; National Natural Science Foundation [Grant Numbers 81501700, 81571551, 81570125]; Jiangsu province’s science and technology support program (Social Development) [Grant Number BE2016675]; and Major International (Regional) Joint Research Project [Grant Number 81420108022]. None of the sponsors was involved in the design of the study, in the collection, analysis, and interpretation of data, or in writing the manuscript.
Publisher’s Note
Springer Nature remains neutral with regard to jurisdictional claims in pub-lished maps and institutional affiliations.
Received: 17 October 2017 Accepted: 8 December 2017
References
1. Kissoon N, Carapetis J. Pediatric sepsis in the developing world. J Infect. 2015;71(Suppl 1):S21–6.
2. Stearns-Kurosawa DJ, Osuchowski MF, Valentine C, Kurosawa S, Remick DG. The pathogenesis of sepsis. Annu Rev Pathol. 2011;6:19–48. 3. Faix JD. Biomarkers of sepsis. Crit Rev Clin Lab Sci. 2013;50(1):23–36. 4. Tang BM, McLean AS, Dawes IW, Huang SJ, Lin RC. Gene-expression
profiling of peripheral blood mononuclear cells in sepsis. Crit Care Med. 2009;37(3):882–8.
5. Dickinson P, Smith CL, Forster T, Craigon M, Ross AJ, Khondoker MR, et al. Whole blood gene expression profiling of neonates with confirmed bacterial sepsis. Genom Data. 2014;3:41–8.
6. Demaret J, Venet F, Friggeri A, Cazalis MA, Plassais J, Jallades L, et al. Marked alterations of neutrophil functions during sepsis-induced immu-nosuppression. J Leukoc Biol. 2015;98(6):1081–90.
7. Wong HR, Cvijanovich N, Allen GL, Lin R, Anas N, Meyer K, et al. Genomic expression profiling across the pediatric systemic inflammatory response syndrome, sepsis, and septic shock spectrum. Crit Care Med. 2009;37(5):1558–66.
8. R core team. A language and environment for statistical computing.
http://www.r-project.org/. Accessed 26 June 2017.
9. Gentleman RC, Carey VJ, Bates DM, Bolstad B, Dettling M, Dudoit S, et al. Bioconductor: open software development for computational biology and bioinformatics. Genome Biol. 2004;5(10):R80.
10. da Huang W, Sherman BT, Lempicki RA. Systematic and integrative analy-sis of large gene lists using DAVID bioinformatics resources. Nat Protoc. 2009;4(1):44–57.
11. da Huang W, Sherman BT, Lempicki RA. Bioinformatics enrichment tools: paths toward the comprehensive functional analysis of large gene lists. Nucleic Acids Res. 2009;37(1):1–13.
• We accept pre-submission inquiries
• Our selector tool helps you to find the most relevant journal • We provide round the clock customer support
• Convenient online submission • Thorough peer review
• Inclusion in PubMed and all major indexing services • Maximum visibility for your research
Submit your manuscript at www.biomedcentral.com/submit
Submit your next manuscript to BioMed Central
and we will help you at every step:
13. Zhang B, Kirov S, Snoddy J. WebGestalt: an integrated system for exploring gene sets in various biological contexts. Nucleic Acids Res. 2005;33(Web Server issue):W741–8.
14. Gene Expression Omnibus. http://www.ncbi.nlm.nih.gov/geo/. Accessed 26 June 2017.
15. Gautier L, Cope L, Bolstad BM, Irizarry RA. Affy—analysis of Affymetrix GeneChip data at the probe level. Bioinformatics. 2004;20(3):307–15. 16. Langfelder P, Horvath S. WGCNA: an R package for weighted correlation
network analysis. BMC Bioinform. 2008;9:559.
17. Falcon S, Gentleman R. Using GOstats to test gene lists for GO term association. Bioinformatics. 2007;23(2):257–8.
18. Kanehisa M, Goto S. KEGG: kyoto encyclopedia of genes and genomes. Nucleic Acids Res. 2000;28(1):27–30.
19. Robin X, Turck N, Hainard A, Tiberti N, Lisacek F, Sanchez JC, et al. pROC: an open-source package for R and S+ to analyze and compare ROC curves. BMC Bioinform. 2011;12:77.
20. Joly S, Rhea L, Volk P, Moreland JG, Dunnwald M. Interferon regulatory factor 6 has a protective role in the host response to endotoxic shock. PLoS ONE. 2016;11(4):e0152385.
21. Zhang L, Cardinal JS, Pan P, Rosborough BR, Chang Y, Yan W, et al. Spleno-cyte apoptosis and autophagy is mediated by interferon regulatory factor 1 during murine endotoxemia. Shock. 2012;37(5):511–7.
22. Gonda TJ, Ramsay RG. Adenoid cystic carcinoma can be driven by MYB or MYBL1 rearrangements: new insights into MYB and tumor biology. Cancer Discov. 2016;6(2):125–7.
23. Ramkissoon LA, Horowitz PM, Craig JM, Ramkissoon SH, Rich BE, Schu-macher SE, et al. Genomic analysis of diffuse pediatric low-grade gliomas identifies recurrent oncogenic truncating rearrangements in the tran-scription factor MYBL1. Proc Natl Acad Sci USA. 2013;110(20):8188–93. 24. Ibegbu CC, Xu YX, Harris W, Maggio D, Miller JD, Kourtis AP. Expression of killer cell lectin-like receptor G1 on antigen-specific human CD8+ T lymphocytes during active, latent, and resolved infection and its relation with CD57. J Immunol. 2005;174(10):6088–94.
25. Henson SM, Akbar AN. KLRG1–more than a marker for T cell senescence. Age. 2009;31(4):285–91.
26. Voehringer D, Koschella M, Pircher H. Lack of proliferative capacity of human effector and memory T cells expressing killer cell lectinlike recep-tor G1 (KLRG1). Blood. 2002;100(10):3698–702.
27. Li L, Wan S, Tao K, Wang G, Zhao E. KLRG1 restricts memory T cell antitu-mor immunity. Oncotarget. 2016;7(38):61670–8.
28. Snyers L, Umlauf E, Prohaska R. Association of stomatin with lipid-protein complexes in the plasma membrane and the endocytic compartment. Eur J Cell Biol. 1999;78(11):802–12.
29. Salzer U, Prohaska R. Stomatin, flotillin-1, and flotillin-2 are major integral proteins of erythrocyte lipid rafts. Blood. 2001;97(4):1141–3.
30. Mairhofer M, Steiner M, Mosgoeller W, Prohaska R, Salzer U. Stoma-tin is a major lipid-raft component of platelet alpha granules. Blood. 2002;100(3):897–904.
31. Arkhipova KA, Sheyderman AN, Laktionov KK, Mochalnikova VV, Zborovs-kaya IB. Simultaneous expression of flotillin-1, flotillin-2, stomatin and caveolin-1 in non-small cell lung cancer and soft tissue sarcomas. BMC Cancer. 2014;14:100.
32. Chen CY, Yang CY, Chen YC, Shih CW, Lo SS, Lin CH. Decreased expression of stomatin predicts poor prognosis in HER2-positive breast cancer. BMC Cancer. 2016;16:697.
33. Sanyal R, Polyak MJ, Zuccolo J, Puri M, Deng L, Roberts L, et al. MS4A4A: a novel cell surface marker for M2 macrophages and plasma cells. Immunol Cell Biol. 2017. https://doi.org/10.1038/icb.2017.18.
34. Allen M, Zou F, Chai HS, Younkin CS, Crook J, Pankratz VS, et al. Novel late-onset Alzheimer disease loci variants associate with brain gene expression. Neurology. 2012;79(3):221–8.
35. Sweeney TE, Shidham A, Wong HR, Khatri P. A comprehensive time-course-based multicohort analysis of sepsis and sterile inflammation reveals a robust diagnostic gene set. Sci Transl Med. 2015;7(287):287ra71. 36. Maat M, Buysse CM, Emonts M, Spanjaard L, Joosten KF, de Groot R, et al.