RESEARCH
Systematic review of analytical methods
applied to longitudinal studies of malaria
Christopher C. Stanley
1,2, Lawrence N. Kazembe
3, Mavuto Mukaka
4,5, Kennedy N. Otwombe
1,6,
Andrea G. Buchwald
7, Michael G. Hudgens
8, Don P. Mathanga
2, Miriam K. Laufer
7*and Tobias F. Chirwa
1Abstract
Background: Modelling risk of malaria in longitudinal studies is common, because individuals are at risk for repeated infections over time. Malaria infections result in acquired immunity to clinical malaria disease. Prospective cohorts are an ideal design to relate the historical exposure to infection and development of clinical malaria over time, and analysis methods should consider the longitudinal nature of the data. Models must take into account the acquisition of immunity to disease that increases with each infection and the heterogeneous exposure to bites from infected Anopheles mosquitoes. Methods that fail to capture these important factors in malaria risk will not accurately model risk of malaria infection or disease.
Methods: Statistical methods applied to prospective cohort studies of clinical malaria or Plasmodium falciparum infection and disease were reviewed to assess trends in usage of the appropriate statistical methods. The study was designed to test the hypothesis that studies often fail to use appropriate statistical methods but that this would improve with the recent increase in accessibility to and expertise in longitudinal data analysis.
Results: Of 197 articles reviewed, the most commonly reported methods included contingency tables which comprised Pearson Chi-square, Fisher exact and McNemar’s tests (n = 102, 51.8%), Student’s t-tests (n = 82, 41.6%), followed by Cox models (n = 62, 31.5%) and Kaplan–Meier estimators (n = 59, 30.0%). The longitudinal analysis meth-ods generalized estimating equations and mixed-effects models were reported in 41 (20.8%) and 24 (12.2%) articles, respectively, and increased in use over time. A positive trend in choice of more appropriate analytical methods was identified over time.
Conclusions: Despite similar study designs across the reports, the statistical methods varied substantially and often represented overly simplistic models of risk. The results underscore the need for more effort to be channelled towards adopting standardized longitudinal methods to analyse prospective cohort studies of malaria infection and disease. Keywords: Plasmodium falciparum, Longitudinal studies, Longitudinal analysis, Cohort studies
© The Author(s) 2019. This article is distributed under the terms of the Creative Commons Attribution 4.0 International License (http://creat iveco mmons .org/licen ses/by/4.0/), which permits unrestricted use, distribution, and reproduction in any medium, provided you give appropriate credit to the original author(s) and the source, provide a link to the Creative Commons license, and indicate if changes were made. The Creative Commons Public Domain Dedication waiver (http://creat iveco mmons .org/ publi cdoma in/zero/1.0/) applies to the data made available in this article, unless otherwise stated.
Background
Plasmodium falciparum infection is one of the most
common parasitic infection in humans. Individuals in high-transmission settings are exposed to bites of infected Anopheles mosquitoes and develop frequent infections. In early childhood, infections are almost always associated with symptomatic disease [1]. Over
time, individuals acquire immunity to clinical disease and, to some degree, infection [2, 3]. Thus, each infec-tion alters the host immune response that protects against the next episode. In addition, risk of exposure to infected bites is not uniformly distributed [4, 5]. Thus, risk of infection is not equally distributed across popu-lations. While one infection may decrease the risk of disease or infection, an infection in an individual is also an indicator of more frequent exposure to infected mos-quitoes. This provides an interesting challenge to model-ling the risk of malaria disease and infection over time. Longitudinal cohorts, unlike other study designs such as
Open Access
*Correspondence: [email protected]
7 Center for Vaccine Development and Global Health, University
of Maryland School of Medicine, 685 W. Baltimore St. HSF-1 Room 480, Baltimore, MD 21201, USA
cross-sectional surveys, can differentiate between infec-tions that appear asymptomatic at time of detection but may become symptomatic over time. With efforts inten-sified to prevent Plasmodium infection and reduce clini-cal malaria disease, prospective longitudinal cohorts are increasingly being conducted to assess risk of infection and disease over time.
Well-designed prospective longitudinal cohort studies can be key to understanding risk of malaria disease for participants over time, but appropriate analysis of the collected data is also critical for accurate results. Like any longitudinal designs, malaria cohorts are character-ized by repeated measurements, resulting in possible correlated infection and disease episode data from same participant. The underlying assumption of no correla-tion among observacorrela-tions made by standard statistical methods such as t-tests, analyses of variance (ANOVA), and linear regression are violated [6–8]. The use of inappropriate methods, particularly those that do not account for possible correlation of events when dealing with repeated episodes of malaria or infection, can lead to biased results. Ignoring correlation of events could result in the confidence intervals for the estimated rates being artificially narrow and the null hypothesis may be rejected more often than warranted [9, 10]. Appropriate longitudinal data analysis techniques should account for such possible within-participant correlation and differ-ent covariance structures of episodes of malaria or infec-tion measurements over time. These include generalized estimating equations (GEE) and mixed-effects models. The superiority in consistency and efficiency of these methods over the traditional methods, such as ANOVA, t-tests and simple linear regression were demonstrated previously [11–14]. One of the attractive features of GEE is that the method is robust to mis-specification of the correlation structure, such that the estimator is con-sistent even if the working correlation structure is mis-specified [15], although it can be inefficient under the mis-specified working correlation structure [16]. When the research interest is on repeated time-to-episodes of disease or infection, it is common to analyse time-to-first episode ignoring the subsequent events, but this approach fails to utilize all information available in the data [13, 17–19]. Analyses of time-to-first event only may be preferred in some situations. For example, when the intention is to evaluate interventions or prognostic factors (e.g., some vaccines) as ‘all-or-nothing’ determi-nants of malaria risk, so occurrence of any events is con-sidered a failure. Another scenario would be when the first event is considered to have ‘reset’ the host such that subsequent events may then be consequently considered in a different category. Recurrent time-to-event models are the appropriate techniques for analysing recurrent
malaria episode data because they take into account the within-participant non-independence of episodes. These techniques include frailty models [20, 21] or recurrent Cox-extended models, such as the Andersen–Gill and Prentice–Williams–Peterson models [17].
The statistical models that incorporate all the repeated observations over follow-up are particularly important in malaria since over time, malaria infections result in individuals acquiring immunity to malaria disease. Each infection may introduces protective effect to future dis-ease episodes. Therefore, appropriate analytical methods for repeated episodes of disease and infection should capture the impact of the developed protective immunity.
Recent advancements in statistical methods and computer software have improved the ease of access and application of statistical methods specifically designed for longitudinal studies, allowing one to handle complexity with cohort data [9, 22–25]. Limited information is available about whether the recent developments in computer software and statisti-cal methods for longitudinal data has translated into more wide adoption and application of appropriate methods when analysing prospective longitudinal malaria cohort data. This study tested the hypotheses that choice of statisti-cal methods would change over time and that these changes would reflect more appropriate analytical methods. To address this hypothesis, a systematic review was conducted to investigate the trends of use of appropriate statistical methods among articles analysing prospective longitudinal cohort data for clinical malaria episodes or Plasmodium
infection published over a 22-year period.
Methods Search strategy
Titles and abstracts containing the terms “malaria pro-spective study” or “malaria cohort study” or “malaria lon-gitudinal study” or “malaria years follow-up” or “malaria repeated measurements” indexed in PubMed, Medline or ScienceDirect were included in the search. Original arti-cles in English, which was a familiar language to authors, published from 1996 until December 2017 were reviewed in chronological order.
Inclusion and exclusion criteria
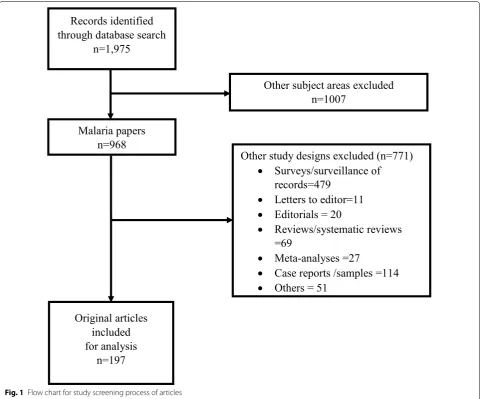
systematic reviews, meta-analyses, repeated cross-sectional surveys, case reports and articles written in languages other than English were excluded. Detailed selection process of the studies under review is shown in Fig. 1.
Data extraction
For each article included in the analysis, the following information was extracted: year of publication, duration of follow-up, outcomes, sample size, population, location and type of statistical methods used. Statistical methods were grouped according to categorization by Colditz and Emerson [26, 27] as presented in Appendix. In the cases where researchers studied multiple outcomes, only meth-ods applied to the outcomes of interest-clinical malaria or infection—were considered. Particular interest was on standard longitudinal analysis techniques includ-ing GEE, mixed-effects models (random effects models) and repeated measures ANOVA which are considered
appropriate for analyses of repeatedly measured data such as repeated episodes malaria disease or infection. For repeated time-to-episodes, recurrent Cox-based models and frailty models are considered appropriate, while other survival methods such as the Kaplan–Meier estimator, log-rank test and Cox model are only appro-priate for analyses of time-to-single-episode.
Statistical analysis
Logistic GEE was used to estimate the odds of using the types of statistical methods in the 2007–2017 period compared to 1996–2006 period. Each model adjusted for study sample size and year of publication was included as a panel variable. The outcome variable was binary, indi-cating whether in each article a particular method was used or not. Models were constructed for each of the fol-lowing methods: contingency tables, descriptive statis-tics only, Kaplan–Meier estimator, Cox model, Poisson
[image:3.595.58.542.323.722.2]model, GEE and mixed-effects model. All analyses were done using Stata SE version 15.1 (Stata Corp, College Sta-tion, TX, USA).
Results
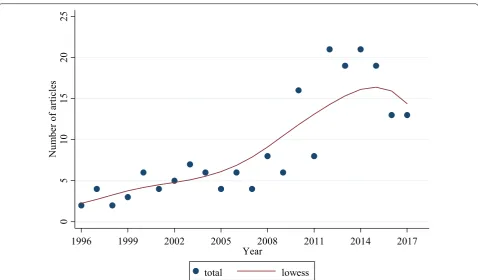
Out of the 1975 abstracts reviewed, 1778 were excluded because they were of other subject areas (n = 1007, 51.0%) and study designs (n = 771, 39.0%). One-hundred and ninety-seven (10.0%) articles met the inclusion cri-teria and were included in the analyses (Fig. 1). Overall, the median follow-up time was 12 months [interquartile range (IQR): 9–24]. The median sample size per article was 351 (IQR: 206–700). The number of articles increased over the 22-year study period, with the highest number found between 2012 and 2016 (Fig. 2). Overall, there were 128 (65.0%) articles that analysed both clinical malaria episodes and infection as outcomes; 53 (26.9%) assessed clinical malaria episodes only, and 16 (8.1%) infections only. A table listing articles reviewed in this study with details of year of publication, duration of follow-up, out-comes, sample size, population, location, and analysis methods are provided as Additional file 1: Table S1.
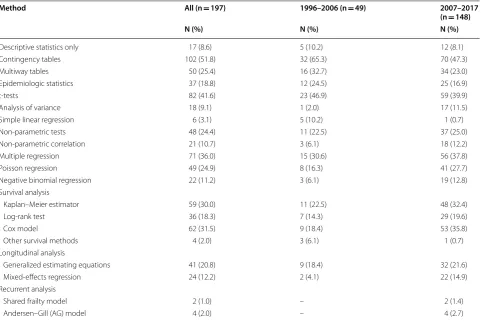
Among 197 articles reviewed, the most commonly reported methods included contingency tables compris-ing Pearson Chi-square, Fisher exact and McNemar’s
tests (n = 102, 51.8%), followed by Student’s t-tests (n = 82, 41.6%), multiple linear regression (n = 71, 36.0%), Cox models (n = 62, 31.5%), and Kaplan–Meier estima-tors (n = 59, 30.0%) (Table 1). The frequency of usage of different statistical methods changed between the two study periods: 1996–2006 versus 2007–2017. The pro-portion of articles using contingency tables was higher in the first period than in the second, 65.3 versus 47.3% as was simple linear regression, 10.2 versus 0.7%. Use of the survival analysis methods, Cox models and Kaplan– Meier estimators increased in the second period from 18.4 to 35.8% and 22.5 to 32.4%, respectively. Similarly, usage of mixed-effects models among longitudinal data analysis techniques was higher in the later period com-pared to the former, 4.1 versus 14.9%.
From the 197 articles included in the review, 131 (66.5%) analysed repeated malaria episodes or infection, of which 60 (45.8%) used appropriate standard longitudi-nal alongitudi-nalysis methods. Appropriate longitudilongitudi-nal alongitudi-nalyses included 36 (60.0%) instances of GEE, 19 (31.7%) articles employing mixed-effects models, and 5 (8.3%) articles utilizing both the GEE and mixed-effects models. Sev-enty-one (54.2%) of the 131 articles used other methods, namely the Poisson (n = 49) and negative binomial regres-sion models (n = 22). These models were based on the
0
5
10
15
20
25
N
um
be
ro
fa
rti
cl
es
1996 1999 2002 2005 2008 2011 2014 2017
Year
total lowess
[image:4.595.59.538.417.697.2]generalized linear modelling. Of the 41 studies that mod-elled the correlation structure, only 5 (12.2%) assumed exchangeable correlation, while 36 (87.8%) did not specify the correlation structure. Out of all 197 articles reviewed, there were 99 (50.3%) studies that assumed Poisson dis-tribution, 4 of these assessed overdispersion, of which 2 adjusted for it. In 9 (4.7%) of all the 197 reviewed stud-ies, authors assumed a normal distribution of count data without indicating if transformations were done.
There were 74 of 197 articles that analysed time-to-first malaria episode or infection ignoring subsequent events and 61 (82.4%) of these employed survival analysis tech-niques that included Cox models, Kaplan–Meier estima-tors, and log-rank tests. There were 24 (12.2%) of 197 articles that analysed repeated time-to-episodes and only 6 (25.0%) of these used appropriate recurrent event mod-els with extensions of Cox model, namely Andersen–Gill (n = 4) and frailty models (n = 2) to evaluate risk factors for recurrent clinical malaria. Eighteen (9.1%) articles analysed repeated time-to-malaria or infection episodes using Cox models and Kaplan–Meier estimators which are only valid for single-event analyses because they assume independence of events.
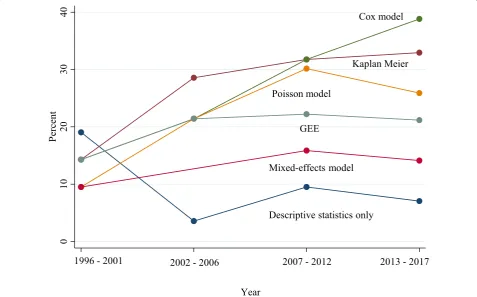
Compared to the first period 1996–2006, the odds of an article using contingency tables adjusting for sample size were lower in the second period 2007–2017 [odds ratio (OR) = 0.49, 95% confidence interval (CI) 0.27–0.91] (Table 2). The proportion of articles using Cox els, Kaplan–Meier estimators and mixed-effects mod-els increased over time (Fig. 3). However, only the Cox models, and mixed-effects models had increased odds of being used in the second period compared to the first period, (OR = 2.57, 95% CI 1.21–5.42) and (OR = 3.85, 95% CI 1.13–6.39), respectively (Table 2).
Discussion
In this review of statistical methods among articles ana-lysing prospective longitudinal cohort data for clinical malaria episodes or Plasmodium infection published over a 22-year period, the statistical methods substantially varied across articles despite that they reported analysis of the same general study design and outcome measure-ments. The most commonly used models for analysing count number of malaria episodes included the Poisson and negative binomial models, but these fall short with repeated measurements data as they cannot account for Table 1 Frequency of articles using a particular statistical method
Method All (n = 197) 1996–2006 (n = 49) 2007–2017
(n = 148)
N (%) N (%) N (%)
Descriptive statistics only 17 (8.6) 5 (10.2) 12 (8.1)
Contingency tables 102 (51.8) 32 (65.3) 70 (47.3)
Multiway tables 50 (25.4) 16 (32.7) 34 (23.0)
Epidemiologic statistics 37 (18.8) 12 (24.5) 25 (16.9)
t-tests 82 (41.6) 23 (46.9) 59 (39.9)
Analysis of variance 18 (9.1) 1 (2.0) 17 (11.5)
Simple linear regression 6 (3.1) 5 (10.2) 1 (0.7)
Non-parametric tests 48 (24.4) 11 (22.5) 37 (25.0)
Non-parametric correlation 21 (10.7) 3 (6.1) 18 (12.2)
Multiple regression 71 (36.0) 15 (30.6) 56 (37.8)
Poisson regression 49 (24.9) 8 (16.3) 41 (27.7)
Negative binomial regression 22 (11.2) 3 (6.1) 19 (12.8)
Survival analysis
Kaplan–Meier estimator 59 (30.0) 11 (22.5) 48 (32.4)
Log-rank test 36 (18.3) 7 (14.3) 29 (19.6)
Cox model 62 (31.5) 9 (18.4) 53 (35.8)
Other survival methods 4 (2.0) 3 (6.1) 1 (0.7)
Longitudinal analysis
Generalized estimating equations 41 (20.8) 9 (18.4) 32 (21.6)
Mixed-effects regression 24 (12.2) 2 (4.1) 22 (14.9)
Recurrent analysis
Shared frailty model 2 (1.0) – 2 (1.4)
[image:5.595.58.544.101.422.2]within-participant correlation of the episodes [6, 28, 29]. Ignoring this possible correlation of events tends to bias the model results as demonstrated previously [15, 30– 32], yielding regression parameters with underestimated standards errors for time-dependent covariates or over-estimated errors in time-dependent covariates [33]. As hypothesized, trends in choice of appropriate methods improved over time, which included the GEE and mixed-effects models as well as recurrent event models, although their usage during the entire study period remained
low. Furthermore, the majority of the studies that mod-elled the correlation structure did not specify the kind of assumed correlation structure, with only exchangeable correlation structure stated in few studies. Among studies that assumed Poisson distribution, the majority of them did not state whether or not overdispersion was checked.
Some articles analysed the repeated time-to-disease episodes or infections but applied the Cox model [34] or the Kaplan–Meier estimator, which assume independent events and are only valid for modelling the time-to-single disease episode or infection. Such analyses may yield biased results. This is particularly true in malaria because over time, individuals acquire immunity to clinical disease and, to some degree, infection. Therefore, each infection may be dependent on the past, and in turn alter the host immune response that protects against the next episode. Addition-ally, there may be temporal variations in exposure which can alter the risk of clinical malaria disease over time. In some instances, data from the later episodes were discarded leading to loss of information which may limit the resulting conclusions. Modelling that focuses on time-to-first event only may not be generalizable to analyses examining all repeated episodes of disease or infection over entire study period because the risk to subsequent episodes diminishes as a result of the gained immunity over time.
Table 2 Odds ratio of using a statistical method
during 2007–2017 compared to 1996–2006 adjusted for article sample size
CI confidence interval
Method Odds ratio (OR) 95% CI
Descriptive statistics only 0.81 0.26–2.42
Contingency table 0.49 0.27–0.91
Kaplan–Meier estimator 1.80 0.88–3.67
Cox model 2.57 1.21–5.42
Log-rank 1.60 0.66–3.84
Poisson model 1.78 0.85–3.72
GEE 1.16 0.56–2.39
Mixed-effects model 3.85 1.13–6.39
0
10
20
30
40
Pe
rce
nt
1996 - 2001 2002 - 2006 2007 - 2012 2013 - 2017
Year
Descriptive statistics only Mixed-effects model
GEE Poisson model
Kaplan Meier Cox model
[image:6.595.57.291.126.243.2] [image:6.595.59.537.399.696.2]When analysing repeated times-to-episodes malaria or infection, analytical methods should account for possible within-participant correlation of events as well as censoring over follow-up. Such appropriate methods include recur-rent event survival models [35, 36]. In the current review, only six articles analysed repeated time-to-episodes using appropriate recurrent models. Well-developed descrip-tions of the recurrent event models have been presented by several authors [10, 17, 35, 36] while this section briefly discusses these models in relation to malaria data. The recurrent event models include extensions of the Cox model such as Andersen–Gill (AG) [37], Prentice–Williams–Peter-son (PWP) [38] and the frailty model [39]. The AG model uses a counting process time-scale for all episodes assum-ing that the correlation between episodes-times for each participant is explained by previous episodes where time-scale does not reset to zero after an episode. This model is typically applicable when the interest is on the overall effect of covariates on the intensity of the recurrent episodes. The PWP model analyses ordered events by stratification and can be expressed as gap-time model where the time-scale is reset to zero after each episode occurs. Gap times between malaria parasitaemia detection to clearance is a good exam-ple where the PWP model can be valid. Moreover, the PWP model can give both overall and episode-specific effects and so can be more applicable in malaria where covariate effects may be different in subsequent episodes due to the naturally acquired immunity. The shared frailty model extends the Cox model by introducing a random covariate that induces dependence among the recurrent episode times. By condi-tioning on covariates and the random effect, the recurrent episodes are assumed to become independent. Another challenge when analysing recurrent events in malaria is the issue of exclusion of periods-at-risk after an event, and this may constrain the choice of statistical methods. Depend-ing on kind of treatment if any, recurrent events within a few days of each other are likely to be the result of the same infection or the second event may be considered to be due to treatment failure. Ignoring periods-at-risk after an event is also a potential source of bias. Thus, authors ought to con-sider exclusion of periods-at-risk after an event during the datasets structuring before analyses are conducted.
This review has demonstrated that publications on pro-spective longitudinal malaria cohorts are increasing over time, a trend reflecting the growing understanding of the importance of longitudinal cohort data coupled with advancements in computer software developments for ana-lysing such data [9, 22]. Optimal methods for longitudinal data analysis were in their infancy 20 years ago and both access to appropriate software and general acceptable of these methods by the research community have increased dramatically over this period. The increased trend in malaria cohort studies and the improved but slow adoption
of appropriate methods underscores the need for standard-ized analytical methods for such data to avoid drawing erro-neous conclusions based on inaccurate results.
This review may have included more than one report using the same data, which may have introduced bias due to duplication of datasets. For example, the same data may have been analysed using inappropriate methods in first instance and then using appropriate techniques. Fur-thermore, some authors published more than one article and such articles may share similarities in the choice of analytical methods, but accounting for this was beyond the scope of this review as author background informa-tion was not collected. Future studies should consider testing whether more appropriate statistical methods improve or change understanding of malaria epidemiol-ogy by using among other factors, authors’ background information. Lastly, further studies may explore and compare how results from this study would compare with trends specifically from field trials.
Conclusions
Cohort studies assessing risk of malaria infection and disease over time did not employ consistent analytic methods. The statistical methods varied substantially and often represented overly simplistic models despite similar designs, which may have led to biased outcomes and results that cannot be compared across studies. This review suggests that recent studies are adopting more appropriate statistical methods, though the sta-tistical analyses are not uniform. These results under-score the need for more effort to be channelled towards adopting standardized longitudinal methods to model recurrent events for malaria infection and disease.
Additional file
Additional file 1: Table S1. List of reviewed articles in the study with details of year of publication, duration of follow-up, outcomes, sample size, population, location and analysis methods.
Abbreviations
AIDS: acquired immune deficiency syndrome; ANOVA: analysis of variance; GEE: generalised estimating equations; HIV: human immunodeficiency virus; PCR: polymerase chain reaction; RDT: rapid diagnostic test.
Acknowledgements
Not applicable.
Authors’ contributions
Funding
This work was supported by the Fogarty International Center of the National Institutes of Health [Grant number D43TW010075]; and The Wellcome Trust [Grant number 107754/Z/15/Z]; National Institute of Allergy and Infectious Diseases [Grant number K24AI114996]. Funders have no role in the design of the study and collection, analysis, and interpretation of data and in writing the manuscript.
Availability of data and materials
All data generated and analysed during this study are included in additional files of this published article
Ethics approval and consent to participate
Not applicable.
Consent for publication
All authors reviewed and approved this manuscript for publication.
Competing interests
The authors declare that they have no competing interests.
Author details
1 School of Public Health, Faculty of Health Sciences, University of the
Wit-watersrand, Johannesburg, South Africa. 2 Malaria Alert Centre, University
of Malawi College of Medicine, Blantyre, Malawi. 3 Department of Statistics,
University of Namibia, Windhoek, Namibia. 4 Oxford Centre for Tropical
Medicine and Global Health, Oxford, UK. 5 Mahidol-Oxford Tropical
Medi-cine Research Unit, Bangkok, Thailand. 6 Perinatal HIV Research Unit, Faculty
of Health Sciences, University of the Witwatersrand, Johannesburg, South Africa. 7 Center for Vaccine Development and Global Health, University of
Mar-yland School of Medicine, 685 W. Baltimore St. HSF-1 Room 480, Baltimore, MD 21201, USA. 8 Department of Biostatistics, Center for AIDS Research, University
of North Carolina Chapel Hill, Chapel Hill, NC, USA.
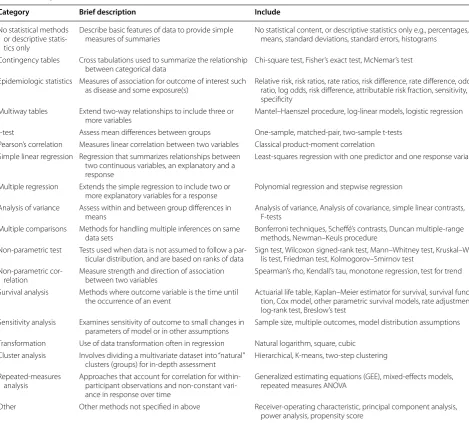
Appendix
See Table 3.
Table 3 Categories of statistical methods used to assess the statistical content of articles
Category Brief description Include
No statistical methods or descriptive statis-tics only
Describe basic features of data to provide simple
measures of summaries No statistical content, or descriptive statistics only e.g., percentages, means, standard deviations, standard errors, histograms
Contingency tables Cross tabulations used to summarize the relationship
between categorical data Chi-square test, Fisher’s exact test, McNemar’s test Epidemiologic statistics Measures of association for outcome of interest such
as disease and some exposure(s) Relative risk, risk ratios, rate ratios, risk difference, rate difference, odds ratio, log odds, risk difference, attributable risk fraction, sensitivity, specificity
Multiway tables Extend two-way relationships to include three or
more variables Mantel–Haenszel procedure, log-linear models, logistic regression t-test Assess mean differences between groups One-sample, matched-pair, two-sample t-tests
Pearson’s correlation Measures linear correlation between two variables Classical product-moment correlation Simple linear regression Regression that summarizes relationships between
two continuous variables, an explanatory and a response
Least-squares regression with one predictor and one response variable
Multiple regression Extends the simple regression to include two or
more explanatory variables for a response Polynomial regression and stepwise regression Analysis of variance Assess within and between group differences in
means Analysis of variance, Analysis of covariance, simple linear contrasts, F-tests Multiple comparisons Methods for handling multiple inferences on same
data sets Bonferroni techniques, Scheffé’s contrasts, Duncan multiple-range methods, Newman–Keuls procedure Non-parametric test Tests used when data is not assumed to follow a
par-ticular distribution, and are based on ranks of data Sign test, Wilcoxon signed-rank test, Mann–Whitney test, Kruskal–Wal-lis test, Friedman test, Kolmogorov–Smirnov test Non-parametric
cor-relation Measure strength and direction of association between two variables Spearman’s rho, Kendall’s tau, monotone regression, test for trend Survival analysis Methods where outcome variable is the time until
the occurrence of an event Actuarial life table, Kaplan–Meier estimator for survival, survival func-tion, Cox model, other parametric survival models, rate adjustment, log-rank test, Breslow’s test
Sensitivity analysis Examines sensitivity of outcome to small changes in
parameters of model or in other assumptions Sample size, multiple outcomes, model distribution assumptions Transformation Use of data transformation often in regression Natural logarithm, square, cubic
Cluster analysis Involves dividing a multivariate dataset into “natural”
clusters (groups) for in-depth assessment Hierarchical, K-means, two-step clustering Repeated-measures
analysis Approaches that account for correlation for within-participant observations and non-constant vari-ance in response over time
Generalized estimating equations (GEE), mixed-effects models, repeated measures ANOVA
[image:8.595.59.529.300.723.2]•fast, convenient online submission
•
thorough peer review by experienced researchers in your field
• rapid publication on acceptance
• support for research data, including large and complex data types
•
gold Open Access which fosters wider collaboration and increased citations maximum visibility for your research: over 100M website views per year
•
At BMC, research is always in progress.
Learn more biomedcentral.com/submissions
Ready to submit your research? Choose BMC and benefit from:
Received: 18 April 2019 Accepted: 19 July 2019
References
1. Aponte JJ, Menendez C, Schellenberg D, Kahigwa E, Mshinda H, Voun-tasou P, et al. Age interactions in the development of naturally acquired immunity to Plasmodium falciparum and its clinical presentation. PLoS Med. 2007;4:e242.
2. Doolan DL, Dobaño C, Baird JK. Acquired immunity to malaria. Clin Micro-biol Rev. 2009;22:13–36.
3. Biswas S, Seth RK, Tyagi PK, Sharma SK, Dash AP. Naturally acquired immu-nity and reduced susceptibility to falciparum malaria in two subpopula-tions of endemic Eastern India. Scand J Immunol. 2008;67:177–84. 4. Milali MP, Sikulu-Lord MT, Govella NJ. Bites before and after bedtime can
carry a high risk of human malaria infection. Malar J. 2017;16:91. 5. Rossati A, Bargiacchi O, Kroumova V, Zaramella M, Caputo A, Garavelli
PL. Climate, environment and transmission of malaria. Infez Med. 2016;24:93–104.
6. Liang K, Zeger SL. Longitudinal data analysis using generalized linear models. Biometrika. 1986;73:13–22.
7. Lin DY. Cox regression analysis of multivariate failure time data: the mar-ginal approach. Stat Med. 1994;13:2233–47.
8. Crowder M. On the use of a working correlation matrix in using general-ised linear models for repeated measures. Biometrika. 1995;82:407. 9. Gibbons RD, Hedeker D, DuToit S. Advances in analysis of longitudinal
data. Annu Rev Clin. 2010;6:79–107.
10. Amorim LDAF, Cai J. Modelling recurrent events: a tutorial for analysis in epidemiology. Int J Epidemiol. 2015;44:324–33.
11. Burton P, Gurrin L, Sly P, Gurrin L. Extending the simple linear regression model to account for correlated responses: an introduction to general-ized estimating equations and multi-level mixed modelling. Stat Med. 1998;17:1261–91.
12. Zeger S, Liang K-Y. Longitudinal data analysis for discrete and continuous outcomes. Biometrics. 1986;42:121–30.
13. Ballinger GA. Using generalized estimating equations for longitudinal data analysis. Organ Res Methods. 2004;7:127–50.
14. Hu XJ. Applied longitudinal data analysis for epidemiology: a practical guide. J Am Stat Assoc. 2004;99:1207–8.
15. Hubbard AE, Ahern J, Fleischer NL, Van Der Laan M, Lippman SA, Jewell N, et al. To GEE or not to GEE: comparing population average and mixed models for estimating the associations between neighborhood risk fac-tors and health. Epidemiology. 2010;21:467–74.
16. Qu A. Improving generalised estimating equations using quadratic infer-ence functions. Biometrika. 2000;87:823–36.
17. Sagara I, Giorgi R, Doumbo OK, Piarroux R, Gaudart J. Modelling recurrent events: comparison of statistical models with continuous and discontinu-ous risk intervals on recurrent malaria episodes data. Malar J. 2014;13:293. 18. Shen CW, Chen YH. Model selection for generalized estimating equations
accommodating dropout missingness. Biometrics. 2012;68:1046–54.
19. Heagerty PJ. Marginalized transition models and likelihood inference for longitudinal categorical data. Biometrics. 2002;58:342–51.
20. Hougaard P. Frailty models for survival data. Lifetime Data Anal. 1995;1:255–73.
21. Box-Steffensmeier JM, De Boef S. Repeated events survival models: the conditional frailty model. Stat Med. 2006;25:3518–33.
22. Wang M. Generalized estimating equations in longitudinal data analysis: a review and recent developments. Adv Stat. 2014. https ://doi.
org/10.1155/2014/30372 8.
23. Halekoh U, Højsgaard S, Yan J. The R Package geepack for generalized estimating equations. J Stat Softw. 2006;15:1–11.
24. Bernal-Rusiel JL, Greve DN, Reuter M, Fischl B, Sabuncu MR. Statistical analysis of longitudinal neuroimage data with linear mixed effects mod-els. Neuroimage. 2013;66:249–60.
25. StataCorp. Stata Statistical Software: Release 15. College Station: Stata-Corp LP; 2017.
26. Emerson JD, Colditz GA. Use of statistical analysis in the New England Journal of Medicine. N Engl J Med. 1983;309:709–13.
27. Colditz GA, Emerson JD. The statistical content of published medi-cal research: some implications for biomedimedi-cal education. Med Educ. 1985;19:248–55.
28. Bates DM. Models for longitudinal data. lme4 mix model with R. 2010:63–82.
29. Chan D. Data analysis and modeling longitudinal processes. Gr Organ Manag. 2003;28:341–65.
30. Gardiner JC, Luo Z, Roman LA. Fixed effects, random effects and GEE: what are the differences? Stat Med. 2009;28:221–39.
31. Pardo MC, Alonso R. GEEs for repeated categorical responses based on generalized residuals. J Stat Comput Simul. 2014;84:344–59.
32. Laird NM, Ware JH. Random-effects models for longitudinal data. Biomet-rics. 1982;38:963–74.
33. Bolker BM, Brooks ME, Clark CJ, Geange SW, Poulsen JR, Stevens MHH, et al. Generalized linear mixed models: a practical guide for ecology and evolution. Trends Ecol Evol. 2009;24:127–35.
34. Cox D. Regression models and life tables. J R Stat Soc B. 1972;34:182–220. 35. Clayton D. Some approaches to the analysis of recurrent event data. Stat
Methods Med Res. 1994;3:244–62.
36. Kelly PJ, Lim LLY. Survival analysis for recurrent event data: an application to childhood infectious diseases. Stat Med. 2000;19:13–33.
37. Andersen PK, Gill RD. Cox’s regression model for counting processes: a large sample study. Ann Stat. 1982;10:1100–20.
38. Prentice RL, Williams BJ, Peterson AV. On the regression analysis of multi-variate failure time data. Biometrika. 1981;68:373–9.
39. Therneau TM, Grambsch PM. Modeling survival data: extending the Cox model. Statistics for biology and health. 2nd ed. New York: Springer; 2000.
Publisher’s Note