HIGHLIGHTED ARTICLE
| INVESTIGATION
Powerful Genetic Association Analysis for Common or
Rare Variants with High-Dimensional Structured Traits
Xiang Zhan,* Ni Zhao,†Anna Plantinga,‡Timothy A. Thornton,‡Karen N. Conneely,§Michael P. Epstein,§
and Michael C. Wu*,1
*Public Health Sciences Division, Fred Hutchinson Cancer Research Center, Seattle, Washington 98109,†Department of Biostatistics, Bloomberg School of Public Health, Johns Hopkins University, Baltimore, Maryland 21205,‡Department of Biostatistics, University of Washington, Seattle, Washington 98195, and§Department of Human Genetics, Emory University, Atlanta, Georgia 30322
ABSTRACTMany genetic association studies collect a wide range of complex traits. As these traits may be correlated and share a common genetic mechanism, joint analysis can be statistically more powerful and biologically more meaningful. However, most existing tests for multiple traits cannot be used for high-dimensional and possibly structured traits, such as network-structured transcriptomic pathway expressions. To overcome potential limitations, in this article we propose the dual kernel-based association test (DKAT) for testing the association between multiple traits and multiple genetic variants, both common and rare. In DKAT, two individual kernels are used to describe the phenotypic and genotypic similarity, respectively, between pairwise subjects. Using kernels allows for capturing structure while accommodating dimensionality. Then, the association between traits and genetic variants is summarized by a coefficient which measures the association between two kernel matrices. Finally, DKAT evaluates the hypothesis of nonassociation with an analyticalP-value calcu-lation without any computationally expensive resampling procedures. By collapsing information in both traits and genetic variants using kernels, the proposed DKAT is shown to have a correct type-I error rate and higher power than other existing methods in both simulation studies and application to a study of genetic regulation of pathway gene expressions.
KEYWORDSdual kernels; genetic association analysis; high-dimensional traits; network structure; pleiotropy
L
ARGE-SCALE, genome-wide association studies and next generation sequencing association studies have resulted in the identification of a wide range of genetic variants, common and rare, related to a host of complex traits and disorders (McCarthyet al.2008; Welteret al.2014). Traditional genetic association analyses have focused on identifying associations between individual genetic variants or groups of genetic vari-ants with a single trait of interest. However, this approach proves inadequate when a single variable does not fully capture the trait or phenotype of interest and further may result in power loss. In many situations, joint analysis of multiple traits, simultaneously, may prove advantageous as compared to single trait analysis for a number of reasons. First, joint analysis tendsto be statistically more powerful than individual trait analysis, especially when many of the traits are correlated and each trait has only modest association with genotypes. Joint analysis can exploit the correlation structure by borrowing information across multiple traits and amplifying the modest marginal as-sociation signals (Kleiet al.2008; Aschardet al.2014). Second, joint analysis facilitates the elucidation of shared genetic mech-anisms and pleiotropic relationships, thus serving as an appro-priate means for improving biological understanding (Chesler
et al. 2005; Andreassenet al.2015). Finally, many traits are inherently multi-phenotypic. For example, metabolic syndrome, which increases risk for heart disease, diabetes, and stroke, is defined based on the presence of three out offive conditions (Albertiet al.2005); information can be gained by using allfive conditions as trait measures rather than considering only the formal diagnosis of metabolic syndrome.
Awide range of statistical and computational methods have been developed for analyzing multiple phenotypes. Broadly speaking, these methods fall into three main categories. The
first category is based on directly integrating univariate re-sults from analyzing each trait separately (Yanget al.2010;
Copyright © 2017 by the Genetics Society of America doi:https://doi.org/10.1534/genetics.116.199646
Manuscript received December 29, 2016; accepted for publication June 15, 2017; published Early Online June 22, 2017.
Supplemental material is available online atwww.genetics.org/lookup/suppl/doi:10. 1534/genetics.116.199646/-/DC1.
van der Sluiset al.2013). Generally these methods can handle at most a moderate number of traits (e.g.,,20 traits) and do not directly harness correlation and relationships among the traits. The second category of methods is based on apply-ing classical dimension-reduction methods, e.g., principal component analysis (Kleiet al.2008) and canonical correla-tion analysis (Ferreira and Purcell 2009), to collapse multiple traits into a single score. However, results based on dimension-reduction methods are difficult to interpret and lose power when the weights for collapsing the multiple traits are imperfect (Aschard et al. 2014). The final category is the broadest and is based on multivariate-regression meth-ods, which often assume a parametric model for the relation-ships between multiple traits and a single SNP (O’Reillyet al.
2012; Zhou and Stephens 2014; Wu and Pankow 2015; Joo
et al.2016; Rayet al.2016; Schaidet al.2016). The specific modeling strategies underlying each approach vary with some approaches using classical mixed models and others using alternative strategies,e.g., MultiPhen (O’Reillyet al.
2012), which uses ordinal regression to regress a SNP on multiple traits. These methods often suffer when underlying parametric assumptions are violated. Many of these methods have been extended to accommodate multiple SNPs and multiple traits (Maity et al. 2012; Hua and Ghosh 2015; Broadaway et al. 2016; Kim et al. 2016; Wu and Pankow 2016), with the understanding that the multi-SNP analysis can oftentimes improve power for the same reasons that multi-trait analysis can improve power.
There are considerable and increasing interests in high-dimensional structured phenotypes, such as imaging traits or other omics data, as they are often inherently interesting and also can serve as intermediate traits, which help in elucidating the underlying molecular mechanisms while being more di-rectly related to etiology. However, despite interest, pheno-types such as imaging outcomes (Zhanget al.2014) and other sources of omics data such as gene expression, metabolomics intensity (Zhanet al.2015b), and microbiome composition (Zhaoet al. 2015), continue to pose grand challenges. Be-yond the intrinsic high dimensionality and scale of the data, such phenotypes are often statistically complex in that they have underlying structure that needs to be accommodated. Examples of structures include network/pathway relation-ships in metabolomic data and gene expression data, and phylogenetic relationships in microbiome data. Most existing multivariate-trait-association methods do not generally ac-commodate high-dimensional structured phenotypes. Meth-ods based on univariate analysis and collapsing rapidly lose power as dimensionality increases (Yanget al.2010; van der Sluiset al.2013), since they typically suffer from power loss due to a heavy multiple-testing burden, which comes with the high-dimensional traits. Dimension reduction-based as-sociation analysis usually considers surrogate outcomes (e.g., principal components), which breaks down the inherent structures in the original phenotypes. More complicated multivariate-regression modeling strategies often become un-stable or computationally intractable when dimensionality of
traits increases (Maity et al. 2012; Wu and Pankow 2016). None of the methods directly consider the issue of incorporat-ing high-dimensional structured traits, which leads to poten-tial power loss of detecting existing associations (Freytaget al.
2014). Thus, new methods are necessary.
A powerful approach in genetic association analysis is the kernel machine regression (KMR) framework, which has proven to be a useful tool for association studies with both common and rare variants (Kweeet al.2008; Wuet al.2010, 2011; Ionita-Laza et al.2013; Zhan et al. 2016). Under the original KMR framework, a single phenotype is modeled to be related to a group of genetic variants. The relationship is cap-tured by way of a kernel function which measures similarity among the risky variants. Then testing proceeds by comparing pairwise similarity in genetic variant profiles between subjects (measured by the kernel matrix) to pairwise similarity in phe-notypes (measured by the cross-product matrix of traits), with correspondence in similarity indicative of association. By in-telligently choosing kernels, structure in the genetic variants can be directly accommodated (Schaid 2010a,b) while dealing with high dimensionality.
Motivated by these kernel-based genetic association tests, we propose the dual kernel-based association test (DKAT) which is designed to assess the association between high-dimensional, possibly structured, phenotypes of interest with multiple genetic variants, though the approach trivially ap-plies to single genetic variant analysis as well. The idea of DKAT is that we propose to use not only a kernel for the genetic variants but also a kernel for the high-dimensional and struc-tured traits. In other words, we replace the cross-product matrix for traits in the existing KMR framework with a kernel matrix to better capture the high dimensionality as well the structure of the traits. To associate the traits (now embedded within a kernel) and a group of genetic variants, we again compare similarity in genetic variant profiles to similarity in phenotypic profiles. In particular, the normalized Frobenius inner product between two kernel matrices is used as the statistic to summarize the genotype–phenotype association.
Besides being able to incorporate high-dimensional struc-tured traits in genetic association analysis, another major contribution of DKAT is that we introduce a new test design for genetic association testing. Currently, two most popularP -value calculation methods for genetic association analysis is either based on large-sample asymptotic theory (Wu et al.
2010, 2011; Broadawayet al.2016; Wu and Pankow 2016) or via permutations (Hua and Ghosh 2015; Panet al.2015; Jooet al.2016; Kimet al.2016). However, the large-sample asymptotic theory-based P-value calculation can lead to a conservative test with accumulated estimation error (Lee
only calculate thefirst three sample moments of permutations, without explicitly calculating the permutations themselves. Then, the Pearson type III density with the same moments is used to approximate the empirical distribution of all permuta-tions, where a Pearson type III density is selected in this article due to its good approximation performance for DKAT-similar statistics (Josse et al. 2008; Minaset al. 2013; Zhan et al.
2017). Fortunately, the first three sample moments of these
n! permutations have closed-form expressions (Kazi-Aoual
et al.1995). Thus, we can analytically calculate both the Pear-son type III density and the DKATP-value. Our DKAT test de-sign is more efficient and accurate than those currently used for genetic association tests, since it neither requires explicit permutations nor relies on large-sample asymptotic theory.
Methods
Notations
Throughout this article, we assume a study withnunrelated individuals who have been genotyped and phenotyped. For the ith subject (i¼1;. . .;n), letGi¼ ðgi1;. . .;gimÞ de-note the vector of genotypes, wheregij¼0, 1, or 2 represents the number of minor alleles,Yi¼ ðyi1;. . .;yipÞdenote the set ofptraits (e.g., the expression values ofpgenes in a pathway or the abundances of p metabolites in a pathway), and Xi¼ ð1;xi1;. . .;xiqÞ denote covariates such as age, gender and principal components of genotypes. The objective is to test the global association between the group of traits and the group of genetic variants after accounting for the effect of covariates, which will be accomplished by using the kernel machine framework. We emphasize that although our focus is on the setting in which we have multiple genetic variants, our method trivially applies to the scenario whenm¼1;that is, when we are interested in the relationship between a sin-gle variant and multiple traits.
Single kernel-based association tests
Before discussing multi-trait association analysis, we first briefly review the KMR framework, which has been widely used to test the association between a set of genetic variants and a single trait (Liuet al.2007, 2008; Kweeet al.2008; Wu
et al.2010, 2011; Ionita-Lazaet al.2013; Zhanet al.2016). Specifically, the KMR relates the trait (continuous or dichot-omous) to the set of genotype values using the following generalized partial linear model (Liuet al.2007, 2008):
g½EðyijXi;GiÞ ¼XiaþfðGiÞ; (1)
wherea¼ ða0;a1;. . .;aqÞ9are the regression coefficients for
the covariates;fðÞis a generally specified function belonging to a space spanned by a kernel functionkgð;Þ;andgðÞis a link function, such as an identity function for continuous traits and logit function for dichotomous traits. The kernel
kgð;Þis the genotype kernel and has corresponding kernel matrixKG;whereKGði;jÞ ¼kgðGi;GjÞ;i;j¼1;. . .;n:The key to this KMR framework is usage of a positive semidefinite
kernel functionkgðGi;GjÞas a similarity measure between ge-notypesGiandGj(Schaid 2010a,b), which can facilitate cap-ture of struccap-ture and relationships among genetic variants. In the KMR model (1), the trait is related to the variants throughfðÞ:Hence, testing the hypothesis of no association between the trait and genetic variants after adjusting for covariates is equivalent to testingfðÞ ¼0:Through connec-tions between KMR and generalized linear mixed models (Liu et al. 2007, 2008), we can treatfðGÞas a vector of subject-specific random effects with mean zero and variance tKG:Then testingfðÞ ¼0 is equivalent to testing whether the variance component t is equal to zero, which can be easily accomplished using a variance component score test with the following test statistic
S:¼ 1
2fðy2^yÞ9KGðy2^yÞ ¼ 1 2ftr
h
KGðy2y^Þðy2^yÞ9 i
; (2)
wherey¼ ðy1;. . .;ynÞ9;^yis the estimated trait values under the null model offðÞ ¼0;andtrðÞdenotes the trace of a matrix. When the trait is continuous,f¼s^2;withs^2being estimated under the null model. When the trait is dichoto-mous,f¼1:Under the null,Qfollows a mixture ofx2 dis-tributions which can be approximated using exact methods (Davies 1980).
Test statistic (2) is essentially the sum of the element-wise product of twon3nmatrices. One isKGand the other is the cross product of the trait residualsðy2^yÞðy2^yÞ9:In genetic association analysis, the kernel matrix KG is often used to measure the subject-pairwise similarity in terms of genotypes (Kwee et al. 2008; Wu et al. 2010, 2011), and the cross product of residualsðy2^yÞðy2^yÞ9is often used to measure subject-pairwise similarity of phenotypes (Tzenget al.2009, 2011). Heuristically speaking, statistic S compares the subject-pairwise similarity in the trait to that in genotypes, where a high correspondence usually leads to a large statistic value and suggests existence of association.
There are two straightforward ways to extend the single kernel-based association test statistic (2) to accommodate multiple traitsY:One is to stack the columns ofYinto a huge column vectory*¼vecðYÞand apply the statistic (2) toy*: This approach is evaluated in Maityet al.(2012). However, a major limitation is that this approach can be computationally intractable with high-dimensional traits since it needs to eigendecompose an np3np matrix. The other approach to incorporate multiple traits is simply to replace the uni-variate trait residuals cross-product matrixðy2^yÞðy2^yÞ9 by the multivariate traits residuals cross-product matrix
address this issue, we propose the DKAT approach in the following section to allow for testing association between high-dimensional, possibly structured, traits and one or more genetic variants.
A DKAT
To address the aforementioned limitations, we propose to use a phenotype kernelKY to model multiple traits simulta-neously. Similar the genotype kernelKG;the phenotype ker-nel KY is used to summarize the phenotypic similarity. Compared with the cross-product matrixðY2Y^ÞðY2Y^Þ9used in some existing methods, DKAT is able to capture complex structures among the multiple phenotypes by embedding the phenotypes in a kernel.
Like the single kernel-based association tests in KMR, we test the association between multiple traits and multiple ge-netic variants by comparing the phenotypic similarity matrix and genotypic similarity matrix across pairs of individuals. Motivated by works of relating two matrices from the same individuals (Josseet al.2008; Minaset al.2013; Zhanet al.
2017), we propose the new DKAT statistic as
D:¼ ffiffiffiffiffiffiffiffiffiffiffiffiffiffiffiffiffiffiffiffiffiffiffiffiffiffiffiffiffiffiffiffiffiffiffiffiffiffiffiffiffiffiffiffiffiffiffiffiffiffiffiffiffitrðHKGHKYÞ trðHKGHKGÞtrðHKYHKYÞ
p ; (3)
where H¼In21 19=nis a centering matrix, In is the nth order identity matrix, and 1 is ann-dimensional vector of ones. SinceHis idempotent, the numeratortrðHKGHKYÞ is essentially the same astrðHKGHHKYHÞ;which is the element-wise multiplication of centered genotype kernel matrix HKGHand centered phenotype kernel matrixHKYH:Hence, our DKAT statistic shares the same spirit of comparing two similarities as the single kernel-based association tests statis-tic (2). Moreover, if the phenotype kernel is picked as KY ¼ ðY2Y^ÞðY2Y^Þ9;then the DKAT statistic reduces to the form of the KMR statistic in (2). Therefore, most existing kernel association tests (Liu et al. 2007, 2008; Kweeet al.
2008; Wuet al.2010, 2011; Maityet al.2012; Wu and Pankow 2016; Zhanet al.2016) can be viewed as special forms of DKAT. As an alternative to comparing two kernel matrices, there exist some similar statistics either comparing two input matrices (Josse et al. 2008) or two distance matrices (Minas et al.
2013). Kernels have been widely used to capture structures among genotypes (Kweeet al.2008; Wuet al.2010, 2011; Ionita-Laza et al.2013; Broadawayet al.2016). Following this steam, specific kernels are used in this article to capture the inherent structures among both genotypes and phenotypes.
Intuitively speaking, the larger the DKAT statistic, the more likely the genotype kernel matrix resembles the phenotype kernel matrix, which further implies that the phenotypes might be associated with the genotypes in a specific way. To calculate the exact critical value of a DKAT under a given significance level, we need to study its distribution under the null hypothesis of no association. Two current standard ap-proaches of calculating the null distribution of a genetic association test statistic are permutation-based resampling
methods (Hua and Ghosh 2015; Pan et al.2015; Joo et al.
2016; Kim et al.2016) and large sample-based asymptotic methods (Kweeet al.2008; Wuet al.2010, 2011; Broadaway
et al.2016; Wu and Pankow 2016). However, both methods have potential limitations. On one hand, it is computationally expensive to use permutations to achieve genome-wide sig-nificance. On the other hand, it is observed that asymptotic methods can be conservative when the sample size is small or modest (Leeet al.2012; Chenet al.2016). To overcome these potential limitations, we calculate theP-value of DKAT using a fast-pseudopermutation method, closely following the strategy being used in the RV-coefficient literature (Josse
et al. 2008; Minaset al. 2013; Zhan et al.2017), where a typical RV coefficient shares the same form of the DKAT sta-tistic but uses totally different matrices other thanKGandKY (both introduced in the next section) as used in this article. Specifically, a Pearson type III distribution is used to approx-imate the permutation null distribution of DKAT by matching the first three moments. Technical details of calculating the Pearson type III density are presented in Supplemental Material, Section S.1 inFile S1. The advantages of the new DKATP-value calculation strategy are twofold. First, no ex-plicit permutation is required as the finite-sample empirical moments can be analytically calculated. Second, closed-form expression of the Pearson type III density is available, and thus our method allows a fast and analyticP-value calcula-tion for genetic associacalcula-tion analysis.
Choices of kernels
A key aspect of DKAT is the kernels, which appropriately summarize the phenotypic and genotypic similarities between pairwise subjects; although DKAT is statistically valid in pro-tecting the correct type I error, irrespective of the kernels being used. However, good choice of kernels, which better reflect the unique data features, can improve the test power (Freytag
et al.2014; Zhaoet al.2015). In this section, wefirst briefly review some genotype kernels widely used in existing kernel-based association tests and some kernels that could poten-tially be used for phenotypes. Then we propose a specific phenotype kernel for the high-dimensional structured phe-notypes considered in this article.
In the literature, many kernels have been proposed for genotype data (Schaid 2010a,b). Some popular examples in-clude the linear kernel and the identity-by-state (IBS) kernel:
Linear kernel:kgðGi;GjÞ ¼G9iGj¼ Pm
l¼1gilgjl: IBS kernel: kgðGi;GjÞ ¼ ð1=2mÞ
Pm
l¼1ð22jgil2gjljÞ:
The linear kernel assumes a linear association pattern. That is, the functionfðÞin model (1) is of a linear form. It is simple and can be powerful when the true underlying association pattern is linear. The IBS kernel measures the similarity based on identity-by-state (IBS) allele sharing and is positive definite (Kweeet al., 2008). However, the space spanned by an IBS kernel is less studied. Both the linear kernel and the IBS kernel are additive forms, which makes it easy to incorporate weights
On the other hand, few studies have described the use of kernels for the complex multi-dimensional traits as considered in this article. In general, if all traits are continuous, then the Gaussian kernel and thedth-order polynomial kernel are of-ten used. Also, the binary kernel was shown to be a valid kernel function for all multivariate binary traits.
Gaussian kernel:kyðYi;Yj;rÞ ¼expf2 Pp
l¼1ðyil2yjlÞ2=rg Polynomial kernel:kyðYi;Yj;dÞ ¼
Pp
l¼1ðyilyjlþ1Þd: Binary kernel:kyðYi;YjÞ ¼
Pp
l¼1I½yil 6¼yjl
If the traits are mixed (a combination of continuous variables and binary variables), then we can define kernels for both the continuous and binary parts separately and then multiply them together as thefinal kernel function, which has been shown to be valid for association analysis (Zhanet al.2016).
No matter how large the dimensionpis, the information in all traits is pooled into a scalar by using the phenotype kernel. In this sense, DKAT is robust against high-dimensional phe-notypes, which can be a major advantage over most existing multivariate regression-based testing methods (Maityet al.
2012; Wu and Pankow 2016). Besides the robustness to high-dimensional traits, another major concern of this article is to address the network-type traits, such as expression of genes belonging to the same pathway. For such gene pathway data, a network-based kernel has been proposed of the form KY ¼YNY9(Freytaget al.2014), whereNis the undirected adjacency matrix,Nij¼1 represents that geneiand genej
interact with each other in an activating fashion, and Nij¼ 21 represents an inhibition pattern.
In reality, it is difficult to know the functional relationship between each gene pair within the pathway. Hence, we re-place the adjacency matrix N with the precision matrix Q (also called inverse covariance matrix S21), which can be estimated from the data without any prior biological knowl-edge. The precision matrixQis useful in estimating partial correlations, which incorporates the functional mechanism of the whole pathway. For example, under the Gaussian as-sumption,Qij¼0 indicates that geneiand genejare condi-tionally independent given all other genes in the network/ pathway, or equivalently speaking, geneiand jare uncon-nected in the gene network/pathway (Friedmanet al.2008). Similar to the undirected adjacency matrix N; Qcan also incorporate the underlying network structure. Thus, we pro-pose the phenotype kernel matrix asKY ¼YQ^Y9;whereQ^ is the estimated precision matrix. A simple estimator is the sample precision matrixQ^s; and the corresponding pheno-type kernel matrixKYis proportional to the so-called projec-tion similarity matrix in the literature (Wessel and Schork 2006; Broadawayet al.2016). When the dimension of traits is high, the sample precision matrixQ^sis unstable or even not estimable. In such a high-dimensionality scenario, we esti-mate the precision matrix via regularization. For example, a graphical lasso estimatorQ^gl can be derived by maximizing the lasso-penalized log likelihood (Friedmanet al.2008).
In practice, it is often true that multiple kernelsK1
G;. . .;KtG and K1
Y;. . .;KsY are available for testing in DKAT. Without
knowing the true underlying association model, it is of impor-tance to accommodate multiple candidate kernels. In general, there are two approaches to tackle this issue. Thefirst aver-age-type strategy is to calculate an omnibusKo
Gwhich is usu-ally a linear combination ofK1
G;. . .;KtG;and another omnibus
Ko
Ywhich is usually a linear combination ofKY1;. . .;KYs:Then a
final DKAT(Ko
G;KYo) test is applied. The other minimum-type approach to accommodate multiple candidate kernels is to pick the most significant kernel pair. That is,K*
GandKY* are selected such that DKAT(K*
G;K*Y) has the smallestP-value over alltskernel pairsðKi
G;K j
YÞ;i¼1;. . .;t;j¼1;. . .;s:However, the minimum P-value is no longer a genuine P-value and permutations are often needed to establish thefinal signifi -cance. Details of these two approaches of accommodating multiple candidate kernels, along with numerical evalua-tions, can be found in Section S.2 ofFile S1.
Besides the kernels, another important practical issue is to adjust for the confounding covariates effects, such as age, gender, and principal components of genotypes (for adjusting population structures). In genetic association tests, a common strategy of adjusting for covariates is the residual-based ap-proach (Tzenget al.2009, 2011; Wuet al.2010, 2011; Hua and Ghosh 2015; Broadawayet al.2016). That is, wefirstfit the null model with covariates only:g½EðyijXiÞ ¼Xiaand then calculate the residualseY ¼Y2Y^of the null model. Next, one can construct the phenotype kernel on the residuals as the subject-wise trait similarity after adjusting for covariates. That is, the phenotype kernel matrixKY ¼ ðY2Y^ÞQ^ðY2Y^Þ9is used in DKAT, whereQ^ is the estimated precision matrix of resid-uals. Existing numerical studies have shown that it can have the correct type I error as long as the number of covariates is much smaller than the sample size (Wuet al.2010, 2011; Hua and Ghosh 2015; Broadawayet al.2016).
Simulation studies
We conducted extensive simulation studies under different scenarios to evaluate the performance of DKAT in testing the association between high-dimensional structured traits and genotypes. To mimic a relatively high-dimensional scenario,
p¼200 traits (e.g., expressions of genes belonging to a path-way) were considered in our simulation. As a comparison, most existing multivariate association tests usually considered,20 traits (Kleiet al.2008; Maityet al.2012; van der Sluiset al.
2013; Broadaway et al.2016; Ray et al.2016; Schaid et al.
2016; Wu and Pankow 2016). Two different correlation struc-tures were used in this simulation. One was the compound symmetry covariance structure as commonly used in the liter-ature (Maity et al.2012; Broadaway et al.2016; Ray et al.
2016; Schaid et al.2016; Wu and Pankow 2016). That was Sii¼1 andSij¼rfor alli6¼j;whereSwas the covariance matrix of the traits. The other correlation structure was the banded inverse covariance (precision) matrix Q with Qi;i¼1; Qi;i21 ¼Qi21;i¼r; and zero otherwise, where
Q¼S21
was the precision matrix of traits. Assuming all traits were continuous, thenRijj2fi;jg¼2Qij=
ffiffiffiffiffiffiffiffiffiffiffiffiffi QiiQjj p
all other traits. Thus, the banded precision matrixQ repre-sented such a pathway that each gene was only related to its nearby genes conditional on all other genes in the pathway. In contrast to the compound symmetry covariance structure, the banded inverse covariance structure mimicked the complicated functional-regulatory mechanisms in a gene pathway. For sim-plicity, we denoted these two covariance structures asS1and
S2¼Q21in the rest of the simulation section. To guarantee
positive definiteness ofS1andS2;we simply simulatedrfrom
uniform (0, 0.5) distribution. Finally, we conducted three dif-ferent simulation studies, where simulation I was for a single SNP, simulation II was for multiple SNPs, and simulation III was for multiple rare variants. Under each simulation scenario, we considered a sample size of either 500 or 1000 subjects.
Simulation I: This simulation was designed to mimic the pleiotropy effect, where a common SNP affected multiple traits. The data were generated from the model
yij¼bjgiþeij;i¼1;. . .;n;j¼1;. . .;p; (4)
whereyijwas the expression value of genejfor subjectiandgi was a single SNP taking values 0, 1, and 2, with a minor allele frequency (MAF) of 0.3. For eachi,eij;j¼1;. . .pwas distrib-uted as multivariate Gaussian with mean zero and covariance matrix S; where S¼S1 or S2: For simplicity, we did not
consider covariates in the model since they could be easily adjusted via the residual-based approach described previ-ously. Under the null model, allbj¼0:Under the alternative model, we set a proportion (g¼10%;20%;30%) of traits to be truly associated with the SNP (with nonzero b-coefficients). Without loss of generality, we set the first p*¼gp traits as relevant ones with coefficients bj generated from a uniform (0,pffiffiffiffiffiffiffiffiffiffiffi30=n) distribution, for j¼1;. . .;p*; and bj¼0 for
j¼ ðp*þ1Þ;. . .;p: The effect sizes [following uniform (0,pffiffiffiffiffiffiffiffiffiffiffi30=n) distribution] changed with sample size and hence it was meaningless to compare test powers under different sam-ple sizes. These effect sizes were selected to better distinguish different tests under each scenario.
Simulation II: In the second simulation scenario, we tested the association between multiple SNPs and multiple traits. The multiple SNPs were generated based on the linkage disequilibrium (LD) structure of gene acid ceramidase 1 (ASAH1), as used in Wuet al.(2010). A total of 93 HapMap SNPs are located within this gene. Based on the LD structure of theASAH1gene, we used HAPGEN (Spenceret al.2009) to generate SNP genotype data at each of the 93 loci. After the SNPs were simulated, we generated the traits from the fol-lowing model:
yij¼ X93
k¼1
bkjgikþeij;i¼1;. . .;n;j¼1;. . .;p; (5)
where relevant model parameters (e.g.,g;S) were the same as the previousSimulation I. We selected 29 typed SNPs on
Affy6 to calculate the genotype kernel KG in the analysis. Under the null modelbkj¼0;k¼1;. . .;93;j¼1;. . .;p: Un-der the alternative model, we selected thefirstp*¼gptraits as causal ones which were truly associated with the SNPs. For each causal trait, we randomly selected 3 SNPs from the 93 SNPs as the causal SNPs for that trait, and simulated the nonzerobkj-coefficient from uniform (0,
ffiffiffiffiffiffiffiffiffiffiffi 30=n
p
) distribution fork¼j1;j2;j3 2 f1;. . .;93gandj¼1;. . .;p*;where differ-ent traits could have differdiffer-ent causal SNPs. Finally, to allow for the heterogeneous effect of different loci, we randomly assigned a sign for the b-coefficient of each SNP with even probability.
Simulation III:For the simulation of rare variants, we con-sidered the design of Wuet al.(2011) to generate rare var-iants. We simulated 10,000 haplotypes for a 1-Mb region on the basis of COSI (Schaffner et al. 2005) to mimic the LD pattern, local recombination rate, and population history of European descent. Only those variants with MAF ,3% were included in the analysis. After rare variants being simulated, we generated the traits according to model (5). Under the al-ternative model, we randomly selected 10% of the rare variants as causal ones and simulated the nonzerob-coefficients from uniform ð0;2pffiffiffiffiffiffiffiffiffiffiffi30=nÞ3jlog10ðMAFÞj: Other simulation set-tings were the same asSimulation II.
Competing methods: After the data were generated, DKAT was applied to test the association between genotypes and phenotypes. The phenotype kernel used in DKAT was KY ¼ ðY2Y^ÞQ^glðY2Y^Þ9;whereY^ was the phenotypes’ sam-ple mean and the graphical lasso regularization parameter was set as rgl¼0:1 in our simulation. The graphical lasso method was used for illustrative purposes of constructing the phenotype kernel, incorporating the high dimensionality as well as network structures in traits. An optimal graphical lasso regularization parameter was beyond the scope of this article.
Along with DKAT, we also evaluated other methods for comparison. Among existing multivariate-trait association tests, both multiple testing-adjusted univariate trait methods (Yanget al.2010; van der Sluiset al.2013) and dimension reduction-based methods (Kleiet al.2008; Ferreira and Purcell 2009) can be limited with high-dimensional traits. Other multivariate traits–single SNP association testing methods (O’Reillyet al.2012; Jooet al.2016) suffer from power loss when there are systematic but weak marginal effects for each SNP. To make the comparison fair, we focus on existing meth-ods that test association between multivariate traits and mul-tiple SNPs/rare variants. Two of such methods are the gene association with multiple traits (GAMuT) test (Broadaway
et al.2016) and the multivariate sequence kernel association tests (MSKAT) (Wu and Pankow 2016), which are briefly introduced in the following paragraph.
(Broadawayet al.2016). The asymptotic distribution of the GAMuT statistic isPni¼1
Pn
j¼1lijjx2ij;whereli;jj are eigen-values ofHKGHandHKYH;respectively, andx2
ijare indepen-dent and iindepen-dentically distributedx2with 1 degree of freedom.
Then, the GAMuT P-value is calculated based on this as-ymptotic distribution with quadratic form approximations (Davies 1980). To make a fair comparison, the same pheno-type kernelKY ¼ ðY2Y^ÞQ^glðY2Y^Þ9in DKAT was applied in GAMuT in our simulations. The other method, MSKAT, as-sumes a linear model between each individual trait with mul-tiple genetic variants, and considers the score test statisticssjk between the kth trait and jth variant, where k¼1;. . .;p; j¼1;. . .;M: Let Sj¼ ðsj1;. . .sjpÞ9 be the score vector be-tween the jth variant and all traits. Ignoring the weights, the MSKAT statistic has been proposed as Q¼PMj¼1S9jQ^sSj (Wu and Pankow 2016), whereQ^sis the sample precision matrix. UnlikeQ^gl-based DKAT and GAMuT, the MSKAT
sta-tistic usesQ^s¼S^ 21
;which requiresn.p:To avoid this po-tential limitation, another variant of statisticQ2¼PMj¼1S9jSj is also considered (Wu and Pankow 2016), which is termed as MSKAT2 in our simulations. MSKAT2 represents a broad class of multivariate-trait association testing methods that ignore the correlation structures among outcomes [such as DKAT and GAMuT with the linear phenotype kernel K9
Y ¼ ðY2Y^ÞðY2Y^Þ9:MSKAT and MSKAT2P-values are calcu-lated in a similar way as GAMuT, which is based on its asymp-totic quadratic form approximation (Wu and Pankow 2016).
As pointed out in Wu and Pankow (2016), MSKAT and MSKAT2 implicitly used the (weighted) linear kernel for ge-netic variants. To make the comparison fair, the same linear kernels were used in DKAT and GAMuT. In particular, we used the same linear kernel for the SNPs simulations ( Simu-lation IandSimulation II) and the weighted linear kernel for the rare variants simulation (Simulation III). The weight for each rare variant was specified as Beta(MAF,1,25) as sug-gested in SKAT (Wuet al.2011). Finally, under each simula-tion scenario, we evaluated the type-I error of each test with 1,000,000 replicates under the null model, and the power with 1000 replicates under the alternative model. The em-pirical type-I error rate and power were calculated as the proportion of replicates with aP-value smaller than the nom-inal significance level.
Real data application
We applied the newly proposed DKAT approach to a Grady Trauma Project data set that was collected as part of a larger study investigating the role of genetic and environmental factors in predicting response to stressful life events (Gillespie et al. 2009). A total of 337 individuals were recruited from the Grady Memorial Hospital in Atlanta, Geor-gia. Blood samples were collected from these individuals who provided informed consent and participated in a verbal in-terview. For each individual, both gene expressions and ge-notypes were measured. Demographic data such as gender, age, and race were also collected. Details on data collection
and preprocessing can be obtained from previous publications (Gillespieet al.2009). Previous studies have shown that genetic risk factors may account for up to 30–40% of the heritability of developing post-traumatic stress disorder (PTSD) following a trauma, and many gene pathways that are associated with PTSD have been identified (Almliet al.2014b). In this analysis, we further studied the genetic regulation of expressions of genes belonging to these pathways. In particular, we were par-ticularly interested in the cis-regulation, that was, whether pathway gene expressions were associated with the SNPs in the same pathway. Expressions of 8588 genes belonging to 224 pathways (with more than one gene in each pathway) were measured. In each pathway analysis, the phenotypes were the gene expression values and the genotypes were the SNPs in that pathway. A total of 164,503 SNPs were mapped to the 8588 genes in 224 pathways. The median number of genes in a pathway was 27, with the first and third quantiles being 14 and 48, respectively.
Two different sets of association analyses were conducted. In thefirst set of association analysis, we evaluated the asso-ciation between the multiple gene expressions in a pathway and all SNPs in the same pathway using DKAT, GAMuT, MSKAT, and MSKAT2. In the second set of association analysis, we evaluated the importance of each individual gene for certain pathways that might be of interest based on results of thefirst analysis. In other words, we examined the association between the path-way gene expressions and SNPs in each individual gene be-longing to the pathway. For all association analyses, we adjusted the covariate effects of gender, age, race, and the top 10 principal components of the genotype data.
Data availability
An R software implementing the proposed DKAT method is available athttps://github.com/xyz5074/DKAT. The expres-sion data are available at Gene Expresexpres-sion Omnibus acces-sion number GSE58137. Details about the genotype data are available in Almliet al.(2014a).
Results
Simulation results
Type-I error results: The empirical type-I error rates under
Simulation Iare reported in Table 1. Based on the table, DKAT is always able to protect the correct type-I error across differ-ent scenarios. On the other hand, GAMuT and MSKAT are conservative under each simulation scenario, especially when the sample size is relatively small (n¼500). MSKAT2 seems to be more conservative underS2thanS1:To further
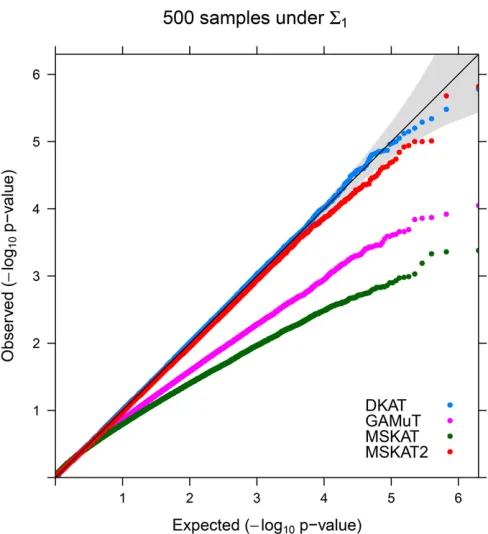
explore the type-I error of all tests at more stringent signifi -cance levels, we present the QQ plots ofP-values under the configuration ofn¼500 andS¼S1in Figure 1. As we can
downward, implying these tests are very conservative, which are all consistent with the results from Table 1. QQ plots under other simulation configurations are qualitatively simi-lar and hence are not reported. Simisimi-lar empirical type-I error results have also been observed inSimulation IIand Simula-tion III(Tables S2 and S3inFile S1).
It has been observed in single trait kernel association tests that estimation error (due to small sample size) can lead to conservative tests (Leeet al.2012; Chenet al.2016), which also explains the conservativeness of GAMuT and MSKAT in this simulation. Taking GAMuT as an example, the asymp-totic null distribution of GMAuT depends on the eigenvalues of matrixHKYH;whereKY ¼ ðY2Y^ÞQ^glðY2Y^Þ9;which fur-ther requires accurate estimation of the precision matrix. Given the high dimensionality of traits, many parameters in the precision matrix need to be estimated. The accumulated estimation errors in GAMuT deteriorate the performance of the test, resulting in overprotected (conservative) P-values (Lee et al. 2012; Chen et al. 2016). Unlike GAMuT and MSKAT, which need to estimate the whole precision matrix Q; MSKAT2 only needs to estimate the diagonals Sjj;
j¼1;. . .p: The accumulated estimation errors in MSKAT2 is much smaller and hence it is less conservative than GAMuT and MSKAT. Finally, the way DKAT calculates itsP-value is more robust to these estimation errors (Section S.1 in File S1), and hence DKAT is robust to small samples and high-dimensional traits. To summarize, the proposed DKAT always has the correct type-I error rate even under a very stringent nominal significance level. On the other hand, GAMuT, MSKAT, and MSKAT2 can be conservative especially when the sample size is relatively small or modest.
Power results: Without loss of generality, we compare the power of all tests under significance level a¼2:531026
(reflecting a genome-wide Bonferroni correction for 20,000 genes). The power underSimulation Iis presented in Figure 2. It is clear to see that DKAT is always the most powerful test under each scenario. On the other hand, MSKAT2 always tends to be the least powerful test (except for the small-sample scenario, where MSKAT can have lower power due to the
its conservativeness as seen in the previous type-I error sim-ulation results section). This is because the phenotype kernel KY ¼ ðY2Y^ÞQ^glðY2Y^Þ9 used in DKAT and GAMuT (or Q^s used in MSKAT) can incorporate the inherent correlation structure among the multivariate traits, while MSKAT2 sim-ply ignores the correlations among traits. The power gain of DKAT/GAMuT/MSKAT over MSKAT2 increases with the (partial) correlation strength among traits (i.e.,r value in S1orS2). For each test considered in this simulation study,
the power of the test increases as the proportion (g) of asso-ciated traits increases (i.e., as the genes are increasingly pleiotropic). This is because it can further amplify the asso-ciation signal by including more relevant traits into the multi-trait association analysis. Qualitatively similar empirical power results are also observed inSimulation II(Figure S2in
File S1) andSimulation III(Figure S3 inFile S1).
To summarize, DKAT is always more powerful than GAMuT, MSKAT, and MSKAT2. The power gain probably comes from two aspects. One is the usage of phenotype kernel to incorporate the complex structure of traits into association analysis (compared to MSKAT2). The other is from the new efficient and robustP-value calculation (compared to GAMuT and MSKAT).
Data application results
To account for multiple testing, we set family-wise signifi -cance level of 2:231024¼0:05=224;which corresponds to
a Bonferroni correction based on the number of pathways being tested. Under this significance level, 18, 17, 16, and
Figure 1 QQ plots:2log10 QQ plots for DKAT, GAMuT, MSKAT, and
MSKAT2 withðn¼500;S¼S1Þunder simulation I. The shading area is the 95% confidence band for P-values.
Table 1 Empirical type-I error rates (divided by the nominal significance levela) under simulation I
S n a DKAT GAMuT MSKAT MSKAT2
S1 500 1023 1.04 0.09 0.01 0.87
1024 1.06 0.01 0 0.67
1025 0.90 0 0 0.50
1000 1023 0.92 0.31 0.19 0.93
1024 1.07 0.13 0.12 0.56
1025 1.00 0 0 0.80
S2 500 1023 0.96 0.10 0.01 0.21
1024 1.03 0.02 0 0.12
1025 0.90 0 0 0.10
1000 1023 1.06 0.23 0.27 0.37
1024 0.89 0.14 0.10 0.23
1 pathways have been found where their gene expressions were significantly associated with their SNPs by DKAT, GAMuT, MSKAT, and MSKAT2, respectively. Compared with MSKAT2, it is clear that incorporating the network-type gene regulatory structure via the precision matrix (as in DKAT/ GAMuT/MSKAT) can largely enhance the discovery power of association analysis between pathway gene expressions and SNPs. The DKAT is slightly more powerful than GAMuT and MSKAT, which is probably because the test design of DKAT is more efficient for this data set.
Under the family-wise significance level, the only pathway that was detected as associated with its SNPs by all DKAT, GAMuT, MSKAT, and MSKAT2 methods was asthma (KEGG: hsa05310). A further interesting analysis was to test which individual gene regulates the asthma pathway gene expres-sions. To this end, we tested the association between asthma pathway gene expressions and all SNPs in a single gene belonging to that pathway. In this data, a total of 167 SNPs were detected in 10 genes in the asthma pathway. Under the gene-level SNPs and pathway-level expression association analysis, DKAT, GAMuT, and MSKAT all detected four genes (HLA-DRA,HLA-DRB1, HLA-DQA1, andHLA-DQB1) which regulated the asthma pathway expressions while MSKAT2
only detected two of them (HLA-DRB1 and HLA-DQA1). Further functional study of these genes on asthma may be of biological interest.
Discussion
In this article, we have proposed DKAT for evaluating the association between high-dimensional structured traits and multiple SNPs or rare variants. Compared with most existing kernel association tests (e.g., SKAT), the novelties of DKAT are twofold. First, an additional phenotype/trait kernel is used, which can incorporate the inherently complex structure of the traits and thereby improve the statistical power for detecting an existing association signal. The numerical stud-ies in this article are mainly designed to mimic the scenario of high-dimensional, structured traits, where we propose a network-type phenotype kernel by replacing the adjacency matrix in Freytag et al.(2014) with the precision matrix. We emphasize that it is possible to design new appropriate kernels for other data types, which can lead to a useful and powerful association analysis. Second, unlike existing associ-ation tests, DKAT provides a new robust strategy to compute
P-values in genetic association testing. The DKATP-value is
less sensitive to estimating errors in covariance terms compared to other methods (e.g., GAMuT and MSKAT), and is extremely appealing with high-dimensional traits, where it is difficult to accurately estimate the trait covariance matrix given the di-mensionality. Thus, DKAT is more robust than most existing methods in testing the association between high-dimensional structured traits and genotypes.
As an association test, DKAT has four advantages. First, DKAT is methodologicallyflexible in testing the association between an arbitrary set of traits and an arbitrary set of genetic variants. It can test the association between multiple traits and either single/multiple SNPs or multiple rare variants, without making parametric assumptions. On the contrary, many exist-ing multivariate-trait association tests can only handle a sexist-ingle SNP (O’Reillyet al.2012; Zhou and Stephens 2014; Wu and Pankow 2015; Jooet al.2016; Rayet al.2016; Schaidet al.
2016). Others often assume that traits are associated with SNPs through a linear model (Maity et al. 2012; Wu and Pankow 2016). Second, DKAT can evaluate biologically meaningful hypotheses. The phenotype kernel in DKAT can capture pleiotropy effects among the phenotypes and the ge-notype kernel can capture epistasis effects among SNPs. With prior biological knowledge, it can be of interest to apply DKAT to test associations between a prespecified set of traits and a prespecified region of genetic variants, the results of which may further lead to meaningful biological insights. Third, DKAT is also statistically very powerful. As illustrated previ-ously in the SNP-set association test (Kweeet al.2008; Wu
et al.2010), a SNP kernel can amplify the association signal by collapsing information across multiple SNPs. Moreover, the phenotype kernel in DKAT can further amplify the asso-ciation signal by collapsing information across multiple traits. After amplifying twice, DKAT can greatly improve the statis-tical power to detect any existing association signal. Fourth, DKAT is also computationally scalable. Only matrix multiplica-tion is required in DKAT. However, both GAMuT and MSKAT requires eigendecomposition ofn3nmatrices, which can be computationally unstable for a large sample size. Furthermore, the asymptoticP-value calculation in GAMuT and MSKAT re-quires largenor smallp, otherwise it can be conservative due to estimation error (Lee et al.2012; Chenet al. 2016). On the other hand, DKAT is applicable to any sample sizenand trait dimensionp. In this regard, DKAT is appropriate for the largep
smallnproblems frequently encountered in modern scientific studies.
The design of simulation II (SNPs set) and simulation III (rare variants) is in vein with previous simulation studies in the literature (Wuet al.2010, 2011). For example, the same
ASAH1 gene/LD structure is used in the article. Since no relevant assumptions are made, we believe that our method should also work well with other genes/LD structures. In this article, we only considered an association study for unrelated populations. Another important scenario is cohorts with pop-ulation relatedness, such as family-based association studies (Chen and Abecasis 2007; Schifanoet al.2012; Wanget al.
2016). It is of future interest to extend the current DKAT to
incorporate the family structure. As indicated in our numer-ical studies, including more relevant traits in DKAT increases the power to a large extent. However, when more noise traits (not associated with the SNP set) are added, it may lead to power loss. In practice, the true association signal may not be known. Adaptive testing strategies could be used to address this uncertainty (Panet al.2015; Zhanet al.2015a; Kimet al.
2016). Finally, to aid interpretation of which genetic variants or which traits are associated, it is of interest to prioritize individual genetic variants/traits by incorporating variable selection in DKAT (Heet al.2016). We believe these issues are of importance and warrant further investigation.
Acknowledgments
Comments by two referees and the communicating editor helped improve this article and are highly appreciated. This research was supported by National Institutes of Health grants U10 CA-180819 and R01 HG-007508 and the Hope Foundation.
Literature Cited
Alberti, K. G. M., P. Zimmet, and J. Shaw IDF Epidemiology Task Force Consensus Group, 2005 The metabolic syndrome–a new worldwide definition. Lancet 366: 1059–1062.
Almli, L. M., R. Duncan, H. Feng, D. Ghosh, E. B. Binder et al., 2014a Correcting systematic inflation in genetic association tests that consider interaction effects: application to a genome-wide association study of posttraumatic stress disorder. JAMA Psychiatry 71: 1392–1399.
Almli, L. M., N. Fani, A. K. Smith, and K. J. Ressler, 2014b Genetic approaches to understanding post-traumatic stress disorder. Int. J. Neuropsychopharmacol. 17: 355–370.
Andreassen, O. A., H. F. Harbo, Y. Wang, W. Thompson, A. Schork et al., 2015 Genetic pleiotropy between multiple sclerosis and schizophrenia but not bipolar disorder: differential involvement of immune-related gene loci. Mol. Psychiatry 20: 207–214. Aschard, H., B. J. Vilhjálmsson, N. Greliche, P.-E. Morange, D.-A.
Trégouët et al., 2014 Maximizing the power of principal-component analysis of correlated phenotypes in genome-wide association studies. Am. J. Hum. Genet. 94: 662–676. Broadaway, K. A., D. J. Cutler, R. Duncan, J. L. Moore, E. B. Ware
et al., 2016 A statistical approach for testing cross-phenotype effects of rare variants. Am. J. Hum. Genet. 98: 525–540. Chen, J., W. Chen, N. Zhao, M. C. Wu, and D. J. Schaid,
2016 Small sample kernel association tests for human genetic and microbiome association studies. Genet. Epidemiol. 40: 5– 19.
Chen, W.-M., and G. R. Abecasis, 2007 Family-based association tests for genomewide association scans. Am. J. Hum. Genet. 81: 913–926.
Chesler, E. J., L. Lu, S. Shou, Y. Qu, J. Guet al., 2005 Complex trait analysis of gene expression uncovers polygenic and pleio-tropic networks that modulate nervous system function. Nat. Genet. 37: 233–242.
Davies, R. B., 1980 Algorithm as 155: the distribution of a linear combination ofx2random variables. J. R. Stat. Soc. Ser. C Appl. Stat. 29: 323–333.
Freytag, S., J. Manitz, M. Schlather, T. Kneib, C. I. Amos et al., 2014 A network-based kernel machine test for the identifi ca-tion of risk pathways in genome-wide associaca-tion studies. Hum. Hered. 76: 64–75.
Friedman, J., T. Hastie, and R. Tibshirani, 2008 Sparse inverse covariance estimation with the graphical lasso. Biostatistics 9: 432–441.
Gillespie, C. F., B. Bradley, K. Mercer, A. K. Smith, K. Conneelyet al., 2009 Trauma exposure and stress-related disorders in inner city primary care patients. Gen. Hosp. Psychiatry 31: 505–514. He, Q., T. Cai, Y. Liu, N. Zhao, Q. E. Harmonet al., 2016 Prioritizing individual genetic variants after kernel machine testing using vari-able selection. Genet. Epidemiol. 40: 722–731.
Hua, W.-Y., and D. Ghosh, 2015 Equivalence of kernel machine regression and kernel distance covariance for multidimensional phenotype association studies. Biometrics 71: 812–820. Ionita-Laza, I., S. Lee, V. Makarov, J. D. Buxbaum, and X. Lin,
2013 Sequence kernel association tests for the combined effect of rare and common variants. Am. J. Hum. Genet. 92: 841–853. Joo, J. W. J., E. Y. Kang, E. Org, N. Furlotte, B. Parks et al., 2016 Efficient and accurate multiple-phenotype regression method for high dimensional data considering population struc-ture. Genetics 204: 1379–1390.
Josse, J., J. Pagès, and F. Husson, 2008 Testing the significance of theRVcoefficient. Comput. Stat. Data Anal. 53: 82–91. Kazi-Aoual, F., S. Hitier, R. Sabatier, and J.-D. Lebreton,
1995 Refined approximations to permutation tests for multi-variate inference. Comput. Stat. Data Anal. 20: 643–656. Kim, J., Y. Zhang, and W. Pan, 2016 Powerful and adaptive
test-ing for multi-trait and multi-SNP associations with GWAS and sequencing data. Genetics 203: 715–731.
Klei, L., D. Luca, B. Devlin, and K. Roeder, 2008 Pleiotropy and principal components of heritability combine to increase power for association analysis. Genet. Epidemiol. 32: 9–19.
Kwee, L. C., D. Liu, X. Lin, D. Ghosh, and M. P. Epstein, 2008 A powerful andflexible multilocus association test for quantitative traits. Am. J. Hum. Genet. 82: 386–397.
Lee, S., M. J. Emond, M. J. Bamshad, K. C. Barnes, M. J. Riederet al., 2012 Optimal unified approach for rare-variant association test-ing with application to small-sample case-control whole-exome sequencing studies. Am. J. Hum. Genet. 91: 224–237.
Liu, D., X. Lin, and D. Ghosh, 2007 Semiparametric regression of multidimensional genetic pathway data: least-squares kernel machines and linear mixed models. Biometrics 63: 1079–1088. Liu, D., D. Ghosh, and X. Lin, 2008 Estimation and testing for the effect of a genetic pathway on a disease outcome using logistic kernel machine regression via logistic mixed models. BMC Bio-informatics 9: 292.
Maity, A., P. F. Sullivan, and J.-Y. Tzeng, 2012 Multivariate phe-notype association analysis by marker-set kernel machine re-gression. Genet. Epidemiol. 36: 686–695.
McCarthy, M. I., G. R. Abecasis, L. R. Cardon, D. B. Goldstein, J. Little et al., 2008 Genome-wide association studies for com-plex traits: consensus, uncertainty and challenges. Nat. Rev. Genet. 9: 356–369.
Minas, C., E. Curry, and G. Montana, 2013 A distance-based test of association between paired heterogeneous genomic data. Bi-oinformatics 29: 2555–2563.
O’Reilly, P. F., C. J. Hoggart, Y. Pomyen, F. C. Calboli, P. Elliott et al., 2012 MultiPhen: joint model of multiple phenotypes can increase discovery in GWAS. PLoS One 7: e34861.
Pan, W., I.-Y. Kwak, and P. Wei, 2015 A powerful pathway-based adaptive test for genetic association with common or rare vari-ants. Am. J. Hum. Genet. 97: 86–98.
Ray, D., J. S. Pankow, and S. Basu, 2016 USAT: a unified score-based association test for multiple phenotype-genotype analysis. Genet. Epidemiol. 40: 20–34.
Schaffner, S. F., C. Foo, S. Gabriel, D. Reich, M. J. Daly et al., 2005 Calibrating a coalescent simulation of human genome sequence variation. Genome Res. 15: 1576–1583.
Schaid, D. J., 2010a Genomic similarity and kernel methods i: advancements by building on mathematical and statistical foun-dations. Hum. Hered. 70: 109–131.
Schaid, D. J., 2010b Genomic similarity and kernel methods ii: methods for genomic information. Hum. Hered. 70: 132–140. Schaid, D. J., X. Tong, B. Larrabee, R. B. Kennedy, G. A. Poland
et al., 2016 Statistical methods for testing genetic pleiotropy. Genetics 204: 483–497.
Schifano, E. D., M. P. Epstein, L. F. Bielak, M. A. Jhun, S. L. Kardia et al., 2012 SNP set association analysis for familial data. Genet. Epidemiol. 36: 797–810.
Spencer, C. C., Z. Su, P. Donnelly, and J. Marchini, 2009 Designing genome-wide association studies: sample size, power, imputation, and the choice of genotyping chip. PLoS Genet. 5: e1000477.
Tzeng, J.-Y., D. Zhang, S.-M. Chang, D. C. Thomas, and M. Davi-dian, 2009 Gene-trait similarity regression for multimarker-based association analysis. Biometrics 65: 822–832.
Tzeng, J.-Y., D. Zhang, M. Pongpanich, C. Smith, M. I. McCarthy et al., 2011 Studying gene and gene-environment effects of uncommon and common variants on continuous traits: a marker-set approach using gene-trait similarity regression. Am. J. Hum. Genet. 89: 277–288.
van der Sluis, S., D. Posthuma, and C. V. Dolan, 2013 TATES: efficient multivariate genotype-phenotype analysis for genome-wide association studies. PLoS Genet. 9: e1003235.
Wang, X., Z. Zhang, N. Morris, T. Cai, S. Lee et al., 2016 Rare variant association test in family-based sequencing studies. Brief. Bioinform. bbw083. DOI: 10.1093/bib/bbw083. Welter, D., J. MacArthur, J. Morales, T. Burdett, P. Hall et al.,
2014 The NHGRI GWAS catalog, a curated resource of SNP-trait associations. Nucleic Acids Res. 42: D1001–D1006. Wessel, J., and N. J. Schork, 2006 Generalized genomic distance–
based regression methodology for multilocus association analy-sis. Am. J. Hum. Genet. 79: 792–806.
Wu, B., and J. S. Pankow, 2015 Statistical methods for association tests of multiple continuous traits in genome-wide association studies. Ann. Hum. Genet. 79: 282–293.
Wu, B., and J. S. Pankow, 2016 Sequence kernel association test of multiple continuous phenotypes. Genet. Epidemiol. 40: 91– 100.
Wu, M. C., P. Kraft, M. P. Epstein, D. M. Taylor, S. J. Chanock et al., 2010 Powerful SNP-set analysis for case-control genome-wide association studies. Am. J. Hum. Genet. 86: 929–942.
Wu, M. C., S. Lee, T. Cai, Y. Li, M. Boehnkeet al., 2011 Rare-variant association testing for sequencing data with the sequence kernel association test. Am. J. Hum. Genet. 89: 82– 93.
Yang, Q., H. Wu, C.-Y. Guo, and C. S. Fox, 2010 Analyze multi-variate phenotypes in genetic association studies by combining univariate association tests. Genet. Epidemiol. 34: 444–454. Zhan, X., M. P. Epstein, and D. Ghosh, 2015a An adaptive genetic
association test using double kernel machines. Stat. Biosci. 7: 262–281.
Zhan, X., A. D. Patterson, and D. Ghosh, 2015b Kernel approaches for differential expression analysis of mass spectrometry-based metabolomics data. BMC Bioinformatics 16: 77.
Zhan, X., S. Girirajan, N. Zhao, M. C. Wu, and D. Ghosh, 2016 A novel copy number variants kernel association test with appli-cation to autism spectrum disorders studies. Bioinformatics 32: 3603–3610.
community-level association analysis. Biometrics DOI: 10.1111/biom.12684.
Zhang, Y., Z. Xu, X. Shen, and W. Pan, 2014 Testing for association with multiple traits in generalized estimation equations, with ap-plication to neuroimaging data. Neuroimage 96: 309–325. Zhao, N., J. Chen, I. M. Carroll, T. Ringel-Kulka, M. P. Epsteinet al.,
2015 Testing in microbiome-profiling studies with mirkat, the
microbiome regression-based kernel association test. Am. J. Hum. Genet. 96: 797–807.
Zhou, X., and M. Stephens, 2014 Efficient algorithms for multi-variate linear mixed models in genome-wide association studies. Nat. Methods 11: 407.