ISSN 0379-1386
5 J MAY
B l 1979
Έ
eurostat
DE
EUROPÆISKE FÆLLESSKABERS STATISTISKE KONTOR
STATISTICAL OFFICE OF THE EUROPEAN COMMUNITIES
ISTITUTO STATISTICO DELLE COMUNITÀ EUROPEE
Luxembourg-Kirchberg, Boîte postale 1907 — Tél. 4 3 0 1 1 Télex : Comeur Lu 3 4 2 3
1049 Bruxelles, Bâtiment Berlaymont, Rue de la Loi 2 0 0 (Bureau de liaison) — Tél. 7 3 5 8 0 4 0
— Denne publikation kan fås gennem de salgssteder, som er nævnt på omslagets tredje side i dette hæfte
— This publication is obtainable from the sales agents mentioned on the inside backcover
— Per ottenere questa pubblicazione, si prega di rivolgersi agli uffici di vendita i cui indirizzi sono indicati
nella 3
apagina di copertina
Indholdsgengivelse kun tilladt med angivelse af kilde
Reproduction of the contents of this publication is subject to acknowledgment of the source
E U R O S T A T I S T I K ^
DATA TIL KONJUNKTURANALYSE
E U R O S T A T I S T I C S ™
DATA FOR SHORT-TERM ECONOMIC ANALYSIS
EUROSTATISTICHE
DATI PER L'ANALISI DELLA CONGIUNTURA
Analysis of trade between the
developed and developing world,
1955-1977
ARTIKLER - ARTICLES - ARTICOLI 83
AKTUELLE FAKTA
Arbejdsløshed: svag nedgang i april måned
For første gang i mere end seks måneder er antallet af registrerede arbejdsløse i Fællesskabet faldet til lidt undet 6 mio of udgjorde ved
udgangen af april 1979 5.9 mio. hvilket er en nedgang på 227 0 0 0 . De arbejdsløses andel af den erhvervsaktive befolkning er hermed
faldet fra 5,7°/o ved udgangen af marts til 5,5°/o ved udgangen af april.
Ligesom i foregående måned, er nedgangen i antallet af arbejdsløse i Fællesskabet i væsentlig grad sæsonbetinget. I sæsonkorrigerede tal er
den kun på 0 . 2 % . mens den i marts var på 0 . 6 % . Hvad de enkelte lande angår er der i forhold til april 1 9 7 8 registreret en nedgang i
Danmark ( - 1 6 . 8 % ) . Forbundsrepublikken Tyskland (—12.5%) og Det forenede Kongerige (—7,7%). Derimod er antallet af arbejdsløse i
løbet af det sidste år steget i Frankrig ( + 21.2%). Italien ( + 13,1 %) og Belgien ( + 5,3%).
Industriproduktionen — Februar 1 9 7 9 : udligning af tilbagegangen i januar
Industriproduktionen i Fællesskabet nåede i februar 1979 igen op på niveauet fra december 1978. Indekset for industriproduktionen i
Fællesskabet steg efter sæsonkorrigering til 1 1 5,3 med basisaæret 1 9 7 5 = 1 0 0 . hvilket er en stigning på 2 , 3 % i forhold til januar måned. I
marts udviste produktionen en let stigning i forhold til februar. Denne skyldes stigninger hovedsagelig i Tyskland og Det forenede Kongerige,
stabilisering i Frankrig of nedgang i Italien of Nederlandene.
En analyse af udviklingstendenserne på kort sigt i de seneste seks måneder viser, at væksten er regelmæssig og vedvarende i Frankrig of
Nederlandene, mens den er mere usikker i Forbundsrepublikken Tyskland og i endnu højere grad i Italien.
Analyserer man branchegrupperne, er det markante træk den manglende aktivitet i produktionen af investeringsgoder i næsten alle landene.
især i Frankrig of Forbundsrepublikken Tyskland.
Energi: vanskelige forhold pá oliemarkedet
Fællesskabets olieøkonomi i de første måneder af 1979 var domineret af to faktorer, som bevirkede en fundamental ændring af
markedsforholdene. Standsningen af eksporten fra Iran i to måneder i begyndelsen af 1 9 7 9 (Iran tegnede sig forca. 1 6 % af Fællesskabets
import af råolie fra tredjelande i 1978) i forbindelse med den strenge vinter i de ni EF-lande førte uundgåeligt til kraftige prisstigninger på
råolie og spotleverancerne. Lagerbeholdningerne (ud over sikkerhedslagrene) var ikke tilstrækkelige til at dæmpe markedsmekanismerne. De
sidste tal viser forøgede leverancer af olieprodukter på det interne marked for de tre første måneder af 1 979 (¡sær gas- og dieselolie og
restbrændselsolie).
Rådets beslutning om at reducere de ni landes olieforbrug med 5 % i 1 9 7 9 finder anvendelse på forbruget i den resterende del af året.
Samhandelen inden for Fællesskabet
(*)
Samhandelen inden for Fællesskabet (udregnet på basis af importen) var i februar 1979 på ca. 15 milliarder ERE (eksklusive Det forenede
Kongerige), og i årets første to måneder var der tale om en temmelig betydelig stigning af størrelsesordenen 1 3 % i forhold til samme periode
sidste år Denne stigning var ¡sær kraftig i februar, hvor samhandelen mellem medlemsstaterne steg med 1 6 % i forhold til den foregående
måned. Italien var det land, der havde den største stigning i handelen med fællesmarkedspartnerne: + 3 0 % for importens ( + 4 0 % fra januar
til februar i år) og + 3 7 % for eksportens vedkommende ( + 5 8 % fra januar til februar). Stigningen i Frankrig ( + 1 8 % for importens og
+ 1 7 % for eksportens vedkommende) og i Forbundsrepublikken Tyskland ( + 1 7 % og + 1 3%) var ligeledes betydelig.
Hvad angår handelsbalancen mellem medlemslandene for februar bemærker man et betydeligt overskud i Italien ( + 3 7 8 mio ERE),
Nederlandene ( + 263 mio) og Belgien ( + 1 35 mio), mens underskuddet i Frankrig stadig væk er betydeligt (—111 mio).
Fællesskabets samhandel med tredjelande
(*)
I begyndelsen af 1 979 (de to første måneder) steg værdien af Fællesskabeis import (24,5 milliarder ERE eksklusive Det forenede Kongerige)
betydeligt ( + 1 3 % ) i forhold til samme periode året i forvejen. Især var værdien af Fællesskabets import i februar (12,3 milliarder) 1 6 %
større i forhold til samme periode i 1 9 7 8 og lidt højere end for januar måned i år.
Den samme tendens gør sig gældende for Fællesskabets eksport (1 1.5 milliarder ERE i februar of 22.4 i de to første måneder): + 1 1 % for
januar-februar 1 979 i forhold til samme periode i 1 978 og + 5 % for februar i forhold til januar i år.
Underskuddet på Fællesskabets handelsbalance lå i begyndelsen af 1 9 7 9 på samme niveau som året i forvejen ( — 2.3 milliarder ERE).
Forbrugerpriser: forøget stigning
Forbrugerprisindekset for all EF-landene steg med 1 . 1 % fra marts til april 1 9 7 9 . hvilket tydeligt viser den forøgede stigning, der har fundet
sted siden årets begyndelse.
For perioden fra januar til april har den gennemsnitlige stigning været på 1.0% for den tilsvarende periode i 1 9 7 8 .
MAIN DEVELOPMENTS
Unemployment: slight drop in April
For the first time for over six months, the number of registered unemployed in the Community fell to just under 6 million, standing at
5.9 million at the end of April 1 9 7 9 — a drop of 227 0 0 0 . The number of unemployed as a proportion of the civilian working population fell
again from 5 . 7 % at the end of March to 5 . 5 % at the end of April.
As in the previous month, the size of this decrease is largely due to seasonal factors. The drop in the seasonally adjusted figures is only
0 . 2 % . as against 0 . 6 % in March. As for the individual countries, compared with April 1 9 7 8 . a drop was recorded in Denmark ( - 1 6 . 8 % ) ,
the Federal Republic of Germany (—12.5%) and the United Kingdom (—7.7%); on the other hand, the number of unemployed has
increased over the past year in France ( + 2 1 . 2 % ) , Italy ( + 1 3 . 1 % ) and Belgium ( + 5.3%).
Index of industrial production — February 1 9 7 9 : recovery of the ground lost in January
In February 1979 industrial production in the Community went up again to the December 1 9 7 8 level; after adjustment for seasonal
variations, the index of industrial production in the Community went up to 11 5.3 (base 1 9 7 5 = 1 0 0 ) , an increase of 2 . 3 % compared with
January. In March, production was slightly up on February: this rise is the result of increases principally in Germany and the United Kingdom.
a stabilization in France and decreases in Italy and the Netherlands.
Analysis of short-term trends over the last six months shows that the rate of growth is steady and lasting in France and the Netherlands but
more faltering in Germany and. to an even greater degree, Italy.
The salient feature of the analysis by sector is still the stagnation in the production of capital goods in almost all the countries and especially
in Germany and France.
Energy: difficult situation on the oil market
The oil market in the Community during the first few months of 1 979 was dominated by two factors which caused a profound change in the
market conditions. The stopping of exports from Iran for two months at the beginning of the year (Iran accounted for approximately 1 6 % of
Community imports of crude oil from third countries in 1978) combined with the harsh winter suffered by the nine countries of the
Community resulted inevitably in sharp increases in prices for crude oil and spot deliveries. The levels of stocks (apart from strategic stocks)
were not adequate to cushion the effects of the market forces. The latest statistics show increased deliveries of petroleum products on the
domestic market during the first three months of 1 9 7 9 (especially gas-diesel oil and residual fuel-oil).
The Council's decision to reduce the Nine's oil consumption by 5 % in 1 9 7 9 will have to be implemented over the remainder of the year
Intra-community trade
(*)
In February 1 9 7 9 trade between the Member States (based on imports) amounted to approximately 1 5 thousand million EUA (excluding the
United Kingdom), thus showing a fairly substantial increase of around 1 3 % during the first two months of this year in comparison with the
same period of 1978. This growth was particularly marked in February when intra-Community trade went up by 1 6 % over the previous
month. Italy showed the most substantial increase in its trade with its Common Market partners: purchases up by 3 0 % (and + 4 0 % between
January and February this year) and sales by 3 7 % ( + 5 8 % between January and February). The increases for France ( + 1 8 % for purchases
and + 1 7 % for sales) and Germany ( + 1 7 % and + 1 3 % respectively) were also substantial. The February balance of trade between the
Member States shows a hafty surplus for Italy ( + 3 7 8 million EUA), the Netherlands ( + 2 6 3 million EUA) and Belgium ( + 1 3 5 million EUA),
while France still has an appreciable deficit (—111 million EUA).
Community external trade
(*)
At the beginning of 1979 (first two months) the value of the European Community's imports (24.5 thousand million EUA. not including the
United Kingdom) showed a significant increase ( + 1 3 % ) compared with the same period of the previous year. In particular, the value of
Community purchases in February (1 2.3 thousand million EUA) was 1 6 % up on the same period of 1 9 7 8 and slightly higher than in January
this year.
The trend is the same for Community exports (1 1.5 thousand million EUA in February and 22.4 thousand million EUA during the first two
months of the year): + 1 1 % in January-February 1979 compared with the same period of 1 9 7 8 and + 5 % in February compared with
January this year.
At the beginning of 1 9 7 9 the Community's trade balance stood at the same deficit level as in 1 9 7 8 ( — 2.3 thousand million EUA).
Prices: even sharper rise
The consumer price index for the EC as a whole went up by 1 . 1 % between March and April 1 9 7 9 . making the sharp rate of increase
discernible since the beginning of the year even more pronounced.
For the period from January to April the average increase was 1.0%, as against 0 . 7 % for the corresponding period of 1 978.
The rises were very high in the United Kingdom (1.7%) and Italy (1.6%) high in France (1.0%) and the Netherlands (0.9%). but more
moderate in Germany (0.5%) and Denmark (0.5%). Slight rises ( 0 . 2 % in both cases) were again recorded for Belgium and Luxembourg.
The rise over 12 months for the EC as a whole amounted to 8 . 7 % . which is still lower than the rate for the United States over the same
period (10.4%).
FATTI IMPORTANTI
Disoccupazione: leggera flessione in aprile
Per la prima volta, dopo oltre sei mesi, il numero dei disoccupati iscritti è sceso, anche se di poco, sotto i 6 milioni. Infatti, con una
diminuzione di 2 2 7 0 0 0 persone, il numero dei disoccupati si situa a fine aprile 1 9 7 9 a circa 5.9 milioni.
La parte dei disoccupati nella popolazione attiva civile è passata cosi' dal 5.7 al 5 , 5 % in un mese.
Come per il mese precedente, la riduzione del numero dei disoccupati nella Comunità è un fenomeno di natura prettamente stagionale. In
dati corretti essa risulta appena dello 0 , 2 % , a fronte dello 0 . 6 % in marzo. A livello nazionale, rispetto ad aprile 1 9 7 8 . si registra una
diminuzione par la Danimarca (—16.8%). la R.F. di Germania (—12.5%) ed il Regno Unito (—7,7%): il numero dei disoccupati è aumentato
invece in Francia ( + 2 1 , 2 % ) , in Italia ( + 1 3,1%) e in Belgio ( + 5,3%).
Indice della produzione industriale — Febbraio 1 9 7 9 : Ricupero della flessione verificatasi in gennaio.
La produzione industriale della Comunità ritrova, nel febbraio 1 9 7 9 , il livello del mese di dicembre 1 9 7 8 ; l'indice della produzione industriale
della Comunità risale, dopo la correzione delle variazioni stagionali, al livello 115.3 sulla base 1 9 7 5 = 1 0 0 , con un aumento del 2 , 3 %
rispoetto a gennaio Nel mese di marzo la produzione è leggermente superiore rispetto a febbraio: tale incremento deriva dagli aumenti
verificatesi soprattutto in Germania e nel Regno Unito, da una stabilizzazione in Francia, e da flessioni in Italia e nei Paesi Bassi. L'analisi della
tendenza a breve termine degli ultimi sei mesi mostra che l'aumento è regolare e costante in Francia e nei Paesi Bassi; più incerto in
Germania e. a un livello maggiore, in Italia.
Nell'analisi per gruppo di settori, il fatto rilevante resta la mancanza di dinamismo della produzione di beni d'investimento in quasi tutti i paesi,
e più segnatamente nella R.F. di Germania ed in Francia.
Energia: Situazione difficile nel mercato petrolifero
L'economia petrolifera della Comunità durante i primi mesi del 1 9 7 9 è stata caratterizzata da due fattori che hanno determinato un profondo
cambiamento nelle condizioni del mercato. Il blocco delle esportazioni iraniane durato due mesi all'inizio del 1 9 7 9 (l'Iran rappresentava nel
1 9 7 8 circa il 1 6 % delle importazioni comunitarie di petrolio greggio proveniente da paesi terzi), associato ad un inverno rigido nei nove
paesi della Comunità, ha avuto come inevitabile conseguenza un'impennata dei prezzi tanto per il petrolio greggio e che per le consegne
"spot". I livelli delle scorte (escluse quelle di sicurezza) non erano sufficienti a frenare i meccanismi del mercato. Le ultime statistiche mettono
in evidenza un aumento delle consegne di prodotti petroliferi sul mercato interno per i primi tre mesi del 1 9 7 9 (in particolare gasolio da
autotrazione e da riscaldamento).
La decisione del Consiglio di ridurre del 5 % il consumo petrolifero dei Nove nel 1 9 7 9 dovrà essere attuata sui consumi del resto dell'anno.
Commercio intracomunitário
(")
Il volume degli scambi all'interno della Comunità (base importazioni) è stato, nel mese di febbraio 1 9 7 9 , di circa 15 mrd di UCE (escluso il
Regno Unito) e ha fatto registrare durante i primi due mesi di quest'anno un notevole incremento, dell'ordine del 1 3 % ; rispetto allo stesso
periodo dello scorso anno. Tale incremento si è accentuato soprattutto in febbraio, quando gli scambi intracomunitari hanno fatto registrare
un aumento del 1 6 % rispetto al mese precedente. L'Italia è il paese in cui l'incremento del commercio con i partners del Mercato Comune è
stato il più notevole: + 3 0 % degli acquisti ( + 4 0 % tra gennaio e fabbraio di quest'anno) e + 3 7 % delle vendite ( + 5 8 % tra gennaio e
febbraio). Non meno importante è stato l'incremento dagli scambi francesi ( + 1 8 % per gli acquisti e + 1 7 % per le vendite) e tedeschi
(rispettivamente + 1 7 % e + 1 3%).
Per quanto attiene alla bilancia commerciale del mese di febbraio tra i Paesi membri, va notato un notevole eccedente per l'Italia ( + 3 7 8
milioni di UCE). per i Paesi Bassi ( + 2 6 3 milioni di UCE) e per il Belgio ( + 1 3 5 milioni di UCE), mentre permane sensibile il deficit francese
( - 1 1 1 milioni di UCE).
Commercio estero della Comunità'
('')
Il valore delle importazioni della Comunità europea (24.5 miliardi di UCE escluso il Regno Unito) ha fatto registrare all'inizio del 1 9 7 9 (i primi
du mesi), un significativo aumento ( + 1 3 % ) rispetto allo stesso periodo dell'anno precedente. In particolare, il valore degli acquisti comunitari
in febbraio (12,3 miliardi) ha superato del 1 6 % quello del corrispondente periodo 1 9 7 8 , e di poco il livello raggiunto nel mese gennaio di
quest'anno.
Analoga tendenza si è avuta per le esportazioni (1 1,5 miliardi di UCE in febbraio, e 2 2 , 4 nei primi due mesi): + 1 1 % di gennaio febbraio
1 9 7 9 rispetto allp stesso periodo del 1 9 7 8 . e più 5 % di febbraio rispetto a gennaio di quest'anno.
La bilancia commerciale della Comunità si situa, all'inizio del 1 9 7 9 . allo stesso livello di deficit dell'anno precedente ( — 2,3 miliardi UCE).
Prezzi: Accelerazione dell'aumento
L'indice dei prezzi al consumo per la totalità dei Paesi della CE è aumentato dell' 1 . 1 % da marzo ad aprile 1979, e conferma l'accelerazione
delineatasi sin dall'inizio dell'anno.
Per il periodo da gennaio ad aprile l'aumento medio è stato dell' 1,0%. rispetto allo 0 , 7 % del corrispondente periodo 1 9 7 8 .
Gli aumenti sono stati particolarmente forti nel Regno Unito (1,7%) e in Italia ( 1 , 6 % ) ; forti in Francia (1%) e nei Paesi Bassi (0.9%), più
moderati invece nella R.F. di Germania (0,5%) e in Danimarca (0,5%). Il Belgio e il Lussemburgo hanno fatto registrare ancora una volta
degli aumenti piuttosto scarsi (0,2%).
FORORD
Denne publikation omfatter to dele: den ene indeholder
»fælles-skabstabeller« og den anden »tabeller efter lande«.
I »fællesskabstabelleme« er samlet de vigtigste indikatorer for
Fælles-skabets og for hver medlemsstats økonomiske udvikling på kort sigt.
uddybet med nogle strukturelle oplysninger for året 1975. Denne
del, som skal muliggøre sammenligninger mellem landene,
indehol-der indehol-der for kun af EUROSTAT harmoniserede tal, på grundlag af
fælles kriterier, hvilket forklarer visse uoverensstemmelser med de
nationale tal.
Rækkerne er korrigerede for sæsonvariationer ved hjælp af
EURO-STATS »Dainties«-metode.
De mest aktuelle tal er foreløbige og i
visse tilfælde direkte skønnede af EUROSTAT.
Som indikator for verdenskonjunkturudviklingen indeholder
»fælles-skabstabelleme« en søjle for USA.
I »tabellerne efter lande« er for hvert land udvalgt de for det
pågældende land mest anvendte konjunkturelle indikatorer; det drejer
sig om nationale rækker, i overensstemmelse med nationale kriterier
og sæsonkorrigerede efter nationale metoder. I denne del er der ud
over Fællesskabets ni medlemslande medtaget kandidatlandene
Spa-nien. Grækenland og Portugal, såvel som USA og Japan
For alle rækkerne findes de historiske tal (årlige, kvartals- og
måneds-tal) i EUROSTATS databank CRONOS. Almindeligvis går tallene
tilbage til 1 9 6 0 . og kan oplyses på anmodning.
Denne publikation indeholder kun et yderst minimalt antal
metodolo-giske bemærkninger. Oplysninger om definitioner, metoder,
fælles-skabstilpasninger og kilder for hver enkelt række vil blive givet i en
specialudgave af »EUROSTATISTIK«, hvori de statistiske angivelsers
definitioner, metoder, tilpasninger og kilder vil blive beskrevet.
Der udkommer to udgaver af »EUROSTATISTIK« hver måned. Den
ene affattet på dansk, engelsk og italiensk leveres til trykning den
fjerde tirsdag hver måned, og vil kunne fås i hovedstæderne den
følgende mandag Den anden affattet på tysk, fransk og nederlandsk
leveres til trykning den anden tirsdag hver måned, og vil kunne fås i
hovedstæderne den følgende mandag. Hver udgave indeholder de
mest aktuelle tal til disposition den dag leveringen til trykning finder
sted.
PREFACE
This bulletin is in two parts : 'Community Tables' and 'Country
Tables'.
The Community Tables contain the main indicators useful for
follow-ing short-term economic developments in the Community as a whole
and in the Member States, supplemented by a certain amount of
structural data relating to 1 9 7 5 . This part of the bulletin is intended
to make possible real comparisons between countries and therefore
only contains data which has been harmonized by EUROSTAT on the
basis of common criteria, this explains many of the differences from
national series.
Seasonal adjustement of the series has been done with EUROSTAT's
own method, 'Dainties'.
The most recent data are provisional and
in some cases estimated by EUROSTAT.
Finally the Community Tables include a column for the USA as an
indicator of changes in the world economy.
The Country Tables contain a selection of the economic indicators
most often used in each country. They are national series based on
the definitions of the country concerned and seasonally adjusted by
the country. In addition to the nine Community countries this section
includes the three candidate countries (Spain. Greece and Portugal)
the USA and Japan.
For all series, historical data (annual, quarterly or monthly) is
availa-ble in EUROSTAT's CRONOS data bank, going back in most cases to
1 9 6 0 . This can be supplied on request.
This publication contains the absolute minimum of methodological
notes. Details of definitions, methods. Community adjustments and
sources of each series will be given in a special edition of
'Eurosta-tistics'.
Two versions of 'EUROSTATISTICS' come out every month. The first
in Danish, English and Italian goes to the printers the fourth Tuesday
of the month and will be distributed in the national capitals the
following Monday. The second in German, French and Dutch goes to
the printers the second Tuesday of the month and will be distributed
in the national capitals the following Monday. Each version will
contain the latest figures available when it went to press.
AVVERTENZA
Il presente bollettino consta di 2 parti : l'una ha per oggetto alcune
« tavole comunitarie », l'altra riguarda alcune « tavole per paese ».
Nelle tavole « comunitarie » si trovano riuniti i principali indicatori che
consentono di seguire l'evoluzione di breve periodo dell'economia
comunitaria nel suo complesso e in ogni singolo Stato membro,
completati da alcuni dati strutturali relativi al 1 9 7 5 . Questa parte,
che si prefigge di consentire di stabilire confronti reali fra paesi,
contiene soltanto dati armonizzati dall'EUROSTAT in base a criteri
comuni, il che spiega l'esistenza di certe differenze rispetto ai dati
nazionali.
Le variazioni stagionali delle serie sono eliminate con il metodo
« Dainties » dell'EUROSTAT.
I dati più recenti sono provvisori e, a
volte direttamente stimati da EUROSTAT.
Nelle tavole comunitarie figura una colonna relativa agli Stati Uniti
d'America a titolo di indicatore dell'evoluzione della congiuntura
mondiale.
Nelle « tavole per paesi » si riporta una selezione degli indicatori
congiunturali più correntemente adoperati in ogni paese; si tratta di
serie nazionali, corrispondenti ai criteri nazionali e «
destagionaliz-zate » per mezzo dei metodi nazionali. In questa parte sono presi in
considerazione oltre ai 9 paesi membri della Comunità, i paesi
candidati all'adesione: Grecia, Portogallo. Spagna, nonché gli Stati
Uniti d'America e il Giappone.
Per tutte le sene, presso il sistema CRONOS dell'EUROSTAT sono
disponibili dati storici (annui, trimestrali o mensili) risalenti in
generale al 1 9 6 0 . i quali possono essere forniti su richiesta.
La presente pubblicazione contiene soltanto annotazioni
metodolo-giche ridotte allo stretto minimo. Le informazioni relative alle
defini-zioni, ai metodi, agli aggiornamenti comunitari e alle fonti di ogni
serie saranno riportate in un fascicolo speciale (ad hoc) di
EUROSTATISTICHE avente per oggetto le definizioni, i metodi, gli
aggiornamenti e le fonti dei dati statistici.
INDHOLD
Forord
Tegn og forkortelser
I.
FÆLLESSKABSTABELLER
1.
Nationalregnskaber ens
Mængdeudvikling
Prisudvikling
2
Beskæftigelse
Befolkning
Beskæftigelse
3.
Arbejdsløshed
4.
Indeks for industriproduktion (1 )
Industri, bygge og anlægsvirksomhed
Produktion efter kategori
Produktion efter branche
Produktion for brancher i vanskeligheder
5
Industriens forventninger (2)
6.
Produktion
Industriprodukter
Landbrugsprodukter
7
Udenrigshandel (3)
Vigtigste indikatorer
Handel med tredjelande
Handel med EFlande
Handel efter lande
8
Priser
Forbrugerprisindeks
Producentprisindeks
Lønninger
9.
Pengeog finansstatistik
Valutakurser
Vigtigste penge og finansstatistikker
10
Betalingsbalance
Vigtigste saldi
II. TABELLER EFTER LANDE
EUR 9
—
BR Deutschland
—
France
—
Italia
—
Nederland
—
Belgique — België
—
Luxembourg
—
United Kingdom
—
Ireland
—
Danmark
USA
ARTIKEL
LIGE UDKOMMET
(1) Mere detaljerede oplysninger efter brancher findes ι publikationen
»Industriens Konjunkturindikatorer«
(2) Oplysningerne ι delte afsnit af publikationen svarer til resultaterne
af kon|unkturundersogelsen hos virksomhedsledere ι
Fællesskabe! Mere detaljerede oplysninger findes ι »Europæisk
Side
Page
83
89 9 0
CONTENTS
Preface
Symbols and abbreviations
COMMUNITY TABLES
11
1 1
12
13
13
13
16
19
19
2 0
21
23
25
29
29
33
3 4
3 4
37
4 3
4 9
53
53
56
57
58
58
59
62
62
67
73
74
75
76
77
78
79
8 0
81
82
1.
2
3.
4.
5.
6
7
8
9.
10.
National accounts esa
Volume
Price
Employment
Population
Employment
Unemployment
Index of industrial production (1
Industry, construction
Production by category
Production by branch
Branches in difficulty
Opinions in industry (2)
Output
Industrial products
Agricultural products
External trade (3)
Main indicators
ExtraCommunity trade
IntraCommunity trade
Trade by country
Prices
Consumer prices
Producer prices
Wages and salaries in industry
Financial statistics
Exchange rates
Main financial statistics
Balance of payments
Main balances
II. TABLES BY COUNTRY
—
—
EUR 9
BR Deutschland
France
Italia
Nederland
Belgique — België
Luxembourg
United Kingdom
Ireland
Danmark
USA
ARTICLE
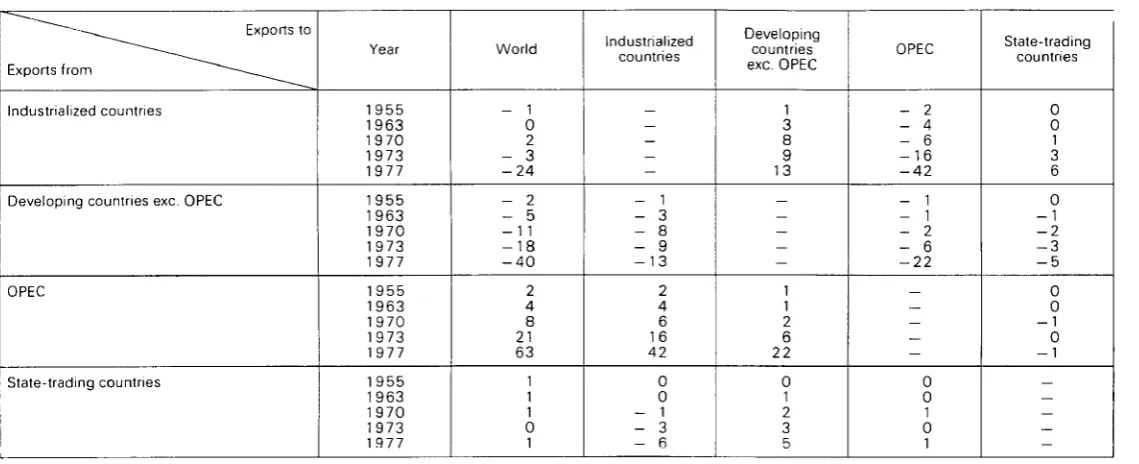
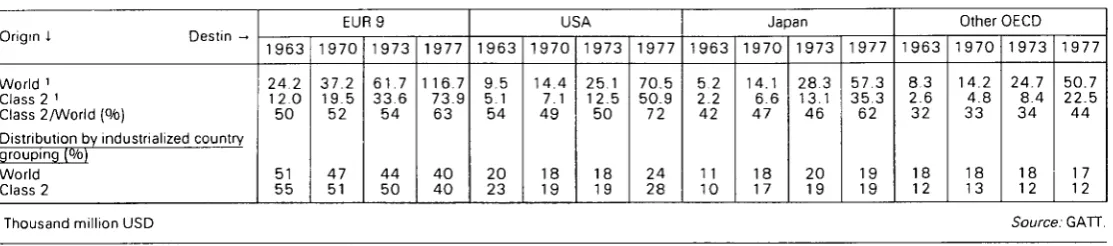
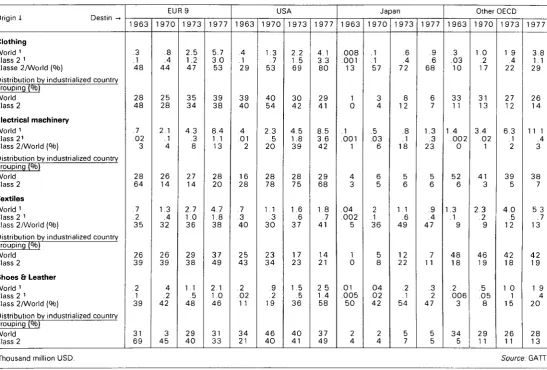
Analysis of trade between the developed and
developing world. 1 9 5 5 1 9 7 7
JUST PUBLISHED
(1) More detailed data by branch appears in 'Industrial Shortterm
Trends'
INDICE
Avvertenza
Segni e abbreviazioni utilizzati
I. TAVOLE COMUNITARIE
1.
Conti nazionali sec
Evoluzione in volume
Evoluzione dei prezzi
2.
Occupazione
Popolazione
Occupazione
3.
Disoccupazione
4.
Indici della produzione
industriale (1)
Industria, costruzione
Produzione per categoria
Produzione per branca
Produzione dei settori in difficoltà
5.
Opinioni nell'industria (2)
6.
Produzione
Prodotti industriali
Prodotti agricoli
7
Commercio estero (3)
Principali indicatori
Commercio extracomunitario
Commercio intracomunitario
Commercio per paese
8.
Prezzi
Prezzi al consumo
Prezzi alla produzione
Salari nell'industria
9.
Statistiche finanziarie
Tassi di cambio
Principali statistiche finanziarie
10.
Bilancia dei pagamenti
II. TAVOLE PER PAESE
EUR 9
—
BR Deutschland
—
France
—
Italia
—
Nederland
—
Belgique/België
—
Luxembourg
—
United Kingdom
—
Ireland
—
Danmark
—
USA
ARTICOLO
DI RECENTE PUBBLICAZIONE
(1) Alcuni dati più dettagliati per branca sono riportati nel bollettino « Indicatori congiunturali dell'industria ».
(2) I dati contenuti in questa parte del bollettino rappresentano ι risultati dell'indagine sulla congiuntura presso i capi di impresa delle Comunità. Alcuni dati più particolari figurano in « Economia europea ».
(3) Alcuni dati del commercio estero più dettagliati ed espressi in UCE sono riportati nel « Bollettino mensile del commercio estero »
Pagina
5
1 1
1 1
12
13
13
13
16
19
19
20
21
23
25
29
29
33
34
34
37
43
49
53
53
56
57
58
58
59
62
67
73
74
75
76
77
78
79
80
81
82
83
91
Die deutsche Fassung dieses Bulletins wird am
zweiten Dienstag jeden Monats in Druck gegeben
La version française de ce bulletin est mise sous
presse le second mardi de chaque mois.
TEGN OG FORKORTELSER
SYMBOLS AND ABBREVIATIONS
SEGNI E ABBREVIAZIONI CONVENZIONALI
- Nul
0 Mindre end det halve af den
anvendte enhed
: Oplysning foreligger ikke
1-4
1 til 4
6 + 8 6 og 8
% Procent
%,
T4/T0
Procentvis stigning for ét kvartal i
forhold til samme kvartal året før
%,
T12/T0
Procentvis stigning for én måned i
forhold til samme måned året før
"/o.
Saldo
Saldo for positive svar (stigning,
forbedring af situationen) og
negative svar (fald, forværring af
situationen) fra
konjunkturundersøgelsen hos
virksomhedsledere i Fællesskabet
* Sæsonkorrigeret (tabeller efter
lande)
1975
=
100
Basisår
EUR
9 = 1
00
Procentvise tal i forhold til
Fællesskabet ( = 1 0 0 )
Mio
Million
Mrd
Milliard
t Metrisk ton
TOE
Ton råolieækvivalent
GWh
Gigawattime= 1 O
6kWh
M3 Kubikmeter
DM
Tyske mark
FF
Franske francs
LIT
Italienske lire
HFL
Gylden
BFR
Belgiske francs
LFR
Luxembourgske francs
UKL
Pund sterling
IRL
Irske pund
DKR
Danske kroner
USD
US-dollars
ERE
Europæisk regningsenhed
SDR
Særlige trækningsrettigheder
EF
Det europæiske Fællesskab
EUROSTAT
De europæiske Fællesskabers
statistiske Kontor
EUR
9 EF-medlemsstaterne i alt
ACP
Lande i Afrika, Karibien og
Stillehavet i henhold til
Lomé-konventionen
ENS
Europæisk
nationalregnskabssystem
NACE
Systematisk fortegnelse over
- Nil
0 Data less than half the unit used
: No data available
1-4
from 1 to 4
6 + 8 6 and 8
% Percent
'/•T4/T0
Percentage increase on the
corresponding quarter of the
previous year
'/·,
T12/T0
Percentage increase on the
corresponding month of the
previous year
%,
Balance
Balance between positive replies
(increase, improvement in the
situation) and negative replies
(reduction, worsening of the
situation) in the short-term trends
enquiry conducted among heads of
enterprises in the Community
* Seasonally adjusted (Tables by
country)
1975=100
Reference year
EUR
9 =
100
Data for countries expressed as a
percentage of the Community total
Mio
Million
Mrd
Thousand million
t metric tonne
TOE
Tonnes of oil equivalent
GWh
Gigawatt hour ( = 1 0
6kWh)
M3 Cubic metre
DM
Deutsche Mark
FF
French franc
UT
Italian lire
HFL
Guilder
BFR
Belgian franc
LFR
Luxembourg franc
UKL
Pound sterling
IRL
Irish pound
DKR
Danish crown
USD
US dollar
EUA
European unit of account
SDR
Special Drawing Rights
EC
European Communities
EUROSTAT
Statistical Office of the European
Communities
EUR
9 Total of the member countries of the
EC
ACP
African, Caribbean and Pacific
countries of the Lomé Convention
ESA
European System of Integrated
Economic Accounts
NACE
General Industrial Classification of
— Il fenomeno non esiste
0 Dato inferiore alla metà dell'unità
indicata
: Dato non disponibile
1-4 Da 1 a 4
6 + 8 6 e 8
% Percentuale
%,
T4/T0
Incremento in percentuale di un
trimestre rispetto
a
quello
corrispondente dell'anno
precedente
%,
T12/T0
Incremento in percentuale di un
mese rispetto al mese
corrispondente dell'anno
precedente
%,
Saldo
Saldo fra le risposte positive
(incremento, miglioramento della
situazione) e le risposte negative
(diminuzione, deterioramento della
situazione) registrate nell'indagine
congiunturale eseguita presso gli
imprenditori della Comunità
* Destagionalizzato (tavole per paese)
1975
EUR 9=
100
Anno di base
=
100
Dati dei paesi espressi in
percentuale della Comunità ( = 1 00)
Mio
Milione
Mrd
Miliardo
t Tonnellata metrica
TEP
Tonnellata equivalente petrolio
GWh
Gigawattora= 1 0
6kWh
M3 Metro cubo
DM
Marco tedesco
FF
Franco francese
LIT
Lira italiana
HFL
Fiorino
BFR
Franco belga
LFR
Franco lussemburghese
UKL
Lira sterlina
IRL
Sterlina irlandese
DKR
Corona danese
USD
Dollaro USA
(UCE)
Unità di conto europea
(DSP)
Diritti speciali di prelievo
CE
Comunità europee
EUROSTAT
Istituto statistico delle Comunità
europee
EUR
9 Totale dei paesi membri della CE
ACP
Stati d'Africa, dei Caraibi e del
Pacifico — Convenzione di Lomé
SEC
Sistema europeo di conti economici
integrati
Arbejdsloeshed Unemployment 11 000)
Disoccupazione
J F M A M J J A S O N D J F M A M J J A S O
1975
1976
N D J F M A M J J A S 0 N D J F M A M J J A S O N D
1977
1978
Induslnproduklion Trend
Industrial produktion Trend
(1975 100)
Produzione industriale Tendenza
F M A M J J A S O N D J F M A M J J A S O N D J F M A M J J A S O N D J F M A M J J A S O N D
1975
1976
1977
1978
60 _, 50
40 3 0 | 20
IO 0 1 0 20 30 4 0 5 0 6 0 7 0 80
Produktionsforventmnger Faerdigvarelagre Ordrebeholdning |% Saldo)
Production expectations· Stocks of finished products Order books
|% Balance)
Prospettive di produzione* Giacenze di prodotti finiti Ordinativi industriali |% Saldo)
X
„ "
y
_ l I I I L_
F M A M J J A S O N D J F M A M J J A S O N D J F M A M J J A S O N D J F M A M J J A S O N D
1975
1976
1977
1978
17 000. 16 000. 15 000. 14 000. 13 000. 12 000. 11 000. 10 000
9 000
Import fra tredjelande Eksport til tredjelande ¡Mio ERE)
Imports extraEC Exports extraEC (Mio EUA)
Importazioni extraCE Esportzaioni extraCE (Mio UCE|
_ l ι I L_
F M A M J J A S O N D J F M A M J J A S O N D J F M A M J J A S O N D J F M A M J J A S O N D
1975
1976
1977
1978
Forbrugerprisindeks Stigning %o Tl 2/TO
Consumer prices Increase Ή» Tl 2/TO
8.0
1.6
1.2
ε.8
6.4
6.0
5.6
5.2
4.8
4.4
4.0
3.6
3.2
2.8
2.4
2.0
1.8
1.2
0.8
0.4
0.
REGISTRERET LEDIGHED
_ ^ _ I ALT
Ξ ~ Ξ ' ALT/SAESONKORRIGERET ~ _ rlAEND/SAESONKORRIGERET KUINDER/SAESONKORRIGERET
REGISTERED UNEPIPLOTHENT
EUR9 ΠΙΟ_ _
TOTAL
¡ΤΤΞ TOTAL/SEASONALLY AOJUSTED
Γ _
HEN/SEASONALLY AOJUSTED
UOMEN/SEASOSALLT ADJUSTED
DISOCCUPATI ISCRITTI
TOTALE
TOTALE/DESTAGIONALIZZATO 1M1IHI/DESTAGI0NALIZZATÕ DOWfE/DESTACIOKALIZZATO
- y
. I I I I -I I . 1 — 1 — 1 ι ι ι ι ι ι ι ι ι ι ι I I L . J — 1 _ -I Ι Ι Ι .1 ι ι ι ι ι ι ι ι ι ι
Θ.Ο
1.G
1.2
G.B
G.4
G.0
5.G
5.2
4.8
i.¿
4.0
3.G
3.2
2.8
2.4
2.0
1.6
1.2
0.8
0.4
0.
J F H A I l J J A S O N D J F U t l J J A S O N D J F H A H J J A S O N D J F n * n J J A S O N D J F H A I 1 J J A S O N O
1915
1916
1911
1918
1919
Produktionsforventninger: Saldo for positive svar (forbedring af situationen) og negative svar (forværring af situationen).
Færdigvarelagre: Saldo for positive svar (større end normalt) og negative svar (lavere end normalt).
Ordrebeholdning: Saldo for positive svar (forbedring af situationen) or negative svar (forværring af situationen).
Production expectations: Balance between positive replies (improvement in the situation) and negative replies (worsening of the situation)
Stocks of finished products: Balance between positive replies (above normal) and negative replies (below normal).
Order books: Balance between positive replies (improvement in the situation) and negative replies (worsening of the situation).
Prospettive di produzione : Saldo fra le risposte positive (miglioramento della situazione) e le risposte negative (deterioramento della situazione)
Giacenze di prodotti finiti : Saldo fra le risposte positive (superiori al normale) e le risposte negative (inferiori al normale).
ARBEJDSLOESHED UNErlPLOÏrlENT
1 0 0 π 0 0 0
DISOCCUPAZIONE
DE FR IT
20
19
18 L
11
16
15
l4
13
12
11
10 L /
1
6
5
i . 3
2
-1 0
^*
. * * . . * — '
V
/ '
/ *
UK
I I I I I 1 I I I I I I I I 1 I I I 1 I i—I 1 I I I I I I I ' I ! i ! I 1 I I I I I I I ! 1 t i l l I I t _ l I I L 20 19 16
11
IG
15
1Í
13 12
11
10
3
6
1
6
5
i
3 2 1 0 J F Ö A I 1 J J i S O l l O J F n i f l J J A S O N D J F f l A l U J A S O ü O J F I I A n J J A S O N B J F M H J J A S O N D
1915
1916
1911
1918
1919
40
38
36
34
32
30
28
26
24
22
20
18
16
14
12
10
8
6
4
2
ARBEJDSLOESHED
NL
UNEriPLOïriENT
1 0 α 0 0 0
DISOCCUPAZIONE
«. BG IR
+ "·
«*
. > '
.*»/
' s . * " '
* * '
**
ί
- '
.... DK
36
34
32 30 2Β 2G 24 22 20 •IB IG 1Í
12
10 β
G
£
120 119 116 111 116 115 114 113 112 111 110 109 108 101 106 105 104 103 102 101 100 99 98 91 96 95
INDUSTRIPRODUKT ION
TREND EUR-9
^ ^ ^ ^ INDUSTRIHACE 1i
_ _ _ tlELLEnPROnUKTEfl _ _ INUESTERINUStirJIlER _ . . KoHaHucscooen
INDUSTRIAL PRODUCTION
TREND EUR9
■isis = loo
fm^m INDUSTRYNAOE ' l i , _ IHTERflEDIATE UOODS_ iüUEsrnëNT conns LONRUflPTION ennps
PRODUZIONE INDUSTRIALE
TENDENZA EUR-9
^ ^ INDUSTRIE NAL'E 1-«
_ BENI INTERMEDI
_ . BENI FINALI INUESTIHENTi)
BENI FINALI DI CONSUnO
J F 11 A f l J J A S O » D J F Γ Α Π J J A S O N D J F Π Λ ΓΙ J J A S O » D J F II Α Β J J A S 0 II D J F H f l J J A 5 O » D
1915
1916
1911
1918
1919
130
125
120
115
110
105
100
95
FORBRUGERPRISINDEKS
SAMLET INDEKS_ _ DE
CONSUTIER PRICES
GENERAL INDEX1915 = 100
PREZZI AL CONSUNO
INDICE GENERALE_ _ NL BG LG
S
i * * * * ' "
s*
s?
*r*/>
^
· /
y
*
'
¿ V ^ - - "
90
L L L I I I ' I ι ι ι ι ι I : I I I I I I I I I I ι ι ι I I ι ι ι ι ι ι ι ι ι I I I 1 I I ' I I ' '130
125
120
115
110
105
100
90 0 . . J F Í l A n J J A S O N D J F r l A r i J J A S O N D J F r i A r l J J A S O N D J F n A r l J J A S O N D J F I I A r i J J A S O N D
185
180
115
110
165
160
155
150
145
140
135
130
125
120
115
110
105
100
95
90
ρ — ·
:
/*
* * /
/
85
FORBRUGERPRISINDEKS
SAJILET INDEKS
■ F R —
2,5 i FORECAAENOE MALESTOK IT
CONSUPIER PRICES
GENERAL INDEX 1 9 1 5 = 1 0 0 _ _ _ UK SCALE OF PflEUIOUS GRAPH ι 2.5
P R E Z Z I AL CONSUMIÓ
INDICE GENERALE
I R DK
SCALA DEL PRECEDENTE ι 2/5
■ > ■ *
, /
Sj
, *
.''Ut
_1 I I I I l__l I I I I u _ 1 t — I ¡ I I ! I I I ! 1 I I I I ! I I I I I I I 1 I ! I 1 I 1 I I I I I I 1 — 1 I I I I
1Θ5 180 115
no
1«5
160
155
150 145 WO 135 130 125 120 115 110 105 100 95 90
J F H f l J J A S O I I D J F f l A f l J J A S O N O J F f l A I I J J A S O H D J F T A r j J A S O N D J F H A H J J A S O I D
1915
1916
1911
1918
1919
' I M L U T A K U R S E R EXCHANGE RATE CORSO DEI CAMBI
1.40 1.38 1.36 1.34 1.32 1.30 1.28 1.26 1.24 1.22 1.20 1.18 1.16 1.14 1.12 1.10 1.08 1.06 1.04 1.02 1.00 0.98 0.96 0.94 0.92
1 ERE = ...SOR 1 ERE = . . . $
/ \
/ - ι
1 EUA = ...SDR . 1 EUA = . . . S
1 UGE = ...DSP 1 UCE = . . . S
\ /
NATIONALREGNSKABER ENS
NATIONAL ACCOUNTS ESA
CONTI NAZIONALI SEC
EUR-9 B.R.
DEUTSCHLAND F R A N C E N E D E R L A N D
B E L G I Q U E
BELGIË LUXEMBOURG
U N I T E D
KINGDOM IRELAND DANMARK U.S.A.
0 0 1 - BRUTTONATIONALPROOUKT
MAENGOEUDVIKLING
1975 |
1975
1976
1977
1978
1 9 7 5 III IV 1 9 7 6 I
II III IV 1 9 7 7 I
It III IV 1 9 7 8 I
II III IV
1 0 0 . 0
1 0 0 . 0 104.8 107.2 1 10.3
- 3 . 1 + 1.2 + 4.2 + 4.8 + 5.3 + 5.1 + 3.5 + 2.0
+ 2.2 + 1.6 + 1.7 + 3.6 + 3.2 + 3.6
0 0 2 - PRIVAT KONSUM
MAENGOEUDVIKLING
1975
1975
1976
1977
1978
1 9 7 5 III IV 1 9 7 6 I
II III IV 1 9 7 7 I
III IV 1 9 7 8 I
II III IV
1 0 0 , 0
100.0 103.6 105.7 109.5
+ 1.1 + 2.8 + 3.6 + 3.1 + 3.4 + 3.1 + 1.5 + 1.9 + 2.8 + 2.1 + 3.9 + 4.3 + 3.7 + 4.1
2 7 . 8
100.0 105.0 107.9 1 11.2
- 3 . 0 + 1.6 + 5.0 + 5.4 + 4.7 + 4.9 + 3.7 + 2.1 + 3.0 + 2.3 + 1.5 + 3.8 + 3.4 + 3.5
27.1
100.0 103.6 106.3 110.2
+ 2.7 + 3.9 + 5.0 + 3.0 + 2.7 + 3.4 + 2.2 + 3.0 + 4.4 + 2.8 + 3.9 + 4.2 + 3.3 + 3.6
0 0 3 - FASTE BRUTTOINVESTERINGER
MAENGDEUDVIKUNG
1975
1975
1976
1977
1978
1 9 7 5 III IV 1 9 7 6 I
II III IV 1 9 7 7 I
II III IV 1 9 7 8 I
II III IV
100.0
100.0 103.0 104.3 107.2
- 4 . 7 - 1 . 4 + 0.8 + 3.6 + 2.1 + 2.5 + 4 . 0 + 1.1 + 2.0 + 0.6 - 0 . 6 + 2.6 + 3.2 + 3.9
28.9
100.0 104.7 108.9 1 15.7
- 3 . 6 + 1.8 + 1.8 + 7.5 + 3.6 + 5.4 + 7.7 + 2.1 + 4.6 + 2.4 + 0.4 + 7.4 + 8.0 + 8.1
2 3 . 0
100.0 104.6 107.8 1 1 1.0
- 0 . 6 + 3.1 + 5.0 + 5.1 + 5.3 + 4.2 + 4.3 + 2.9 + 2.7 + 2.0 + 1.8 + 3.9 + 3.1 + 4.4
22.5
1 0 0 . 0 105.3 108.3 1 1 1.7
+ 3.9 + 6.5 + 6.3 + 6.0 + 5.1 + 4.2 + 3.8 + 2.4 + 3.1 + 2.3 + 3.3 + 5.3 + 3.3 + 4.1
26.4
1 0 0 . 0 103.7 103.7 1 0 4 . 0
- 4 . 3 + 1.9 + 5.3 + 4.8 + 4.1 + 0.7 + 1.9 - 1 . 4 + 1.1 - 0 . 7 - 3 . 5 + 0.5 - 0 . 3 + 1.4
GROSS DOMESTIC PRODUCT
CHANGE IN VOLUME
15.7
100.0 105.9 108.0 1 10.8
- 4 . 5 + 0.6 + 3.7 + 6.6 + 6.2 + 7.0 + 5.7 + 2.0 + 1.4 - 1 . 0 - 0 . 1 + 2.0 + 2.8 + 5.6
EUR9
-5.7
1 9 7 5 -100.0 104.7 107.0 109.6
1 0 0 1 0 0
<¥a, T 4 / T 0
-4.1
1 0 0 . 0 105,6 106.9 108.8
- 3 . 8 - 1 . 4 + 0.3 + 5.8 + 7.3 + 6.6 + 4.9 + 1.8 + 0.6 + 0.7 + 2,5 + 1.4 + 2.1
CONSUMPTION BY HOUSEHOLDS
16.1
100.0 103.6 105.9 108.9
- 0 . 4 + 3.1 + 4.3 + 3.4 + 3.9 + 2.0 - 1 . 3 + 2.9 + 3.1 + 3.7 + 4.0 + 2.0 + 2.2 + 2.3
CHANGE IN VOLUME
EUR9 =
5.6
1 9 7 5 = 100.0 103.2 107.2 111.0
1 0 0 1 0 0
<*>. T 4 / T 0
+ 1.9 + 4.8 + 4.4 + 5.1 + 4 . 0 + 1.7 + 4.0 + 4.8 + 5.8 + 4.6 + 5.5 + 2.8 + 2.8 + 2.6
4.1
loo.o
1 0 6 . 0 108.2 110.4
+ 0.5 + 1.4 + 1.7 + 4.3 + 4,7 + 2.5 + 4.8 + 3.6 + 1.0 + 1.9 + 3.4 + 2.1 + 3.0
GROSS FIXED CAPITAL FORMATION
CHANGE IN VOLUME
15.8
100.0 102.3 102.4 101.9
- 1 5 . 2 - 1 1 . 4 - 2 . 7 + 2.5 + 3.4 + 6.4 + 5.7 + 1.0 - 1 . 5 - 4 . 8 - 5 . 3 - 2 . 8 + 1.0 + 5.8
EUR9 =
5.6
1 9 7 5 -100.0
98.2 109.1 1 12.7
1 0 0 1 0 0
% , T 4 / T 0
- 6 . 0 + 2.9 - 6 . 4 - 2 . 0 + 0.4 + 0.8 + 16.4 + 11.1 + 10.6 + 5.9 + 1.9 + 5.6 + 4.3 + 1.5
4.4
1 0 0 . 0 102.5 101.6 103.1
- 1 . 3 - 3 . 6 - 5 . 6 - 0 . 8 - 2 . 5
+ 1.5 + 8.5
+ 7.9 + 8.5 + 2.5 - 1 . 4 - 1 . 9
0.2
loo.o
102,2 103.6 106.9
0.2
100.0 103.1 104.6 106.5
0.2
1 0 0 . 0 102.7 100.0 102.5
20.5
1 0 0 . 0 103.6 1 0 4 . 8 108.3
- 4 . 6 - 0 . 6 + 3.5 + 2.2 + 5.1 + 4.6 + 0.5 + 1.0 + 1.7 + 2.3 + 3,4 + 4.7 + 3.7 + 1.5
21.4
1 0 0 . 0 100.8 100.3 105.8
- 3 . 1 - 1 . 6 - 0 . 7 + 1.8 + 2.8 - 0 . 9 - 1 . 8 - 0 . 4 - 0 . 6 + 4.3 + 6.0 + 6.2 + 5.4
15.7
1 0 0 . 0 9 8 . 8 9 5 . 0 97.9
+ 2.6 - 4 . 0 - 0 . 9 - 1 . 2 - 3 . 3 - 2 . 7 - 6 . 5 - 1 . 9 - 2 . 3 + 2.4 + 6.8 + 3.0 + 1.8 - 0 . 4
0.7
loo.o
102.9 108.6 1 15.1
PRODOTTO INTERNO LORDO
EVOLUZIONE DEL VOLUME
2.2 |
1 0 0 . 0 106,3 108.3 109.4
-100.0 105.6 110.6
+ 0.4 + 2.7 + 7.2 + 6.9 + 5.0 + 4.6 + 4.0 + 4.2 + 4.7 + 5.2 + 3.6 + 4.3 + 3.6 + 4.4
CONSUMI PRIVATI
EVOLUZIONE DEL VOLUME
0.8
100.0 102.7 108.8 1 17.4
2.1 |
100.0 105.2 106.0 105.5
-NVESTIMENTI
1 0 0 . 0 1 0 5 . 8 110.6
+ 1.8 + 5.3 + 6.6 + 5.9 + 5.4 + 5.9 + 4.9 + 4.2 + 4.3 + 4.4 + 3.2 + 4.3 + 4.3 + 4.0
FISSI LORDI
EVOLUZIONE DEL VOLUME
0.7
100.0 106.3 1 14.4 126.4
2.3 |
1 0 0 , 0 116.6 1 1 4 . 5 1 1 5 . 2
100.0 106.2 1 16.4
- 14.0 - 6 . 1 + 3.6
+ 9.5
NATIONALREGNSKABER ENS
NATIONAL ACCOUNTS ESA
CONTI NAZIONALI SEC
EUR9 BR.
DEUTSCHLAND
0 0 4 ■ BRUTTONATIONALPRODUKT PRISUDVIKLING
1 9 7 5 | 1 0 0 . 0
1 9 7 6 1 9 7 7 1 9 7 8
1 10.6 1 2 2 . 0 1 3 2 . 8
1 9 7 5 III IV 1 9 7 6 1 II III IV 1 9 7 7 1 II III IV 1 9 7 8 I II III IV
14.2 1 2 . 4 10.3 9.9 9,7 1 0 . 4 10.1 10.2 10.2 9.1 8.9 8.1 8.4 8.7
0 0 5 PRIVAT KONSUM PRISUDVIKLING
1 9 7 5 | 1 0 0 . 0
1 9 7 6 1 9 7 7 1 9 7 8
1 1 1 . 2 1 2 2 . 9 1 3 2 . 9
1 9 7 5 IV | 1 2 . 0
1 9 7 6 I II III IV 1 9 7 7 1 II III IV 1 9 7 8 I II III IV
11.2 1 0 . 4 9.9 10.8 10.7 10.7 10.3 8.8 8.0 7.2 7.1 7.3
1 9 7 9 I |
1 0 0 . 0 1 0 3 . 2 1 0 7 . 1 1 1 1.3
6.1 4.7 3.3 3.0 3.2 3.4 3.4 3.4 4.2 4 . 0 4.2 3.6 4.2 3.8
1 0 0 . 0 1 0 4 . 5 108.5 1 1 1.3
5.8 5,4 4,7 4.2 3,8 3.8 3.9 3.8 3.5 3,1 2.7 2.4 2.2
0 0 6 FASTE BRUTTOINVESTERINGER PRISUDVIKLING
1 9 7 5 | 1 0 0 . 0
1 9 7 6 1 9 7 7 1 9 7 8
1 1 0 . 8 1 2 0 . 9 1 2 9 . 8
1 9 7 5 III IV 1 9 7 6 I II III IV 1 9 7 7 I II III IV 1 9 7 8 I II III IV
1 1 . 4 9.6 9.3 10.3
1 1.2 1 2 . 0 10.8 9.6 8.4 7.5 7,4 6.6 8.0 7.8
1 0 0 . 0 103.2 1 0 6 . 6 1 1 1 . 4
2.7 2.9 2.9 3.0 3.4 3.4 3.4 3.2 3.4 3.4 3,9 3.9 4.9 4,8
FRANCE
1 0 0 . 0 110.0 1 19.5 131.5
1 1.8 10.3 1 0 . 0 9.0 9.5 9.4 7.9 8.6 8.5 8.8 9.2 9.4 10.5 10.2
100.0 109.7 119.2 130.6
9.6 9.9 9.3 9.7 9.8 8.4 9.1 8.7 8.5 9.1 9.0 9.4 10,1
1 0 0 . 0 111.1 120.7 130.9
10.3 8.0 8.2 10.5 12.4 13.3 10.1 9.7 7.4 6.8 7.9 5.8 7.2 7,2
ITALIA NEDERLAND B E L G I Q U E
B E L G I Ë
GROSS DOMESTIC PRODUCT CHANGE IN PRICE
1 9 7 5 = 1 0 0
1 0 0 . 0 1 0 0 . 0 1 0 0 . 0 1 1 8 . 0 1 0 8 . 4 107.5
140.3 1 1 6 . 4 114,9
1 5 9 . 0 1 2 2 . 9 1 1 9 , 6
°h, T 4 / T 0
15,2 12,1
11,4 9.0
13,3 7,7
17,1 6,1
18,6 8,2
2 2 , 4 10.8
2 2 . 3 9.2
19.9 8.5
18.5 8.1
1 6 . 0 5.5
1 3 . 4 4.5
13.3 4.4
13.6 1.4
12.7
CONSUMPTION BY HOUSEHOLDS CHANGE IN PRICE
1 9 7 5 = 1 0 0
l o o . o l o o . o l o o . o 1 1 8 . 1 1 0 9 . 1 107.7
139,5 1 1 6 , 6 114,6
157,3 1 2 1 . 8 119.3
% , T 4 / T 0
10.1 9.5
9.2 1 0 . 0
9.5 9.2
8.2 8.6
8.9 7.8
7.2 6.6
7.2 6.8
6.2 6.6
5.8 6.8
6.4 6.0
4.8 5.2
6.5 4.6
5.4
LUXEMBOURG
1 0 0 . 0 1 0 7 . 3 1 13.8 1 19.7
.
l o o . o 109.4 1 16.7 120.4
GROSS FIXED CAPITAL FORMATION CHANGE IN PRICE
1 9 7 5 = 1 0 0
1 0 0 . 0 1 0 0 . 0 1 0 0 . 0 1 1 9 . 0 1 0 8 . 5 108.5
141.5 1 1 6 . 0 115.7
157.6 1 2 3 . 3 1 2 0 . 8
<Vb, T 4 / T 0
16.5 10.1 13.6
11.9 9.5 7.5
11.3 9.2 6.7
17.6 8.4 11.0
21.9 8.2 12.1
24.3 8.0 18.6
24.9 7.1 11.4
2 0 . 3 7.1 8.4
16.8 6.8 6.1
15.4 6.9 2.7
12,1 5.9 2.7
10.2 6.2 3.7
10.8 6.5
11.6 6.3
1 0 0 . 0 1 0 4 . 4 1 0 6 . 5 11 L O
UNITED KINGDOM
1 0 0 . 0 1 1 5 . 0 1 3 0 . 2 1 4 2 , 9
2 7 . 7 26.9 18,2 15,7 12.4 11.7 12,3 14,0 14,2 11.8 12.3 9.6 9.2 10.4
1 0 0 . 0 1 1 6 . 0 1 3 3 . 1 1 4 4 . 8
23.5 19.9 15.1 12,7 14.1 15,2 16.3 15.7 12.3 10.3 8.1 7.7 8.3
1 0 0 . 0 1 15.5 1 2 8 . 8 1 3 9 . 6
2 4 . 1 22.9 2 1 . 4 16.5 13.5 1 3 . 0 12.5 11.6 11.9 9.9 10.2 10.4 10.1 1 1.1
IRELAND
1 0 0 . 0 119.2 1 3 5 , 3 149,1
.
.
.
.
.
.
1 0 0 . 0 1 1 8 . 6 134.9 1 4 5 . 6
.
.
.
.
.
1 0 0 . 0 1 19,1 1 4 1 . 3 1 5 6 . 9
.
DANMARK U.S.A.
PRODOTTO INTERNO LORDO EVOLUZIONE DEI PREZZI
1 0 0 . 0 | 1 0 0 . 0 1 0 8 . 6
1 1 8 . 3 1 3 0 . 6
105.1 1 1 1 , 3
.
.
.
.
9.2 7.7 5,8 5.6 4,9 4.7 5.1 5.8 6.0 6.0 6.4 7.2 7.7 8.3
CONSUMI PRIVATI EVOLUZIONE DEI PREZZI
1 0 0 . 0 | 1 0 0 . 0 1 1 0 . 1
1 2 1 . 2 1 3 2 . 2
1 0 5 . 6 1 1 1.7
| 6.2
5.7 5.5 5.0 5.0 5.4 5.8 5.7 5.6 6.0 6.7 7.1 7.5
I
INVESTIMENTI FISSI LORDI EVOLUZIONE DEI PREZZI
1 0 0 . 0 | 1 0 0 . 0 1 0 8 . 4
1 18.1 1 2 8 . 4
1 0 5 . 0 112.9