Int. J. Electrochem. Sci., 10 (2015) 931 - 937
International Journal of
ELECTROCHEMICAL
SCIENCE
www.electrochemsci.org
Short Communication
Corrosion Behavior of SS-304 in NaCl Solution at Different
Temperatures Using Electrochemical Noise Technique
Li Jian1*, Zheng Huanjun1, Wang Ke2, Wang Xuehui2 1
State Key Laboratory of Precision Measuring Technology and Instrument, Tianjin University, Tianjin 300072, P.R. China
2
School of Materials Science and Engineering, Tianjin University, Tianjin 300072, P. R. China *
E-mail: [email protected]
Received: 14 October 2014 / Accepted: 23 November 2014 / Published: 2 December 2014
Corrosion behavior of 304 stainless steel(SS-304) exposed to 2mol/L NaCl solution at different temperatures(20 0C, 40 0C, 60 0C, 80 0C) has been studied using electrochemical noise(EN). EN data were analyzed by statistical theory, shot noise theory and wavelet analysis theory. Noise resistance(Rn) and shot noise analysis results showed that the corrosion rate of SS-304 also increased as temperature increased, but the degree of corrosion rate increasing was different obviously during different temperature ranges. In addition, increasing temperature changed the corrosion type of SS-304 from passivation to pitting. Wavelet analysis provided more details about the corrosion process. The analysis results showed that at 20 0C SS-304 would experience passivation and metastable pitting process for a long time. When temperature increased to 40 0C, 60 0C and 80 0C, passivation and metastable pitting process got shorter greatly, which may be caused by the change of passivation film property and the acceleration of electrochemical reaction at high temperature. Finally, the EN analysis results were verified by the corrosion morphologies obtained from optical microscope.
Keywords: SS-304; Electrochemical Noise; pitting corrosion; high temperature; Wavelet analysis
1. INTRODUCTION
more easily and propagates faster, which can accelerate the failure of equipment greatly. Even so, compared with the corrosion study of SS-304 at room temperature, the corrosion study at relatively high temperature is too scarce in the literatures[3]. Therefore it is necessary to study corrosion behavior of SS-304 in corrosive environment at relatively high temperature.
EN method is defined as the fluctuations of potential and current generated spontaneously during the corrosion process[4]. EN method has some obvious advantages compared with polarization, electrochemical impedance spectroscopy and other electrochemical methods[5,6]. EN is able to instantaneously monitor the corrosion rate; EN is carried out without an artificial disturbance of the system; EN can provide more information to research corrosion mechanism. In addition, EN method has been widely used to study the corrosion behavior of SS-304 at room temperature. Many researchers have gained a lot of achievements. Li Liu studied the pitting mechanism of stainless steel in NaCl solution with EN method and AFM analysis[7]. Bing Zhao studied the corrosion behavior of reinforcing steel exposed in chloride solution by analyzing EN data with wavelet analysis method[8]. Cottis found that EN data can be processed by shot noise theory to distinguish different corrosion types[9]. These corrosion achievements with EN method at room temperature can provide us reference for our corrosion study of SS-304 at relatively high temperature, which may benefit us greatly. Although EN method has so many advantages, EN method was rarely used to study corrosion of SS-304 at relatively high temperature. Therefore, more attention still needs to be focused on using EN method to study corrosion of SS-304 at relatively high temperature.
The aim of this paper is characterization the corrosion behavior of SS-304 exposed to 2mol/L NaCl solution at different temperatures(20 0C, 40 0C, 60 0C, 80 0C) using electrochemical noise technique. Firstly, the EN data were measured simultaneously for 12 hours at 20 0C, 40 0C, 60 0C and 80 0C. Secondly, the EN data were analyzed by statistical theory, shot noise theory and wavelet analysis theory to evaluate corrosion behavior of SS-304 at different temperatures.
2. EXPERIMENT
The specimen used in this study was SS-304(chemical composition, in mass fraction, %: C≤0.080%; Cr 18.0%-20.0%; Ni 8.00%-11.0%; Mn≤ 2.0%; Si≤1.0%; P≤0.045%; S≤0.03%; Fe, balance).From the SS-304 plates, 10mm×10mm×3 mm specimens were cut, then the specimens were mounted in epoxy with only the working electrode surface of 1cm2 exposed. The exposed surface was grinded using abrasive papers through 500-grade to 3000-grade, polished with diamond paste, rinsed using acetone, degreased with deionized water and dried in air. The test medium used in experiments was 2 mol/L NaCl solution, which was prepared by the analytical-grade reagents and distilled water. The solution was heated by Constant Temperature Baths.
counter electrode were the same 304 specimens and the reference electrode was Pt wire. Unlike saturated calomel electrode, as temperature increased, Pt wire was still stable.
In this passage, noise resistance(Rn), shot noise and wavelet method were used to process EN data. Now noise resistance(Rn) defined as the ratio of the standard deviations of the potential(σE) and current noise(σI) was widely used to reflect corrosion rate[5]. In shot noise theory, it is well known that the parameters q and fn can provide vital information for understanding the mechanism of the corrosion processes. Generally, q can represent the mass of the metal lost in events, meanwhile fn provides information about the corrosion rate [9]. Q and fn can be estimated from the following equations based on the shot-noise theory [10].
(1) (2)
(3)
where is the average corrosion current, σI andσE are the standard deviation of the current noise and potential noise, is the range of measurement of the experiment, is the Stern-Geary coefficient.
EN data were recorded at different temperatures(20 0C, 40 0C, 60 0C and 80 0C) during 12 hours. The sampling interval in experiment is 0.2s. EN data were divided into one hundred and five time records. Each data record contains 2048 data points. The data processing was implemented by Matlab2013 and the figures were drawn by origin 8.5.
3. RESULTS AND DISCUSSION
3.1 Noise resistance(Rn) analysis
0 10000 20000 30000 40000 50000 0.0000
0.0005 0.0010 0.0015 0.0020 0.0025 0.0030
1
/R
n
(Ω
-1 )
Time (s)
20℃
40℃
60℃
[image:3.596.190.387.532.670.2]80℃
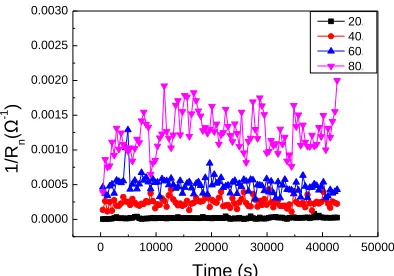
Figure 1. The reciprocal of noise resistance(1/Rn) of SS-304 at 20 0C, 40 0C, 60 0C and 80 0C
indicated that corrosion rate increased with increasing temperature. In addition, as temperature increased to 80 0C, corrosion rate and the volatility of corrosion rate got larger obviously, which may be caused by the instability of electrochemical reaction at high temperature.
3.2 Shot noisy analysis
10 100 1000 10000 100000 1000000 1000
10000 100000
20℃
40℃
60℃
80℃
Rn
(Ω
)
fn(Hz)
10 100 1000 10000 100000 1000000 1E-12
1E-11 1E-10 1E-9 1E-8 1E-7
1E-6 20
40 60 80
q
(C
)
[image:4.596.92.478.206.338.2]fn(Hz)
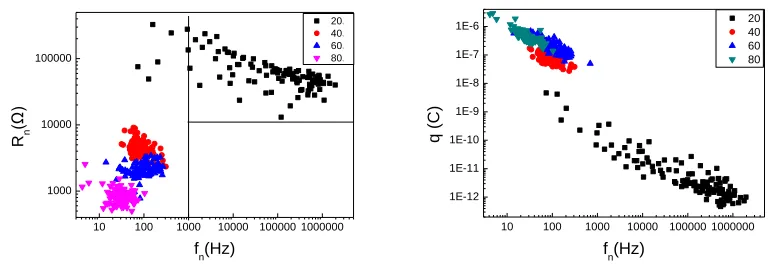
Figure 2. a) Plot of a) fn vs q and b) fn vs Rn for different temperatures in 2 mol/L NaCl solution
According to Cottis[11], the fn vs Rn graph can be used to distinguish different corrosion types.
The graph can be divided into three regions. The region with high frequency and low resistance indicates general corrosion. The region with high frequency and high resistance is associated with passivation. And the last region with low frequency denotes pitting corrosion.
In Fig. 2a, it was found that the points at 20 0C mainly focused on the passivation region with high frequency and high resistance, meaning that the dominant process at 20 0C was passivation. Meanwhile a few points exist in pitting region, which meant that pitting corrosion has a tendency to occur on SS-304 and passivation may be the first stage of pitting process. As temperature increased to 40 0C, 60 0C, 80 0C, the points shifted from passivation region to pitting corrosion region, which meant the susceptibility of SS-304 to pitting corrosion increased and the development of pitting accelerated greatly with the increasing temperature. This was also in an agreement with the result of theoretical analysis. Electrochemical reaction between passivation film and chloridion accelerated increasing temperature. Once passivation film ruptured, chloridion can contact SS-304 directly, leading to the local priority corrosion. Therefore the increasing temperature promoted electrochemical reaction, resulting in the acceleration of pitting development.
Fig. 2b shows the plot of fn vs Rn for different temperatures in 2 mol/L NaCl solution. It was
noted that as the temperature increased, the q values increased whereas fn values decreased, which suggested an increased tendency to undergo pitting corrosion with increase in the temperature. It was also observed that the q and fn values at 20 0C were far less than q and fn values at 40 0C, 60 0C and 80 0
into three stages. Firstly corrosion rate at 200C was very small; When temperature increased to 40 0C and 60 0C, the corrosion rate increased obviously. But the distinction of corrosion rate between 40 0C and 60 0C seemed a little fuzzy; When temperature increased to 80 0C, corrosion rate has an obvious increase again, which was in an agreement with the Rn analysis result.
3.3 Wavelet analysis
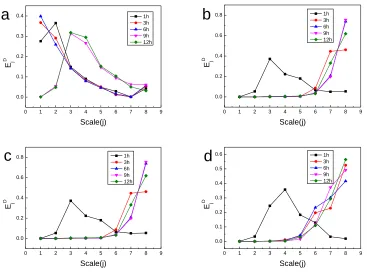
In wavelet analysis theory, energy distribution plots(EDP) have been widely used in analyzing corrosion process and corrosion mechanism. Generally EN data was divided into different crystals according to frequency. The energy of each crystal was calculated. Li Liu and Zhao Bing[7,8] found that the crystal occupying maximum energy among all crystals can reflect corrosion process. The d1 and d2 crystal can represent passivation process. The d3–d5 crystals mean the breakdown and repassivation of the passivation film of stainless steel, corresponding to metastable pitting corrosion process. The d6-d8 crystals can represent the diffusion process, corresponding to the development of stable pitting. In this passage, db4 wavelet was used for 7 levels of wavelet decomposition
0 1 2 3 4 5 6 7 8 9
0.0 0.1 0.2 0.3 0.4 Ej D Scale(j) 1h 3h 6h 9h 12h
a
0 1 2 3 4 5 6 7 8 9
0.0 0.2 0.4 0.6 0.8 Ej D Scale(j) 1h 3h 6h 9h 12h
b
0 1 2 3 4 5 6 7 8 9
0.0 0.2 0.4 0.6 0.8 Ej D Scale(j) 1h 3h 6h 9h 12h
c
0 1 2 3 4 5 6 7 8 9
0.0 0.1 0.2 0.3 0.4 0.5 0.6 Ej D Scale(j) 1h 3h 6h 9h 12h
d
Figure 3. EDP of current noise of during different immersion periods at a) 200C b) 400C c) 600C d)
800C
[image:5.596.109.476.369.642.2]
immersion time increased to 9h and 12h, d8 became the maximum energy, indicating that metastable pitting has taken place. In Fig. 3b, c, d, it was observed that the EDP at 40 0C, 60 0C,80 0C has similar characteristic. At the beginning of experiment, d3 crystal was the maximum energy. When immersion time increased to 3h, 6h, 9h and 12h, d8 crystal became the maximum energy. This showed that at the first hour of experiment, metastable pitting was dominant. When immersion time increased to 3h, 6h, 9h and 12h, the diffusion process corresponding to the development of stable pitting became dominant process. Compared with the pitting corrosion process at 20 0C, the passivation and metastable pitting process got shorter greatly, which may be caused by the change of passivation film and the acceleration of electrochemical reaction at high temperature.
[image:6.596.107.496.279.535.2]3.4 Physical corrosion characterization
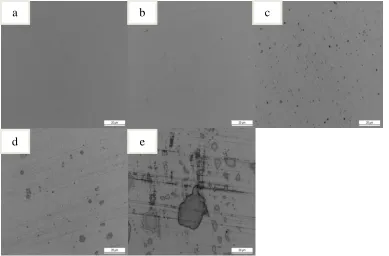
Figure 4. Optical images of SS-304 a) prior to exposure in NaCl solution and after exposure in NaCl
solution for 12h at b) 20 0C c) 40 0C d) 60 0C and e) 80 0C
Fig. 4a shows the optical images of SS-304 after exposure in NaCl solution for 12h at 20 0C, nearly the same with original morphology, which meant that stable pits did not occur. Fig. 4b, c present many small pits, which meant SS-304 has formed stable pits. Compared with the sample surface morphology at 40 0C, the sample surface at 60 0C seemed smoother. This is because stable pits can act as local anodes and protect the area around them against pitting corrosion [12]. Fig. 4d shows many much larger pits than the pits generated at 40 0C and 60 0C, which implied that the high temperature increased the pitting corrosion rate greatly.
b c
d e
4. CONCLUSIONS
(1) The corrosion rate of SS-304 at different temperatures can be divided into three stages. Firstly corrosion rate at 20 0C was very small; When temperature increased to 40 0C and 60 0C, the corrosion rate increased obviously. But the distinction of corrosion rate between 40 0C and 60 0C seemed a little fuzzy; When temperature increased to 80 0C, corrosion rate has an obvious increase again.
(2) The rise in temperature changed the corrosion types. At 20 0C, the main corrosion process may correspond to passivation. However, when temperature increased to 40 0C or above, pitting corrosion became the dominate corrosion type.
(3) Wavelet analysis provided a lot of details about pitting corrosion process. At 20 0C SS-304 would experience passivation and metastable pitting process for a long time. When temperature increased to 40 0C, 60 0C and 80 0C, passivation and metastable pitting process got shorter greatly.
(4) A good relationship between the EN analysis results and the corrosion morphologies has been observed during the corrosion process of SS-304 in NaCl solution at different temperatures. ACKNOWLEDGEMENTS
The project was supported by the National Program on Key Basic Research Project (973 Program) (2011CB610505).
Reference
1. N. J. Laycock, R. C. Newman, Corros. Sci, 40(1998) 887-902.
2. X. Wei, J. Dong, J. Tong, et al, Int. J. Electrochem. Sci, 8(2013) 887-902.
3. C. Cuevas-Arteaga, J. Porcayo-Calderón, Mater. Sci. Eng., A, 435(2006) 439-446. 4. T. Zhang, D. Wang, Y. Shao, et al, Corros. Sci, 58(2012) 202-210.
5. T. Zhang, X. Liu, Y. Shao, et al, Corros. Sci, 50(2008) 3500-3507. 6. L. Jian, K. Weikang, S. Jiangbo, et al, Int. J. Electrochem. Sci, 8(2013). 7. L. Liu, Y. Li, F. Wang, Electrochim. Acta, 54(2008) 768-780.
8. B. Zhao, J. H. Li, R. G. Hu, et al, Electrochim. Acta,, 52(2007) 3976-3984. 9. M. G. Pujar, U. Kamachi Mudali, S. S. Singh, Corros. Sci, 53(2011) 4178-4186. 10.F. Hass, A. C. T. G Abrantes, A. N Diógenes, et al, Electrochim. Acta, 2013. 11.H. A. A. Al-Mazeedi, R. A. Cottis, Electrochim. Acta, 49(2004) 2787-2793., 12.C. Cai, Z. Zhang, F. Cao, et al, J. Electroanal. Chem, 578(2005) 143-150.