Int. J. Electrochem. Sci., 10 (2015) 2487 - 2503
International Journal of
ELECTROCHEMICAL
SCIENCE
www.electrochemsci.orgAnode- Versus Cathode-Supported Solid Oxide Fuel Cell: Effect
of Cell Design on the Stack Performance
Shichuan Su, Xiang Gao, Qiang Zhang, Wei Kong* and Daifen Chen*
School of Energy and Power Engineering, Jiangsu University of Science and Technology, Zhenjiang 212003, China
*
E-mail: [email protected], [email protected]
Received: 24 November 2014 / Accepted: 22 December 2014 / Published: 19 January 2015
This paper investigates the effect of cell design on solid oxide fuel cells (SOFC) stack performance. Based on 3-dimensional numerical simulations, it is found that the performance of stack is strongly dependent on cell design. The average current density of the anode-supported SOFC (ASC) stack is only 5580 A m-2, a reduction of 20.7% from the cathode-supported SOFC (CSC) stack of 7033 A m−2. This can be explained that compared with CSC stack, thin cathode in ASC stack leads to the smaller effective reaction zone and the larger cathode ohmic losses. The discrepancy between the ASC stack and the CSC stack are examined by varying rib width, contact resistance and pitch width. The results show conclusively that with the optimal rib width, the performance of the CSC stack is much superior to that of the ASC stack for any practical contact resistance and pitch width. The analyses provided in this paper assist in understanding the effect of cell design on cell performance in the stack level and playing the full potential of the stack by optimizing the cell design.
Keywords: Solid oxide fuel cell; Anode-supported cell; cathode-supported cell; stack model; charge
or gas transport
1. INTRODUCTION
loss. Thus electrode-supported SOFC can be operated at intermediate or low temperature and is preferred over electrolyte-supported design [6].
Much recent effort for the electrode-supported SOFC is mainly based on the anode-supported SOFC (ASC) [7-11]. Noh et al. showed that the cell performance was improved by a factor of 1.6 by the optimization of the current collection configuration of ASC [12]. Author's previous study systematically examined the influence of the rib width on the stack-cell performance and revealed that the optimal rib width of anode is quite different from that of cathode for ASC[13]. Park et al investigated the effect of the anode functional layer thickness on the performance of ASC[14]. Lim et al. studied the degradation mechanism of ASC. The results indicated that the increase of the ohmic resistance is the main cause leading to the cell degradation [15].
[image:2.596.162.424.405.518.2]Comparatively, there has been little attention paid to the cathode-supported SOFC (CSC), though CSC shows various advantages over ASC such as using the low-cost cathode supporting material strontium-doped lanthanum manganese, relatively thin anode preventing the depositing carbon when operating on hydrocarbon fuels and also providing benefits in terms of tolerance to volume contraction/expansion resulting from the accidental anode redox cycles [6, 16-19]. This can be highly attributed to the fabrication difficulty of the CSC. For example, a relatively high sintering temperature may lead to the chemical reactions between cathode and electrolyte. However, the electrolyte will not be dense if sintered at a low temperature[18].
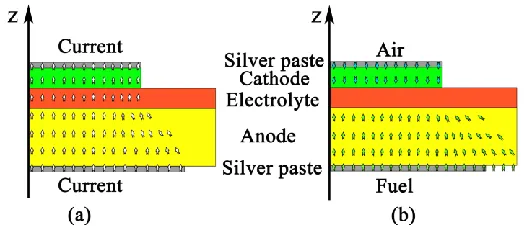
Figure 1. Schematic representation of charge and gases transport processes in the button cell.
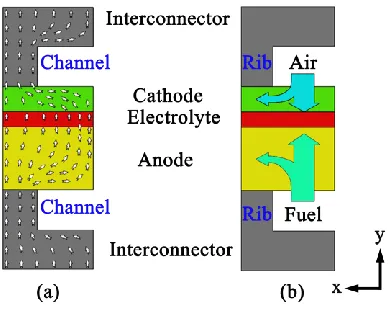
Figure 2. Schematic representation of charge and gases transport processes in the stack.
For the stack, the channels in interconnector are used to carry the fuel and air flows and the ribs collect current, which separate and define the channels, as shown in Fig. 2. The width of the ribs or the channels is commonly about several millimeters [13, 24]. The charge and gases transport paths of the stack in the parallel electrode surface direction is no less than that in the vertical electrode surface direction. Therefore, at least, the ohmic and concentration losses of electrodes in the parallel electrode surface direction are the same important as those in the vertical electrode surface direction. Thick electrode layer is benefit for reducing the ohmic and concentration losses in the parallel electrode surface direction due to increasing the cross section of the charge and gases transport paths. On the other hand, thick electrode layer hinders the charge and gases transport in the vertical electrode surface direction because of elongating the charge and gases transport path. Thus it is difficult to judge whether the performance of the ASC stack is better than that of the CSC stack under the same operating condition. In practice, it is very necessary to clarify the advantage or disadvantage of ASC and CSC, which assists in understanding the effect of cell design on cell performance in the stack level and playing the full potential of the stack by optimizing the cell design.
In literature, there is only one study comparing the performance of the ASC stack with that of the CSC stack under the same operating condition [25]. In that study, the computational domain consists of the fuel and air channels and the electrodes–electrolyte assembly but the ribs are completely ignored. However, many studies have already shown the strong effect of the ribs on the charge and gases transport [13, 26, 27]. For ASC stack, an oxygen depletion zone of 0.46 mm was found with a cathode rib width of only 0.8 mm due to thin cathode thickness limiting the oxygen diffusion to the area under rib [27]. For the CSC stack, the minimum hydrogen concentration under anode rib is only about one third of that under anode channel [28]. Therefore, the model developed in reported [25] can't accurately predict the performance of the ASC or CSC stack.
2. MODEL
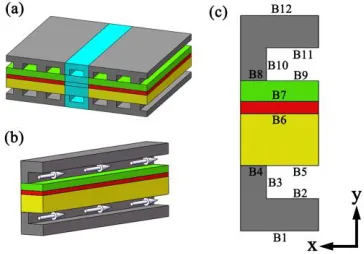
[image:4.596.208.390.192.319.2]A repeating cell unit of a SOFC stack is shown schematically in Fig. 3a. Due to symmetry, we select half of the repeating unit of stack as our computational domain as shown in Fig. 3b. The computational domain is comprised of (i) cathode-side interconnect plate and the air channels, (ii) electrodes–electrolyte assembly, (iii) anode-side interconnect plate and the fuel channels.
Figure 3. Schematic of a SOFC stack.
2.1. Governing Equations 2.1.1. Charge Transport
Electronic and ionic current density are governed by charge continuity equation, which can be described as follows associated with the point form of Ohm’s law.
( ) 0
el el el
i
(1)
( ) 0
io io io
i
(2)
where iel and iio are the electronic and ionic current density, respectively, el (io) is the local electronic (ionic) potentials, el represents the electronic conductivity of electrodes , while io represents the ionic conductivity of electrolyte.
The electronic conductivity of composite electrode el can be estimated as [29]: 0
[(1 ) ]B el el elpel
(3) where 0
el
is the electronic conductivity of the pure material,
is the porosity, el is the volume fraction of electronic conductor phase, B is the Bruggeman factor used to include the effects of tortuous conduction paths (B is set as 3.5 [30]) and pel is the probability for electronic conductor particles to belong to the percolated clusters of electronic (ionic) conductor particles.0 el
for Ni and LSM may be estimated as [26, 31],
0 6
Ni 3.27 10 1065.3T
(4) 7
0 LSM
4.2 10 1150 exp
T T
(5)
4 10300
6.25 10 exp( ) io
T
(6) where T is the temperature.
2.1.2. Momentum Transport
Momentum transport in the fuel or air channel can be modeled by applying the Navier–Stokes equation in conjunction with the continuity equation.
2
( ) [ ( ( ) ) ( ) ]
3 T
u u p u u u I
(7)
(u) 0
(8)
where is the density, I is the identity matrix, is the viscosity coefficient of fluid, p is the pressure and
u
is the velocity of fluid.2.1.3. Mass Transport
Mass transport mechanism in channel is simple, which can be described by Fick's model associated with the mass continuity equation.
( ) 0
i i i i
N D C C u
(9)
where Ni is the molar flux of species i, Ci is the molar concentration of speciesi, Di is the diffusion coefficient of species i, which equates to binary diffusion coefficient Dij due to the fuel compose of two species (H2, H2O) and the air compose of two species (O2, N2). Dij can be evaluated
by following equation.
0.5 8 1.75
2 1/3 1/3
3.198 10 1 1
ij i j i j T D M M p
(10)
where i is diffusion volume for specie i (6.12 10 6, 13.1 10 6, 16.3 10 6 and 18.5 10 6 m3 mol-1 for H2, H O2 , O2 and N2, respectively [32]) and Mi (Mj) denotes molecular mass of species
i ( j) (kg mol-1).
Mass transport mechanisms in the porous electrodes are complex, molecular diffusion and Knudsen diffusion are taken into account.
( eff ) 0
i i i
N D C
(11) where eff
i
D is the equivalent diffusion coefficient of species i, which can be written as eff eff
ij iKn eff
i eff eff eff ij i jKn j iKn
D D D
D x D x D
(12)
where xi(xj) is the molar fraction of species i( j), Dijeff and eff iKn
D are the effective binary diffusion coefficient and the effective Knudsen diffusion coefficient of species i respectively.
eff ij
D and eff iKn
D can be evaluated by following equations respectively [29, 33]. eff
ij ij
D D
2 8 3 eff iKn g i RT D r M
(14)
where R is the universal gas constant, rg is the pore radii and is the tortuosity factor.
2.1.4. Heat Transport
Temperature is one of the most critical factors, which significantly affects SOFC performance, because many properties of the SOFC components are temperature dependent such as the electrical and ionic conductivity, the electrochemical reaction rate, fluid properties. For a 3D model, it is essential to take into account heat transport.
In the fluid domain, heat conduction and heat convection are must considered together.
( ) 0
T f f p
N T C C Tu
(15)
where f is the thermal conductivity of the fluid, NT is the heat flux, Cf is the molar concentration of the fluid, Cpis the molar heat capacity of the fluid, which can be written as [32]
i
p i p
i
C
x C (16)where Cip is the specific heat of species i, which can be calculated as [32]
1 2 3 3 6 2
10 10
i
p i i i
C a a T a T (17) where 1
i
a , ai2 and 3 i
a are constants.
In the solid domain, heat conduction is considered, which can be described as ( )
T s
N T Q
(18)
where Q is the heat source, sis the thermal conductivity of the solid.
Heat source Q in SOFC can be classified as Ohmic heat source Qohm, activation heat source act
Q and entropy heat source Qentr. ohm
Q is the heat generation from ohmic loss, which can be expressed as 2
ohm i Q
(19) act
Q is the heat generation from activation loss, which can be expressed as act act
Q i (20) entr
Q is the heat generation from entropy change in the electrochemical reactions, which can be expressed as ( ) 2 entr T S Q i F
(21)
where F is the Faraday constant, act is the activation loss and S is the entropy.
2.2. Boundary Conditions
required for solving these coupled partial differential equations. For easy description of boundary conditions, some boundaries in our model are tagged as indicated in Fig. 3c. Many researchers didn’t give each of boundaries setting due to so many boundaries in 3D model, which may lead to some misunderstanding. So in this work we describe the boundary setting for each boundary of each equation in order to be easy understanding. Co-flow pattern is adopted in this study, since it has the most uniform temperature distribution than counter-flow pattern or cross-flow pattern [5].
2.2.1. Boundary Setting for the Charge Transport Equation
The boundaries B1 and B12 are the top surface and the bottom surface of half unit cell, respectively, where electronic potential is set as E at boundary B1 and opis specified at boundary B12. The Nernst potential E is given as
2 2 2 0 0 0 0.5 0 5 ( )
ln( ( ) )
2 2 10
H O
H O
p p G T RT
E
F F p
(22)
where G0is the Gibbs free energy change at the condition that the partial pressure of H2, H2O
and O2 are all 1 bar. The boundaries B4 and B8 represent the interfaces between rib and electrode.
Contact resistance is specified at these boundaries, which means the local current densities cross boundary B4 (iribAn) and boundary B8 (iCarib) are determined by below expression.
e,rib/An e,An/rib contact rib An i ASR
(23)
e,Ca/rib e,rib/Ca contact Ca rib i ASR
(24)
where ASRcontact is the contact resistance, e,rib/An and e,An/rib are the electric potentials at B4 on rib side and anode side, respectively. e,Ca/rib and e,rib/Ca are the electric potentials at B8 on cathode side and rib side, respectively. The interface between electrolyte and anode is represented by B6, where the normal electronic current density is an
trans i
due to the reaction at B6 and the normal ionic current density is an
trans
i . The interface between electrolyte and cathode is represented by B7, where the normal electronic current density is ca
trans
i due to the reaction at B7 and the normal ionic current density is ca
trans i
. All others boundaries are set as electric insulation. an
trans
i and itransca can be calculated by Butler-Volmer equations as follows [34, 35]:
2 2 2
2 2
H H O an
ref 0 0
ref H H O
2 2
1 1
exp exp exp
TPB TPB an an
H f
an an r an
trans act act
E p p F F
i i
R T T p p RT RT
(25) 2 2 2 0.25 0 2 2 1 1
exp exp exp
TPB ca ca
O O f
ca ca ca r ca
trans ref act act
ref O
E p F F
i i
R T T p RT RT
(26) where f
and r
are the forward and reverse reaction symmetric factor, respectively,
2 H E and 2 O
E are the activation energies for the anode and cathode electrochemical reactions, respectively.
2
0
H
p and
2
0
H O
p are the partial pressure of H2 and the partial pressure of H2O at the fuel channel inlet,
respectively,
2
0
O
p is the partial pressure of O2 at the air channel inlet, 2
TPB H
p and
2
TPB H O
and
2
TPB O
p is the partial pressure of O2 at the cathode TPBs, irefan and irefca are the exchange transfer
current density of anode and cathode respectively. Here an
act
and ca act
are the anode and cathode activation loss respectively, defined as
2 2 2 2 0 0 ln( ) 2 TPB H H O
an an
act el io conc el io TPB H O H
p p RT
F p p
(27)
2 2 0 ln( ) 4 O ca ca
act io el conc io el TPB O
p RT
F p
(28) where an
conc ( ca
conc
) is the anode (cathode) concentration loss.
2.2.2. Boundary Setting for the Mass Transport Equation
At the channel inlets, the concentration of gaseous species are imposed, whereas, the convective fluxes are considered at the channel outlets, which mean diffusive component across the channel outlets is zero. The boundaries B5 and B9 represent the interfaces between channel and electrode, where species fluxes are continuous. As there is electrochemical reaction at boundaries B6 and B7, the normal molar flux of hydrogen, water and oxygen are itransan / (2 )F , / (2 )
an trans
i F
,
c
/ (4 ) a
trans
i F , respectively. The insulation condition is set at all other boundaries, which implies the molar flux of species is zero.
2.2.3. Boundary Setting for the Momentum Transport Equation
At the channel inlets, the uniform inlet velocity are applied, whereas, pressure and the normal flow are imposed at the channel outlets. The no slip condition is considered at all others boundaries, which means u0.
2.2.4. Boundary Setting for the Heat Transport Equation
At the channel inlets, the uniform temperature are applied, whereas, the convective fluxes are considered at the channel outlets. The boundary condition at boundary B4 and B8 become as
T ohm
n N Q due to contact resistance. The boundary condition at boundary B6 and B7 are specified as T act entr
n N Q Q due to the reaction. Boundary B2, B3, B10 and B11 are the interfaces between rib and channel, where the convection heat between rib and channel is considered.
For rib, convection heat transfer rate is given as
/ /
( )
T chan rib rib chan
n N h T T
(29)
For fluid in channel, convection heat transfer rate is given as
/ /
( )
T chan rib rib chan
n N h T T
(30)
Adiabatic boundary condition is employed at all other boundaries since the simulation region is the half of one repeating unit located at the center of stack.
2.3. Numerical Implementation
The model was implemented in the finite element commercial software COMSOL MULTIPHYSICS. The COMSOL stationary nonlinear solver uses an affine invariant form of the damped Newton method to solve the discretized PDEs with a relative convergence tolerance of 1×10⁻⁶
. The mesh is composed of 6,540 elements with 117,279 degrees of freedom. The values of input parameters for the base case are summarized in Table 1 and Table 2 unless otherwise stated.
Table 1. Model parameters.
Parameter Value
Fuel channel inlet velocity, 0fuel
u (m s-1) 0.3
Air channel inlet velocity, 0air
u (m s-1) 3
Fuel channel outlet pressure, p0( Pa) 105 Air channel outlet pressure, p0( Pa) 105 Fuel channel inlet temperature, Tinlet (K) 973.15
Air channel inlet temperature, Tinlet (K) 973.15
Inlet concentration (mol m-3)
2
0 H
c 12.147
2
0 H O
c 0.376
2
0 O
c 2.63
2
0 N
c 9.893
Tortuosity factor,
3.5Porosity,
0.3Porous radius, rg (m) 5e-7
Activation energies for the cathode,
2
O
-1
(J mol )
E 130×103
Reaction symmetric factor for cathode, caf ,
ca r
0.75, 0.5
Exchange transfer current density of cathode, irefca
Am-1
4000 Exchange transfer current density of anode, irefan
A m-1
5000 Activation energies for the anode,2
H
-1
(J mol )
E 120×103
Reaction symmetric factor for anode, anf
, an r
1, 0.5
Operation voltage, op (V) 0.7
Thermal conductivity of cathode, ca (W m-2 s-1) 4 [36] Thermal conductivity of rib, rib (W m-2 s-1) 6 [37] Area specific contact resistance at the rib-electrode
interface, contact
ASR (Ω cm2)
0.03
Channel length, Lch (mm) 20
Channel width, wch (mm) 1.5
Interconnect height, hint (mm) 2.0
Rib width, wrib (mm) 1.5
[image:10.596.105.494.71.226.2]Rib height, hrib (mm) 1.0
Table 2. Coefficients of molar heat capacity [38]
Gases 1
i
a 2 3
10 i
a ai3106 Hydrogen 29.09 0.836 -0.3265
Water 30 10.7 -2.022
Oxygen 36.16 0.845 -0.7494 Nitrogen 27.32 6.226 -0.9502
3. RESULTS AND DISCUSSION
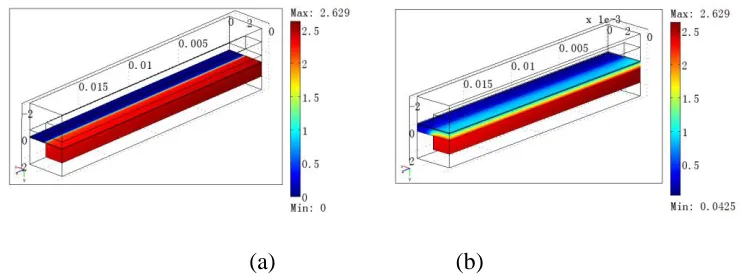
In order to investigate the performance discrepancy between the ASC stack and the CSC stack, two models were established with the same settings as described above except the thickness of electrodes. The ASC stack model has an anode thickness and a cathode thickness of 500 and 50μm, respectively. The corresponding parameters for the CSC stack model are 50 and 500μm, respectively. It is some unexpected to find that the average current density of the ASC stack is only 5580 A m-2, a reduction of 20.7% from the CSC stack of 7033 A m−2. The substantial discrepancy between the performances of the ASC stack and the CSC stack may be understood by the difference distributions of gases concentration and electronic potential in Fig. 4-5.
3.1 The Distributions of Gases Concentration
[image:10.596.198.397.284.385.2]
Although the oxygen concentration of the CSC stack under rib is small, an oxygen depletion zone is avoided, as can be seen in Fig. 4b. Thus, the effective reaction zone of the CSC stack is larger than that of the ASC stack, which is an important factor contributing to the reduced performance of the ASC stack.
[image:11.596.115.485.170.309.2]
(a) (b)
Figure 4. Distributions of O2 for (a) the ASC stack and (b) the CSC stack
[image:11.596.116.484.365.503.2]
(a) (b)
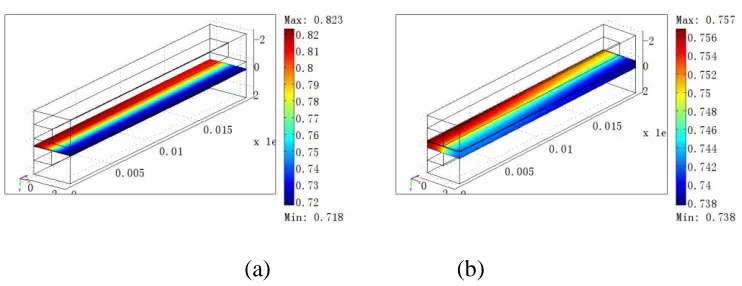
Figure 5. Distribution of H2 for (a) the ASC stack and (b) the CSC stack
3.2 The Distributions of Electronic Potential
[image:12.596.116.487.109.252.2]
(a) (b)
Figure 6. Distribution of electronic potentialin cathode for (a) the ASC stack and (b) the CSC stack
[image:12.596.116.487.306.445.2]
(a) (b)
Figure 7. Distribution of electronic potentialin anode for (a) the ASC stack and (b) the CSC stack
The distribution of electronic potential in cathode for the ASC stack and the CSC stack is given in Fig. 6. The ohmic loss in cathode for the CSC stack is 19 mV, which is less than one fifth of that for the ASC stack (105 mV). Notable cathode ohmic loss of the ASC stack is created by two main aspects: (i) a narrow cross-section of current path in the x direction (ii) relatively small cathode electrical conductivity. A very small electronic potential variation is observed in anode for the ASC stack, as shown in Fig. 7a. The high anode electrical conductivity is believed to be responsible. For the CSC stack, the ohmic loss in anode is about 13 mV, as given in Fig. 6b. Large anode ohmic loss of the CSC stack is attributed to thin anode hindering current flow in the x direction. The total electrodes ohmic loss for the CSC stack is 32 mV, which is only about one third of that for the ASC stack 106 mV. This is another factor contributing to the reduced performance of the ASC.
3.3 The Distributions of temperature
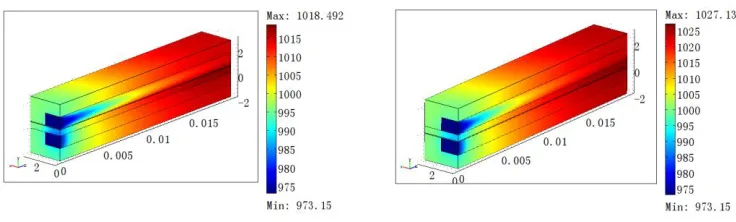
However, the highest of the CSC stack is 1027 K is larger than that of the ASC stack. Compared with the CSC stack, as described above, the performance of the ASC is lower. As a result, the heat produced by reaction is also lower. Temperature is one of the most critical factors, since the stack performance rises quickly with increasing temperature. If temperature is not considered, the advantage of the CSC stack will be underestimated.
[image:13.596.116.484.187.298.2]
Figure 8. Distribution of temperature for (a) the ASC stack and (b) the CSC stack
3.4 Effect of Rib Width
To gain more insight into the performance difference between the ASC stack and the CSC stack, the stack output for a fixed pitch width ( the sum of the rib and the channel width) of 3 mm is examined by varying the rib width.
Fig. 9a shows the relationship between the output current density and the anode rib width. The output current density of the ASC stack and CSC stack for a fixed rib width of 1.5 mm are respectively 5580 and 7033 A m2, which are 6.4% and 23.5% higher than that of the ASC stack and CSC stack with an anode rib width of 2.1 mm, respectively. Clearly, the anode rib width has a significant impact on the performance of the ASC stack and the CSC stack. Similarly, the cell outputs of the ASC stack and CSC stack also vary notably with the cathode rib width, as shown in Fig. 9b. Compared to the results obtained with a fixed cathode rib width of 2.1 mm, the output current increases by 12.4% and 27.3% for the ASC stack and the CSC stack respectively with a cathode rib width set as 1.5 mm. Therefore, a suitable choice of the rib width is very important for realizing the potential of a SOFC stack.
(a) (b)
Figure 9. The effect of rib width on the stack output current density (a) anode rib width and (b) cathode rib width
3.5 Effect of Contact Resistance and Pitch Width
[image:14.596.123.469.78.231.2]As discussed above, the stack performance is closely related to the anode and cathode rib width. Thus, the optimal rib width is used in the following, which can be obtained according to the optimal rib width formulae presented in references [13, 39].
[image:14.596.108.463.413.678.2]
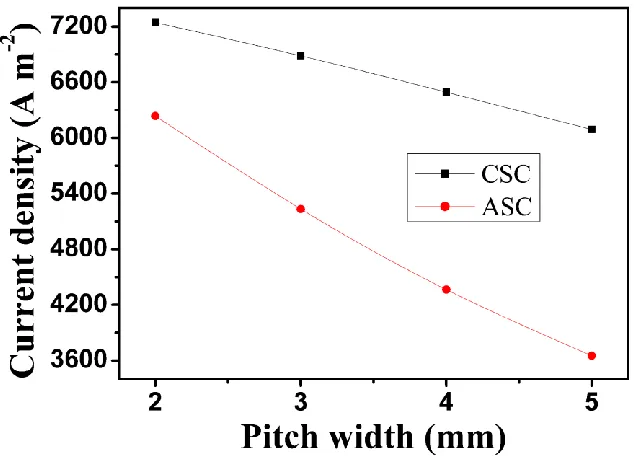
Figure 11. The effect of pitch width on the stack output current density
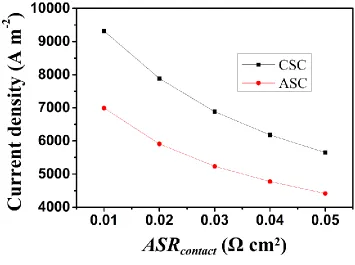
Fig. 10 depicts the dependence of ASRcontact on the stack output current density. Obviously, the performance of the CSC is much better than that of the ASC for any practical ASRcontact. As expect, the output current density of the ASC stack and CSC stack decreases with the increase of the contact resistance ( ASRcontact), as can be seen in Fig. 10. However, it is surprise that ASRcontact has so significant influence on SOFC performance. The output current density increases 40% and 34% from
contact
ASR =0.05Ω/cm2 to ASRcontact=0.02Ω/cm2 for the CSC stack and ASC stack respectively. As a consequence, it is rather necessary to minimize ASRcontact for the improving SOFC performance.
As depicted in Fig. 11, with the increase of the pitch width, the advantage of the CSC stack over the ASC stack becomes more and more obvious. The output current densities of the CSC stack and the ASC stack decrease by 16% and 41% for the pitch width varying from 2 to 5 mm respectively. The performance reduction is mainly due to two aspects: (i) the increase of the gases transport path in the parallel electrode surface direction leading to larger concentration overpotential, as the optimal rib width is proportional to the pitch width. (ii) the increased ohmic overpotential for the increased charge transport route in the parallel electrode surface direction due to the wider channel associated with the wider pitch.
4. CONCLUSIONS
stack. Moreover, the discrepancy between the ASC stack and the CSC stack are examined by varying rib width, contact resistance and pitch width. The conclusions are summarized as follows:
1) The performance of ASC stack is considerably lower than the CSC stack, which is mainly due to two aspects: (i) a wide oxygen depletion zone under rib limits the effective reaction zone of the ASC; (ii) thin cathode of the ASC leads to remarkable cathode ohmic loss;
2) With the optimal rib width, the performance of the CSC stack is better than that of the ASC stack for any practical contact resistance. However, it is possible that the ASC stack is superior to the CSC, if the rib width is not chosen appropriately.
3) It is rather necessary to minimize contact resistance (ASRcontact) for the improvement of the SOFC performance. The output current density increases 40% and 34% from ASRcontact=0.05Ω/cm2 to
contact
ASR =0.02Ω/cm2 for the CSC and ASC.
4) Although the performance of the CSC stack and the ASC stack decrease with the increase of the pitch width, the advantage of the CSC stack over the ASC stack becomes more and more obvious.
The present study signifies the differences between the ASC stack and CSC stack and provides better understanding on the effect of cell design on SOFC stack performance.
ACKNOWLEDGEMENTS
We gratefully acknowledge the financial support of the National Science Foundation of China (21406095 and 21106058), the Jiangsu Province Colleges and Universities Natural Science Projects (13KJB480003) and the Jiangsu University of Science and Technology (35321101). The authors thank Dr. Shixue Liu at Kyushu University for his insightful discussions.
References
1. M. M. Hussain, X. Li, I. Dincer, Journal of Power Sources,189(2009), 916-28. 2. A. V. Virkar, J. Chen, C. W. Tanner, J-W. Kim, Solid State Ionics,131(2000),189-98. 3. Y. Ji, K. Yuan, J.N. Chung, Y.C. Chen, Journal of Power Sources,161(2006), 380-91.
4. L. W. Chen, S. H. Gao, H. C. Zhang, International Journal of Electrochemical Science, 8 (2013), 10772 -10787.
5. J. H. Myung, H. J. Ko, J. J. Lee, S. H. Hyun, International Journal of Electrochemical Science, 6 (2011) , 1617-1629.
6. S. Zhang, L. Bi, L. Zhang, C. Yang, H. Wang, W. Liu, International Journal of Hydrogen Energy,34(2009), 7789-94.
7. M. Ni, International Journal of Hydrogen Energy, 37(2012), 1731-45.
8. Z. Zhao, L. Liu, X. Zhang, W. Wu, B. Tu, D. Cui, et al. International Journal of Hydrogen Energy, 38(2013),15361-70.
9. F. Miao, International Journal of Electrochemical Science, 8 (2013) , 11814-11822.
10.H. C. Patel, N. Biradar, V. Venkataraman, P. V. Aravind, International Journal of Electrochemical Science, 9(2014) , 4048-4053.
11.Y. Wang, J. Yu, S. Weng, International Journal of Hydrogen Energy, 36(2011), 5624-31.
12.H. S. Noh, J. Hwang, K. Yoon, B. K. Kim, H. W. Lee, J. H. Lee, et al, Journal of Power Sources, 230(2012), 109-14.
13.W. Kong, J. Li, S. Liu, Z. Lin , Journal of Power Sources ,204(2012), 106-15.
15.H. T. Lim, S. Hwang, M. Jung, H. Park, M. Park, S. S. Lee, et al, Fuel Cells,13(2013), 712-9. 16.G. Chen, G. Guan, Y. Kasai, H. X. You, A. Abudula, Journal of Solid State Electrochemistry,
16(2012)2071-7.
17.G. Chen, H. X. You, Y. Kasai, H. Sato, A. Abudula, Journal of Alloys and Compounds, 509(2011), 5159-62.
18.M. Liu, D. Dong, F. Zhao, J. Gao, D. Ding, X. Liu, et al, Journal of Power Sources,182(2008), 585-8.
19.G. Chen, G. Guan, Y. Kasai, A. Abudula, International Journal of Hydrogen Energy, 37(2012), 477-83.
20.M. A. Khan, R. Raza, R. B. Lima, M. A. Chaudhry, E. Ahmed, G. Abbas, International Journal of Hydrogen Energy, 38(2013), 16524-31.
21.D. Cui, C. Yang, K. Huang, F. Chen, International Journal of Hydrogen Energy, 35(2010), 10495-504.
22.S.H. Chan, K.A. Khor, Z.T. Xia, Journal of Power Sources, 93(2001), 130-40.
23.S. Q. Yang, T. Chen, Y. Wang, Z. Peng, W. G. Wang, International Journal of Electrochemical Science, 8(2013), 2330-44.
24.M. Kornely, A. Leonide, A. Weber, E. Ivers-Tiffée, Journal of Power Sources, 196(2011), 7209-16. 25.T. X. Ho, P. Kosinski, A. C. Hoffmann, A. Vik ,Chemical Engineering Science, 64(2009), 3000-9. 26.D. H. Jeon, J. H. Nam, CJ. Kim, Journal of the Electrochemical Society, 153(2006), A406-A17. 27.S. Liu, C. Song, Z. Lin, Journal of Power Sources, 183(2008), 214-25.
28.W. Kong, S. C. Su, X. Gao, D. H. Zhang, Z. D. Yu, Advanced Materials Research, 712(2013), 1325-9.
29.J. H. Nam, D. H. Jeon, Electrochim Acta, 51(2006), 3446-60.
30.J. Sanyal, G. M. Goldin, H. Zhu, R. J. Kee, Journal of Power Sources, 195(2010), 6671-9. 31.Y. X. Shi, N. S. Cai, C. Li, Journal of Power Sources, 164(2007), 639-48.
32.B. Todd, J. B.Young, Journal of Power Sources, 110(2002), 186-200.
33.E. Fuller, P. Schettler, J. Giddings, Industrial & Engineering Chemistry, 58(1966), 18-27. 34.P. Costamagna, K. Honegger, Journal of the Electrochemical Society, 145(1998), 3995-4007. 35.H. Y. Zhu, R. J. Kee, Journal of the Electrochemical Society, 155(2008), B715-B29.
36.L. Petruzzi, S. Cocchi, F. Fineschi, Journal of Power Sources, 118(2003), 96-107.
37.M. Iwata, T. Hikosaka, M. Morita, T. Iwanari, et al, Solid State Ionics, 132(2000), 297-308. 38.F. P. Incropera, D. P. Dewitt, T. L., Bergman & Llavine AS, 2007, 572-5.
39.W. Kong, X. Gao, S. X. Liu, S. C. Su, D. F. Chen, Energies, 7(2014), 295-313.
![Table 2. Coefficients of molar heat capacity [38]](https://thumb-us.123doks.com/thumbv2/123dok_us/1882968.145619/10.596.198.397.284.385/table-coefficients-molar-heat-capacity.webp)