This is a repository copy of Geospatial and temporal data mining to combine railway low adhesion and rail defect data.
White Rose Research Online URL for this paper: http://eprints.whiterose.ac.uk/132468/
Version: Accepted Version
Article:
Arnall, A., Fletcher, D. orcid.org/0000-0002-1562-4655 and Lewis, R. (2018) Geospatial and temporal data mining to combine railway low adhesion and rail defect data.
Proceedings of the Institution of Civil Engineers: Transport. ISSN 0965-092X https://doi.org/10.1680/jtran.17.00120
Reuse
Items deposited in White Rose Research Online are protected by copyright, with all rights reserved unless indicated otherwise. They may be downloaded and/or printed for private study, or other acts as permitted by national copyright laws. The publisher or other rights holders may allow further reproduction and re-use of the full text version. This is indicated by the licence information on the White Rose Research Online record for the item.
Takedown
If you consider content in White Rose Research Online to be in breach of UK law, please notify us by
Geospatial and temporal data mining to combine
1
railway low adhesion and rail defect data
2
A. D. Arnall1 MEng, D. I. Fletcher2 BEng, PhD, R. Lewis3 MEng, PhD, CEng 3
1.! PhD student, Department of Mechanical Engineering, University of Sheffield, 4
Sheffield, UK 5
2.! Reader in Mechanical Engineering, Department of Mechanical Engineering, 6
University of Sheffield, Sheffield, S1 3JD, UK (corresponding author: Tel 0114 7
2227760, email [email protected]) 8
3.! Professor of Mechanical Engineering, Department of Mechanical Engineering, 9
University of Sheffield, Sheffield, UK 10
Abstract
11
Rolling contact fatigue (RCF) damage to rails, and low adhesion at the rail-wheel 12
interface remain significant problems in maintaining railway performance, fully 13
utilising network capacity, and reducing running costs. A novel approach has been 14
developed to understand these problems through analysis of data on RCF and low 15
adhesion incidents from the UK rail network. This augments understanding of 16
specific mechanisms such as the role of rail plasticity in crack initiation and of 17
environmental moisture levels in low adhesion, which to-date have not given 18
sufficient information to prevent the problems. 19
A moving window filtering technique, a temporal and a geospatial approach were 20
used to identify correlations between sites of low rail-wheel adhesion subject to 21
transient sliding contact, crack initiation, and underbridge locations at which vertical 22
and lateral track stiffness typically change rapidly. The analysis shows that (i) a high 23
RCF sites. From the temporal analysis it was found that although concentrated in the 26
autumn period, 55-60% of transient low adhesion incidents occur outside that period, 27
with highest risk in the very early morning. 28
29
Keywords: Railway systems; railway tracks; environment. 30
31
Notation
33
ELR EngineerÕs line reference 34
GPS Global positioning system 35
LD, LT Long slide, by distance (D) or time criterion (T) 36
MD, MT Momentary slide, by distance (D) or time criterion (T) 37
RCF Rolling contact fatigue 38
RDMS Rail defect management system 39
WCML West coast main line 40
WSP wheel slide protection 41
1.
!
Introduction
42
There have been numerous studies investigating rail rolling contact fatigue (RCF) to 43
understand how the stresses at the contact patch contribute to the initiation and 44
propagation of cracks, relevant examples being Kapoor et al. (2002), Grassie and 45
Elkins (2005), Grassie (2015), Fletcher and Beynon (2000), and Fischer et al. (2006). 46
With the development of harder rail steels the forces present at the wheel-rail 47
interface during normal operation generate much less extensive plastic flow than in 48
conventional steel grades, thus restricting crack initiation, or delaying development of 49
RCF unless some other factor is present to increase rail-wheel forces. It is known that 50
residual stresses (Fletcher et al., 2006) or the lateral forces generated during cornering 51
(Burstow, 2013) help drive RCF, yet a definitive picture of influences over crack 52
initiation and growth has not yet been established. There was suggestion by 53
Armstrong and Allery (1987) that location of RCF cracks is, in part, influenced by the 54
occurrence of low adhesion, and this paper presents data analysis to establish if there 55
is any correlation of low adhesion with sites of RCF. Better establishing the factors 56
which may contribute to crack formation and growth is intended to focus future 57
Since the primary interest is in factors not already well known to drive RCF damage 59
the Track-Ex package (Dembosky et al., 2011) which is based on the contact patch 60
energy (Tg) approach has been used to remove from the analysis locations of RCF 61
that are predicted, for example, at curves. Comparison of the Track-Ex prediction 62
with data from Network RailÕs Rail Defect Management System (RDMS) highlighted 63
RCF sites that were not predicted, supporting existence of an alternative initiation 64
process. Track-Ex makes several assumptions with regard to dynamics at the rail-65
wheel interface, focusing on lateral forces as a driver of damage. A key area in which 66
vertical rather than lateral forces are increased is around underbridges (Evans and 67
Burstow, 2006) at which there are often rapid changes of track support stiffness and a 68
high potential for vertical and lateral track misalignment. These can lead to wheel 69
unloading, and therefore a raised risk of a wheel reaching the adhesion limit. The 70
influence of very localised stiffness change and misalignment on RCF cannot be 71
predicted within Track-Ex, but removal of RCF sites that it does predict allowed this 72
study to focus on these less well explored areas. 73
1.1.
!
Geospatial Approach
74
In this paper a moving window filtering technique and a geospatial approach have 75
been used on data from a section of the UK rail network. These techniques were used 76
to correlate locations in which RCF occurs with the locations of factors that are 77
known to increase rail-wheel forces or damage: 78
(i)!Wheel slides; during which there can be a high level of heat generated at the 79
contact patch and material damage such as transformation of pearlite to brittle 80
martensite. This may subsequently lead to rail defects as described by 81
Armstrong and Allery (1987), Rail Safety & Standards Board (2003), Fletcher 82
(2014), and Scott et al. (2014). 83
(ii)!Underbridges; where the higher support stiffness over the underbridge relative 84
lateral and vertical loads, leading to track misalignment, as described by 86
Evans and Burstow (2006). 87
1.2.
!
Temporal Approach
88
In addition to geospatial correlation of RCF the temporal distribution of wheel slide 89
events was investigated using a methodology building on previous studies by Rail 90
Safety & Standards Board (2014), Arnall et al. (2015), and White et al. (2017). 91
Although usually associated with autumn problems such as rail head leaf film 92
described by Zhu (2014), Poole (2007), Pearce and Watkins (1987), and Ishizaka et 93
al. (2017), low adhesion also occurs outside the autumn period and therefore cannot 94
be solely attributed to leaf fall. On an hourly timescale reports of low adhesion are 95
non-uniform throughout the day, but understanding this is complicated since traffic 96
density also varies through the day. The aim of the temporal analysis was therefore to 97
better understand low adhesion on two timescales (i) over a year, and (ii) over a day, 98
taking account of traffic levels. 99
2.
!
Methodology
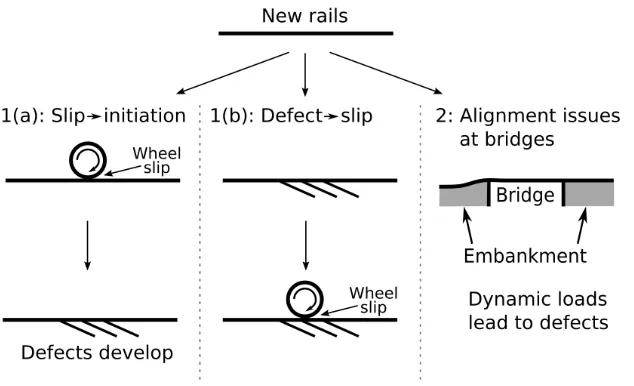
100
Within the analysis two scenarios, Figure 1, were considered in which the factors 101
outlined in Section 1.1 are present. Correlation between RCF and wheel slide 102
locations would be a result of either Scenario 1(a) or Scenario 1(b). The data are 103
unable to reveal directly whether wheel slides preceded later formation of RCF type 104
defects, or whether wheelset dynamics when crossing RCF triggers a slide. 105
Correlation between RCF and underbridge locations would demonstrate that 106
alignment issues inherent in track where the support stiffness changes abruptly 107
influences RCF formation (Scenario 2). 108
Two types of wheel slides were considered as they were thought to have different 109
causes and a different effect on the rail. (i) Momentary sliding associated with 110
analysis was undertaken to identify whether these factors correlated with recorded 113
RCF. It should be noted that these slides, identified by wheel slide protection (WSP) 114
activations, are not caused by train faults, but are a consequence of variations in rail-115
wheel adhesion and reaction of the train systems to this. 116
[image:7.612.149.466.178.371.2]117
Figure 1: Diagram of relative slip at the rail-wheel interface and crack initiation scenarios for a newly
118
installed rail initially free of damage. The stiffness and alignment fault at the bridge is exaggerated for
119
clarity.
120
2.1.
!
Data
121
Data collection focused on the West Coast Main Line (WCML) in the UK an 122
overview of which is given by Spoors (2012). This is a busy mixed traffic line 123
connecting London with Birmingham, the north of England and Scotland. It carries a 124
mix of high speed intercity, regional passenger services and freight traffic, giving in 125
the order of 2500 train movements each day. It has a mix of double and quadruple 126
track layouts, is electrified at 25kV AC, but also carries diesel powered services. Due 127
to hilly terrain and the history of construction by a series of different railway 128
companies in the 1800s 70% of the line is curved. In the early 2000s it was 129
significantly upgraded to allow 200km/h running over much of the line (Network 130
Rail, 2011). Rail surface damage data for RCF, together with locations, was collected 131
Òdown fastÓ line, i.e. the line travelling away from London, dominated by high speed 133
passenger traffic. Locations within this data were specified using an engineer line 134
reference (ELR) and track mileage, which was converted into a global positioning 135
system (GPS) reference using RailView (2017). 136
Data on bridge locations focused on underbridges, i.e. where the railway goes over 137
another feature. At these locations the support structure of the track changes over a 138
short distance, often leading to an abrupt change in track support stiffness and a high 139
likelihood of dynamically generated forces as a train (and its suspension) crosses and 140
reacts to this stiffness change. Minor alignment problems are also common near 141
underbridges since lateral as well as vertical stiffness changes with the transition onto 142
and off structure. The combination of these factors has been thought to increase rail 143
damage in these areas. The underbridges considered within the analysis ranged from 144
small culverts up to large underbridges such as viaducts and bridges crossing 145
motorways. 146
In addition to infrastructure data, wheel slide protection data was collected over a five 147
year period (2009-2013) from class 390 passenger rolling stock that operates along 148
the WCML. Only wheel slide events that occurred on the down fast line (same track 149
as the RCF) were considered. The wheel slide protection system on this rolling stock 150
records a wheel slide event when the wheel speed on a free rolling leading axle 151
present on each train differs from that of one of the three remaining braked axles on 152
the leading car. The majority of the data used within this study therefore represents an 153
individual axle undergoing sliding and not the whole train experiencing a slide. The 154
number of wheel slides found within this data is representative of any high speed 155
rolling stock operating within the UK, i.e. it is part of normal operation and not 156
caused by a rolling stock fault. 157
During the period of data collection there were no major upgrades to the WCML with 158
only routine maintenance being undertaken. The mix of rolling stock, their proportion 159
which means that locations that have a high density of RCF type defects would not be 161
expected to change. 162
2.1.1.!Filtering Wheel Slide Data
163
Wheel slide is by its nature transient, but it is long slides potentially resulting in 164
signals passed at danger (SPADs) and long sections of rail damage that are of greatest 165
concern from a safety perspective. Conversely, much shorter slide events have the 166
potential to correlate with regions of RCF crack initiation which range from size 167
comparable to the rail-wheel contact patch (~15-20mm) to a few metres in cases 168
where multiple RCF defects develop together. Long slides and momentary slides, 169
both during braking, were therefore considered separately, with the aim that 170
correlation with underlying causes would be clearer than if considering also slides of 171
intermediate length/duration. Two categories of long slides were defined: 172
¥ Category LD: Slide distance of greater than 800m (0.5 miles). 173
¥ Category LT: Slide time of greater than 15 seconds. 174
The time criterion is based on the 800m slide distance for a train with a speed of 175
200kph (125mph; maximum line speed on the WCML). These severity criteria 176
highlight events where the adhesion level available is insufficient over a prolonged 177
distance or time. 178
Two categories of momentary slide were defined: 179
¥ Category MD: Distance of less than 4.8m (0.003 miles). 180
¥ Category MT: Slide time of less than 0.1 seconds. 181
The momentary slide time criterion was based on the shortest time that it would be 182
reasonable for the wheel slide protection system to detect and record Ôan eventÕ, i.e. a 183
wheelset slide. The distance criterion is based on the 0.1 second slide time for a train 184
2.1.2.!Filtering Rolling Contact Fatigue Data
186
A Track-Ex route fleet analysis was carried out for the down fast line in ELRs LEC1-187
2 (London Euston to Stafford South), LEC4 (Stafford North to Crewe) and CGJ1-7 188
(Crewe to Carlisle). LEC3 (Stafford Station area) and LEC5 (Crewe Station area) are 189
within station areas only and were therefore not considered. RCF and adhesion data 190
were removed from further analysis for sections of line where analysis of measured 191
track geometry using Track-Ex predicted any RCF development. This is 192
demonstrated in Figure 2 where an example section of line shows how the RCF site at 193
0.7 to 0.9km is predicted by the Track-Ex analysis and would therefore be removed 194
from further consideration. This filtering process removed from the analysis RCF 195
linked to macro scale track geometry, i.e. curving. The remaining sites of observed 196
RCF (grey bands) are not explained by Track-Ex and it is therefore of far greater 197
199
Figure 2: Diagram showing the predicted Rolling Contact Fatigue from Track-Ex output against actual
200
Rolling Contact Fatigue sites from Rail Defect Management System data, demonstrating which sites
201
will be removed from the analysis.
202
2.2.
!
Geospatial Distribution and Visualisation
203
To gain an overview of the data and any locational correlations between low adhesion 204
and RCF the geospatial distribution of RCF sites that occurred within ±40m of 205
underbridges or wheel slides was examined using a geospatial visualisation. The 206
choice of proximity distance was guided by research looking at track damage 207
associated with the approaches to underbridges (Li et al., 2010). Other track 208
misalignments, for example at welds or rail joints, are known to excite the suspension 209
of the passing trains, with the potential for wheel unloading and peaks in rail-wheel 210
load some distance further along the line from the cause of excitation (Hou et al., 211
2003). The exact distances to the point of peak force or maximum damage will vary, 212
damage is of interest, or rail interior or foot damage. In mapping the location of low 214
adhesion incidents, the severity criteria outlined in Section 2.1.1 are used to define an 215
ÔeventÕ which then becomes a single data point. Although this inherently means a loss 216
of data in terms of the duration or severity of low adhesion events, the data reduction 217
is necessary to reveal the bigger picture and sufficient data remains to do this. 218
2.3.
!
Moving Window Correlation Quantification
219
To quantify correlations revealed in the geospatial visualisations a moving window 220
filtering technique, Figure 3, was used to ascertain if correlation existed between the 221
occurrence of underbridges, low adhesion and RCF sites not already explained by the 222
Track-Ex analysis. With track data segmented at 8m intervals the analysis window 223
considered data from 10 of these segments at any one time (80m of track, for which 224
chord and arc lengths are almost equal for any curve radius found on mainline track). 225
As the analysis window Òslides alongÓ the data, the model adapts as it iterates to 226
include data from the newest point and discard data from the oldest point (Wang et al. 227
(2005), Lee et al. (2001)). Through this method of gradual introduction of new points 228
and removal of old points the distribution of quantities over distance is smoothed, 229
permitting an improved analysis in determining proximity relationships. 230
[image:12.612.157.456.482.551.2]231
Figure 3: Schematic representation of the moving window filtering technique.
232
Within each analysis window the numbers of underbridges, RCF and low adhesion 233
events were counted. A baseline value of the likelihood that a factor would occur in 234
any given analysis window and the average number that occurred per analysis 235
example: when considering the likelihood of locational correlation between RCF sites 238
and underbridges, the proportion of analysis windows that contained both RCF sites 239
and underbridges was compared to the baseline proportion of analysis windows that 240
contained only RCF sites. From this a relative likelihood ratio of the occurrence of 241
RCF sites nearby underbridges has been obtained and the degree of locational 242
correlation quantified. 243
2.4.
!
Adhesion Temporal Analysis
244
In line with a methodology used in Rail Standards and Safety Board research on rail-245
wheel adhesion (RSSB, 2014) an analysis was undertaken on how the frequency of 246
wheel slides varied throughout the year and throughout the day. This highlighted the 247
time periods for which wheel slide events are more prevalent and whether the trends 248
observed remained consistent throughout the five year period studied. This allowed 249
identification of whether there is a significant rise in wheel slide events during the 250
autumn period when there are leaf layers present (Zhu et al. (2014)), or whether they 251
are distributed more evenly throughout the year, indicating that other factors such as 252
moisture on the rail head (RSSB, 2014) are a significant cause of wheel slides. 253
Similar analysis was undertaken on hourly data for wheel slide events to highlight 254
whether there were periods during the day where wheel slide events were more likely 255
to occur. A comparison was drawn between the years to ascertain whether the pattern 256
of wheel slide events remained consistent throughout the five year period studied. 257
3.
!
Results and Discussion
258
3.1.
!
Geospatial Distribution Visualisation
259
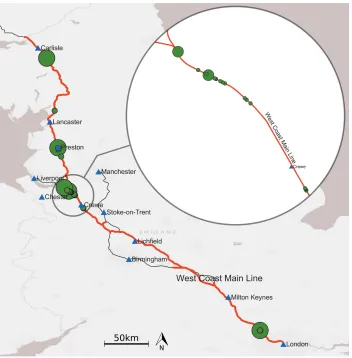
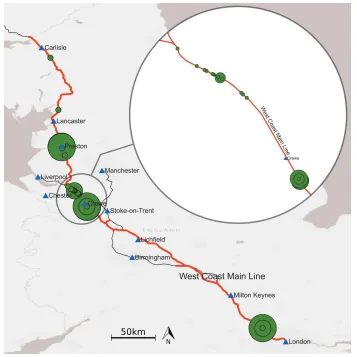
Figure 4, Figure 5 and Figure 6 show the geospatial visualisation of RCF site 260
locations on the WCML, filtered to remove RCF already predicted from track 261
geometry using the method in Section 2.1.2. For the London to Carlisle WCML 67% 262
section of line between Crewe and Runcorn. This suggests that characteristics of this 264
section of line have led to an increased number of RCF sites occurring that have not 265
been predicted from conventional consideration of track geometry. The section is just 266
over 8% of the overall London to Carlisle distance and averages one underbridge 267
every 1.6km, against approximately every 0.5km for the line overall. 268
3.1.1.!Underbridges and Rolling Contact Fatigue
269
RCF sites where an underbridge was present within ±40m are highlighted with a 270
larger filled circle in Figure 4. It was found that 23% of the RCF sites had an 271
underbridge within ±40m, although quantified analysis (Section 3.2.1) shows that 272
only 10% of the 8m line segments considered included an underbridge. This supports 273
strong correlation between bridges and RCF sites, although doesnÕt pinpoint the 274
physical cause. For example, if the railway crosses a busy road there may be 275
contamination from traffic, or rail temperature may be lower on the bridge relative to 276
surrounding ground leading to earlier dew formation that will reduce rail-wheel 277
adhesion levels. Adhesion can vary with only minor changes in rail head condition, 278
and the change at a bridge is likely to be too rapid for train systems to respond, as 279
described by Scott et al. (2014) for more general adhesion variations. The sites of 280
RCF-underbridge co-incidence are distributed throughout the study area therefore the 281
geospatial distribution did not highlight any other features such as proximity to cities 282
284
Figure 4: Distribution of RCF sites and underbridge locations. Shaded circle size indicates underbridge
285
within ±40m of RCF site: small 0, large 1. The enlarged area (10 times zoom) highlights a section of
286
line where 67% of RCF sites occurred.
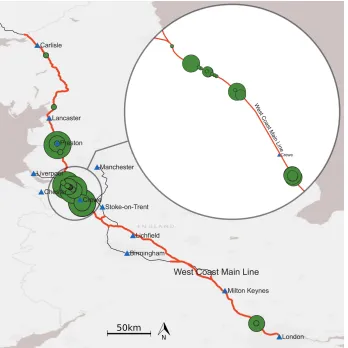
3.1.2.!Long slides and Rolling Contact Fatigue
288
Within Figure 5 sites at which a long slide occurred within ±40m of RCF damage are 289
highlighted with a filled circle. Over the whole dataset it was found that 47% of the 290
RCF sites had long slides within ±40m. Of these 78% occurred within the highlighted 291
area, in which long slides occurred within ±40m at 55% of the RCF sites. This 292
supports a locational correlation between these two factors, which is further explored 293
in Section 3.2.2. 294
[image:16.612.134.482.256.604.2]295
Figure 5: Distribution of RCF sites and long slides. Shaded circle size indicates long slides within
296
±40m of RCF site: small 0, medium 1-2, large 3+. The enlarged area (10 times zoom) highlights a
297
section of line where 67% of RCF sites occurred.
3.1.3.!Momentary slides and Rolling Contact Fatigue
300
Within Figure 6 RCF sites at which momentary slides occurred within ±40m are 301
highlighted with a filled circle. It was found that 37% of the RCF sites had 302
momentary slides within ±40m. Of these 55% occurred within the highlighted area, 303
for which momentary slides occurred within ±40m at 30% of the RCF sites. This 304
suggests locational correlation between these two factors, and this is explored further 305
in Section 3.2.2. 306
307
Figure 6: Distribution of RCF sites and momentary slides. Shaded circle size indicates momentary
308
slides within ±40m of RCF site: small 0, medium 1-2, large 3+. The enlarged area (10 times zoom)
309
highlights a section of line where 67% of RCF sites occurred.
310
[image:17.612.128.485.254.611.2]3.2.
!
Moving Window Correlation Quantification
312
3.2.1.!Underbridges and Rolling Contact Fatigue
313
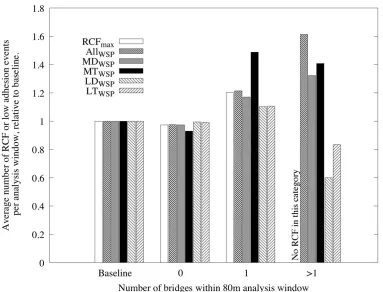
Figure 7 shows the proportion of 80m analysis windows that contained RCF and each 314
of the four categories of low adhesion event discussed in Section 2.1.1. Quantification 315
here is on a positive/negative basis for the existence of RCF or low adhesion at a 316
location and doesnÕt distinguish the number of occurrences within an analysis 317
window. Presence of underbridges is indicated, with data plotted relative to the 318
respective baseline values for each RCF or adhesion category for the whole line. The 319
baseline case is included in the plot as a visual reminder, with unity representing the 320
proportion of analysis windows that contained each type of event when considering 321
the whole line, whether or not the analysis window included an underbridge. Analysis 322
windows with underbridges present were just under 10% of the total line length 323
considered. 324
As shown in Figure 7, when there were no underbridges in the analysis window the 325
occurrence of RCF and momentary slides is just slightly below the baseline. When 326
the analysis window had a single underbridge within it then the occurrence likelihood 327
of RCF and momentary slides events increased to 1.3 times the baseline. When there 328
were multiple underbridges within the analysis window the percentage of cases that 329
also contained a momentary slides event increased to 1.9 times the baseline. For both 330
categories of long slides, the likelihood of their occurrence in the same analysis 331
window as an underbridge was close to the baseline. When the severity criteria were 332
not applied to the low adhesion events the likelihood of their occurrence in the same 333
335
Figure 7: Comparison between the proportion of analysis windows that contain RCF sites or low
336
adhesion events that occurred in the same analysis window as an underbridge, against the baseline. The
337
AllWSP case is adhesion event data without filtering by severity criteria.
338
Figure 8 shows the average number of RCF or low adhesion events that occurred per 339
analysis window giving a slightly different picture than the positive/negative 340
approach in Figure 7. All results are relative to the baseline, the average number of 341
events per analysis window that occurred when considering the whole line. The 342
average number of RCF sites that occurred increased to 1.2 times the baseline when 343
an underbridge was present. Taking the mean for the two categories of momentary 344
slide, the number of events that occurred increased to 1.3 times the baseline in the 345
same analysis window as a single underbridge. This further increased to 1.4 times the 346
baseline when there was more than one underbridge. The average number of long 347
slides that occur increased to 1.1 times the baseline in the same analysis window as a 348
single underbridge, but then decreases to 0.7 times the baseline when there was more 349
the average number that occurred in the same analysis window as a single 351
underbridge increased to 1.2 times the baseline, further increasing to 1.6 times the 352
baseline when there was more than one underbridge. 353
[image:20.612.111.494.158.450.2]354
Figure 8: Comparison between the average number of RCF sites or low adhesion events that occurred
355
in the same analysis window as an underbridge, against the baseline. The AllWSP case is adhesion
356
event data without filtering by severity criteria.
357
Out of all the analysis windows that contained underbridges, 8% had multiple 358
underbridges within them. Given that bridge sites made up just under 10% of the total 359
line length, multiple bridge sites therefore make up only 0.8% of the line length. The 360
limited number of analysis windows that match this condition meant that no RCF 361
sites met this criterion. However, the increase in both RCF site likelihood (on a 362
positive/negative basis, Figure 7) and average number of sites per analysis window 363
with a single underbridge (Figure 8) demonstrates the influence that an underbridge 364
Without the application of the severity criteria the number of analysis windows that 366
contained any type of slide event was 85% of the total number. This meant that when 367
considering the likelihood of the occurrence on a positive/negative categorical basis 368
(Figure 7) the baseline analysis window was already likely to show positive, this 369
measure being insensitive to the number of events. The increase of the average 370
number of slide events indicated in Figure 8 (i.e. quantified on a continuous rather 371
than categorical basis) better demonstrates correlation of these events with 372
underbridge locations. 373
When considering the categories of momentary slide and long slides the number of 374
analysis windows that contained these types of events was 12% and 29% of the total 375
number respectively. These lower proportions permitted the likelihood 376
(positive/negative) analysis in Figure 7 to demonstrate correlation of these events 377
with bridge location. 378
The large increase in momentary wheel slide likelihood (Figure 7) and average 379
number of events per analysis window (Figure 8) when multiple underbridges are in 380
the same analysis window supports a process where numerous stiffness changes and 381
increased instances of track misalignment within a short section of line leads to 382
momentary slide events, with the wheelset not able to accommodate the sudden 383
changes in track alignment. 384
No correlation was found between the likelihood of long slides and underbridge 385
locations. This was expected as the stiffness changes associated with underbridges are 386
local and would not affect the adhesion level over 800m of track, the criterion for a 387
ÒlongÓ slide. The underlying cause of negative correlation in the number of long 388
slides that occurred in the same analysis window as multiple underbridges (Figure 8) 389
cannot be confirmed with the available data. An observation is that a key influence 390
behind this correlation would be the proportion of underbridges within heavy braking 391
areas such as on the approach to stations or signals since a long slide would only be 392
likely during braking. The different responses to the presence of an underbridge for 393
have different causes, and in a future analysis it may be useful to include locations 395
dominated by braking as a factor in the analysis. 396
3.2.2.!Low Adhesion and Rolling Contact Fatigue
397
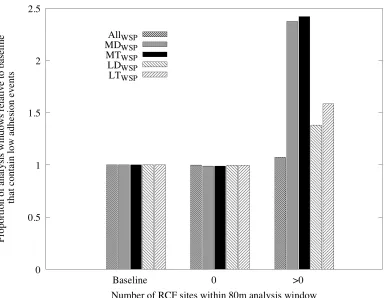
Locational correlation between sites of RCF and low adhesion events is shown in 398
Figure 9. For sites without RCF the data were almost identical to baseline values for 399
the whole line. Without severity criteria applied to the low adhesion events the 400
likelihood of their occurrence (positive/negative basis) in the same analysis window 401
as a site of RCF increased to 1.1 times the baseline. Filtering the adhesion data, the 402
likelihood of momentary slide occurring within the same analysis window as RCF 403
was 2.4 times the baseline considering an average of the MD and MT categories. The 404
likelihood of long slides occurring within the same analysis window as a site of RCF 405
407
Figure 9: Comparison between the proportion of analysis windows that contain low adhesion events in
408
the same analysis window as a RCF site, against the baseline
[image:23.612.67.507.97.650.2]409
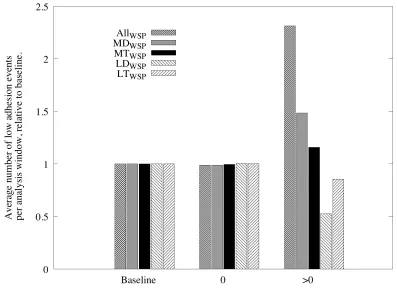
Figure 10 shows how the average number of low adhesion events is correlated with 410
the presence of RCF. Without severity criteria applied to the adhesion events 411
(ALLWSP in the figure) the average number that occurred in the same analysis
412
window as a site of RCF increased to 2.3 times the baseline. The average number of 413
momentary slide events that occurred within the same analysis window as RCF was 414
1.3 times the baseline as an average of the MD and MT categories. The average 415
number of long slides that occurred within the same analysis window as RCF was 0.7 416
times the baseline when taking the average for the LD and LT categories. As 417
indicated by the subscript ÔWSPÕ (wheel slide protection) in the figures, these slides 418
420
Figure 10: Comparison between the average number of low adhesion events in the same analysis
421
window as a RCF site, against the baseline
422
Without the application of the severity criteria the number of analysis windows that 423
contained low adhesion events was 85% of the total number, making the binary 424
method of quantification insensitive and leading to only small changes in the 425
likelihood results for RCF correlation in Figure 9. The change in average number of 426
low adhesion events that occurred per analysis window shows much greater 427
sensitivity. For momentary slide the increase in both the likelihood (Figure 9) and the 428
average number of events per analysis window (Figure 10) when co-incident with 429
RCF supports the hypothesis that locational correlation exists between momentary 430
slides and RCF sites, although this is not a causal link. 431
For longer slides Figure 10 shows a reduction in the number of events when 432
[image:24.612.102.499.92.380.2]low adhesion events when coincident with RCF could not be established from the 435
data, however, it is notable that the trend to increased likelihood (Figure 9) is much 436
weaker for long slides than for momentary ones. It is possible that while the data 437
filtering applied has helped reveal the strong correlation for momentary slides with 438
locations of RCF it has also removed some potentially useful data on longer slides. 439
Looking at the data visualisation for longer slides in Figure 5 it can be seen that over 440
three quarters of the longer slide events happened in one geographical area. The 441
binary analysis showing a positive correlation between long slides and RCF locations 442
is most representative of this highly concentrated area, whereas the quantified 443
analysis showing a negative correlation would better represent the rest of the area in 444
which there was limited co-incidence of long slides and RCF. 445
It is important to consider that although a single RCF crack would be classed as 446
ÔheavyÕ if having a visible surface crack length over 20mm, and ÔsevereÕ if over 447
30mm (Railtrack, 2001) these cracks rarely occur in isolation, but more often in 448
significant quantity giving them more potential to influence the adhesion over a 449
prolonged section of track. Together with the geospatial differences this indicates that 450
additional factors not captured in the quantified analysis would need to be considered 451
to get a deeper understanding of links between long slides and RCF. 452
3.3.
!
Temporal Analysis
453
Building on the geospatial analysis, temporal analysis was conducted to find both 454
yearly and daily patterns in low adhesion events. The monthly temporal analysis 455
(Figure 11) highlighted periods during the year when wheel slide events occurred. 456
Note that these refer predominantly to momentary wheel slide protection events, and 457
not to safety critical events such as signals passed at danger. There was some 458
variation between years, as would be expected since weather conditions are a key 459
determinant of adhesion conditions, however, the behaviour each year was similar 460
and could be well represented by the monthly average of the data (dark line). Taking 461
not cover every month of those years. It was found that the three month autumn 463
period (October to December) contained the greatest proportion of the yearly total of 464
low adhesion events (40-45%), with occurrence peaking in November. This is in line 465
with the general understanding for the UK that low adhesion is a problem during 466
autumn. However, Figure 11 also shows that 55-60% of wheel slide events are 467
distributed throughout the remaining 9 months of the year. Therefore, although fewer 468
events happen per month, a greater number of events in total occur outside the 469
autumn period. 470
[image:26.612.108.449.264.530.2]471
Figure 11: Number of wheel slide events that occurred per month. Note that these refer predominantly
472
to momentary wheel slide protection events, and not to safety critical events such as signals passed at
473
danger.
474
In addition to the through year analysis an hourly temporal analysis was undertaken 475
using two approaches. In approach A, Figure 12, the data were presented as the total 476
number of wheel slide events in each hour summed across each year, expressed as as 477
al. (2017). Approach A highlights that the highest number of wheel slide events 480
occurred between 06:00 and 10:00AM, the morning Ôrush hourÕ period where the 481
consequences of delay can be severe due to high traffic density and the potential for 482
extensive Ôknock-onÕ of delay to later in the day. There is also a small evening peak 483
in adhesion events, however, it is much smaller than the morning peak. Data on 484
traffic density (see below) show similar traffic at morning and evening peaks, so the 485
distribution of adhesion events cannot be explained as simply a consequence of high 486
traffic density in the morning peak. Other factors such as rail surface oxide formation 487
overnight when traffic is lighter, its subsequent removal by traffic during the day or 488
differing rates of dew formation and evaporation are also important. Rail temperature 489
would be expected to vary throughout the day, potentially leading dew to form 490
railhead ice in colder periods. However, the running temperature of wheels is raised 491
by frictional energy dissipation at the rail-wheel contact (Ertz and Knothe, 2002; 492
Scott et al., 2014). Combined with pressure melting (Bottomley, 1872; Sanz et al., 493
2004) this makes it unlikely ice would survive to influence adhesion. 494
[image:27.612.97.453.409.674.2]495
Figure 12: Number of wheel slide events that occurred per hour, Method A (no normalisation)
In approach B, Figure 13, the low adhesion event data summed across the years 2009-497
13 are presented alongside hourly data on station stops attempted each day. The 498
station stop data are mean values from timetable information for the whole UK 499
network on Monday 28th October 2013 and Friday 3rd January 2014. It was not 500
intended to match station stop data to exactly the trains on which low adhesion 501
incidents occurred, but rather to use it as an indication of traffic density throughout 502
the day. Using this data a value is generated (right scale of Figure 13) by dividing 503
national station stops each hour by the number of low adhesion wheel slide protection 504
activations observed per hour. This must be interpreted carefully since the differing 505
data sources make strict interpretation as station stops per low adhesion incident 506
incorrect. It is also important to reiterate that the low adhesion events refer 507
predominantly to momentary low adhesion wheel slide events, and not to safety 508
critical events such as signals passed at danger. 509
The normalisation in approach B shows that the time period in which an individual 510
train had the highest chance of experiencing a wheel slide low adhesion problem was 511
between 03:00 and 03:59AM, during which the lowest number of station stops take 512
place (nationally) per low adhesion incident observed. The number of low adhesion 513
events observed is low during this time (~1800) but since traffic density is low 514
(indicated by ~110 station stops in that hour) each train has a higher chance of 515
experiencing a problem than at other times of day. The figure for national station 516
stops per observed incident rises gradually through the morning to reach a daytime 517
plateaux by around 11am. There is a small dip in the early evening, but risk 518
diminishes greatly (i.e. more stops per incident) in the late evening. Normalisation of 519
the low adhesion data by traffic density supports the supposition from Figure 12 that 520
traffic density is not the controlling factor since low adhesion risk persists through the 521
morning peak in traffic, but only marginally affects the evening peak. 522
524
Figure 13: Number of wheel slide events that occurred per hour for observed services 2009-2013,
525
normalised by national number of station stops per hour (Method B).
526
4.
!
Conclusions
527
A moving window filtering technique has been applied, showing that there was a 528
significant increase in RCF in the vicinity of an underbridge. Underbridge sites were 529
characterised by an increase in RCF likelihood (i.e. presence of any RCF) to 1.3 times 530
the baseline, while there was an increase in the average number of RCF sites (a 531
quantitative rather than a binary measure) to 1.2 times the baseline in the same 80m 532
analysis window as an underbridge. There was a strong correlation between 533
momentary slides and underbridge locations with an increase in the likelihood 534
(presence/absence) of momentary slides to 1.9 times the baseline and an increase in 535
the average number of events that occurred per analysis window (quantified basis) to 536
1.4 times the baseline in the same analysis window as multiple underbridges. The 537
data showed no clear correlation between the likelihood of long slides and 538
[image:29.612.101.447.90.357.2]equal to the baseline, and the average number of events occurring per analysis 540
window decreasing to 0.7 times the baseline in the same analysis window as multiple 541
underbridges. The reasons for this decrease could not be established from the data 542
available. 543
The increase in both the likelihood (2.4 times the baseline) and the average number 544
(1.3 times the baseline) of momentary slide events per analysis window in the same 545
analysis window as a RCF site supports the hypothesis that locational correlation 546
exists between momentary slides and RCF sites, although this is not necessarily a 547
causal link. This has been corroborated by geospatial distribution visualisation which 548
presented data graphically on maps of the UK West Coast Mainline. The negative 549
correlation between the average number (0.7 times the baseline) of long slides that 550
occurred and RCF sites whilst positive correlation between the likelihood (1.5 times 551
the baseline) of long slides occurring and RCF sites did not support a direct locational 552
correlation hypothesis. Geospatial visualisation in this case showed distinct 553
differences in the level of correlation between different regions, suggesting additional 554
factors need to be introduced to the analysis to better understand any correlation 555
between long sides and RCF. 556
A temporal analysis highlighted that low adhesion occurs both during and outside the 557
autumn period and therefore cannot be solely attributed to leaf fall. With 40-45% of 558
the yearly total of wheel slide low adhesion events occurring during autumn this 559
analysis highlights that low adhesion is still a problem that can affect train 560
performance throughout the rest of the year, although at a lower rate of events per 561
month. 562
When analysed by the total number of incidents it was found that the time period 563
where low adhesion is most prevalent falls within the busy morning period where the 564
consequences of delays on passengers are most severe. Since this morning period 565
may be influenced by both high traffic density and high risk of low adhesion a 566
highest risk of low adhesion for an individual train is in the very early morning (3-569
3:59am). This risk diminishes by 11am (i.e. a rise in the number of station stops 570
taking place on the network per incident observed) and risk rises only marginally in 571
the evening peak traffic period. 572
Acknowledgements
573
The authors are grateful to Omnicom Ltd for provision of access to RailView 574
software, to Michael Jacks at Virgin Trains for provision of train based data, and to 575
Mark Burstow, Brain Whitney and Andrew Cornish at Network Rail for helpful 576
suggestions, provision of track based data and assistance with Track-Ex. Funding for 577
the research was provided by Network Rail and an EPSRC doctoral training 578
scholarship. 579
References
580
Armstrong, DS, Allery, M, (1987) Rail Damage due to Wheelspin, Report TM-TBC-581
009, British Rail Research, available from www.sparkrail.org. 582
Arnall, AD, Fletcher, DI, Lewis, R (2015) Geospatial and Temporal Analysis of 583
Wheel Slide Events, Proceedings of the 10th International Conference on Contact
584
Mechanics and Wear of Rail Wheel Systems, Colorado, USA, 30 August 2015 - 3
585
September 2015. 586
Bottomley, J (1872) Melting and Regelation of Ice, Nature, 5: 185, 587
doi:10.1038/005185a0 588
Burstow, M, (2013) Experience of premium grade rail steels to resist rolling contact 589
fatigue (RCF) on GB network, Ironmak. Steelmak, 40: 103Ð107. 590
doi:10.1179/1743281212Y.0000000042. 591
Dembosky, MA, Greenwood, SP, Doherty, A (2011) Minimising rail lifecycle costs 592
using Track-Ex damage and cost estimates, Proceedings of the World Congress
593
Railway Research (WCRR), Lille, France, May 22-26, 2011.
Ertz, M, Knothe, K (2002) A comparison of analytical and numerical methods for the 595
calculation of temperatures in wheelÐrail contact, Wear, 253: 498Ð508. 596
doi:10.1016/S0043-1648(02)00120-5 597
Evans, JR, Burstow, MC (2006) Vehicle/track interaction and rolling contact fatigue 598
in rails in the UK, Vehicle System Dynamics, 44: 708Ð717. 599
doi:10.1080/00423110600883652. 600
Fischer, FD, Daves, Pippan, WR, Pointer, P (2006) Some comments on surface 601
cracks in rails, Fatigue Fract. Eng. Mater. Struct, 29: 938Ð948. 602
doi:10.1111/j.1460-2695.2006.01051.x. 603
Fletcher, DI (2014) Numerical simulation of near surface rail cracks subject to 604
thermal contact stress, Wear, 314: 96Ð103. doi:10.1016/j.wear.2013.11.021. 605
Fletcher, DI, Beynon, JH, (2000) Equilibrium of crack growth and wear rates during 606
unlubricated rolling-sliding contact of pearlitic rail steel, Proc. Inst. Mech. Eng.
607
Part F J. Rail Rapid Transit, 214: 93Ð105. doi:10.1243/0954409001531360.
608
Fletcher, DI, Kapoor, A, Franklin, FJ, Smith, L, Hyde, P (2006) Comparison of the 609
Hatfield and alternative UK rails using models to assess the effect of residual 610
stress on crack growth from rolling contact fatigue, Research Report 461, Health 611
and Safety Executive, Her Majesty's Stationery Office, St Clements House, 2-16 612
Colegate, Norwich, NR3 1BQ, available from 613
http://www.hse.gov.uk/research/rrpdf/rr461.pdf 614
Grassie, SL (2015) Traction, curving and surface damage of rails, Part 2: Rail 615
damage, Proc. Inst. Mech. Eng. Part F J. Rail Rapid Transit, 229: 330Ð339. 616
doi:10.1177/0954409714541648. 617
Grassie, SL, Elkins, JA (2005) Tractive effort, curving and surface damage of rails, 618
Hou, K, Kalousek, J, Dong, R (2003) A dynamic model for an asymmetrical 620
vehicle/track system, Journal of Sound and Vibration, 267: 591Ð604. 621
doi:10.1016/S0022-460X(03)00726-0. 622
Ishizaka, K, Lewis, SR, Lewis, R (2017) The Low Adhesion Problem due to Leaf 623
Contamination in the Wheel/Rail Contact: Bonding and Low Adhesion 624
Mechanisms, Wear, 378-379: 183-197. 625
Kapoor, A, Schmid, F, Fletcher, D (2002) Managing the critical wheel/rail interface, 626
Railway Gazette International: 001/02, 25Ð28.
627
Lee, C, Lin, C, Chen, M (2001) Sliding-Window Filtering: An Efficient Algorithm 628
for Incremental Mining, Proceedings of the ACM Conference on Information and
629
Knowledge Management, 2001: pp 263Ð270.
630
Li, D, Otter, D, Carr, G (2010) Railway bridge approaches under heavy axle load 631
traffic: problems, causes, and remedies, Proc. Inst. Mech. Eng. Part F J. Rail
632
Rapid Transit, 224: 383Ð390. doi:10.1243/09544097JRRT345.
633
Network Rail (2011) West Coast Main Line Route Utilisation Strategy, RUS146/July 634
2011, Network Rail Kings Place, 90 York Way London N1 9AG 635
Pearce, TG, Watkins, DJ (1987) Adhesion and Leaves - A Review of the Problem and 636
Potential Solutions, Report TM-VTI-017, British Rail Research, available from 637
www.sparkrail.org. 638
Poole, W (2007) Characteristics of railhead leaf contamination: Summary report, 639
Report T354, Rail Safety & Standards Board, 1 South Place, London, EC2M 640
2RB, available from www.sparkrail.org. 641
Rail Safety & Standards Board (2003) ERTMS adhesion management: An 642
Assessment of the Available Adhesion and Slip Risk for ERTMS, Report T080. 643
RSSB, 1 South Place, London, EC2M 2RB, June 2003, available from 644
Rail Safety & Standards Board (2014) Investigation into the Effect of Moisture on 646
Rail Adhesion, Report T1042. RSSB. 1 South Place, London, EC2M 2RB, 2014, 647
available from www.rssb.co.uk. 648
Railtrack (2001) Rolling contact fatigue in rails: A guide to current understanding and 649
practice, Report RT/PWG/001, Issue 1. Railtrack Plc, Euston Square, London, 650
NW1 2EE. 651
RailView (2017) Omnicom Engineering Limited, http://www.rail-652
view.co.uk/RailView/Default.aspx (accessed Sept 20, 2017). 653
Sanz E, Vega C, Abascal JL, MacDowell LG (2004) Phase diagram of water from 654
computer simulation, Phys Rev Lett, 92: 255701-1 - 255701-4 655
Scott, D, Fletcher, DI, Cardwell, BJ (2014) Simulation study of thermally initiated 656
rail defects, Proc. Inst. Mech. Eng. Part F J. Rail Rapid Transit, 228: 113Ð127. 657
doi:10.1177/0954409712465697. 658
Spoors, R (2012) Modern track renewal on the West Coast Main Line, RTR - Rail
659
Technology Review, ISSN 1869-7801, DVV Media Group, Eurailpress, Postfach
660
101609 D-20010 Hamburg, 4: 8-12. 661
Wang, X, Kruger, U, Irwin, GW (2005) Process Monitoring Approach Using Fast 662
Moving Window PCA, Industrial & Engineering Chemistry Research, 44: 5691Ð 663
5702. doi:10.1021/ie048873f. 664
White, BT, Nilsson, R, Olofsson, U, Arnall, AD, Evans, MD, Armitage, T, Fisk J, 665
Fletcher DI, Lewis, R, (2017) A study into the effect of the presence of moisture 666
at the wheel/rail interface during dew and damp conditions, Proc. Inst. Mech.
667
Eng. Part F J. Rail Rapid Transit, 232: 979Ð989.
668
doi.org/10.1177/0954409717706251 669
Zhu, Y, Olofsson, U, Nilsson, R (2014) A field test study of leaf contamination on 670
railhead surfaces, Proc. Inst. Mech. Eng. Part F J. Rail Rapid Transit, 228: 71Ð 671
Figures
673
Figure 1: Diagram of relative slip at the rail-wheel interface and crack initiation scenarios for a newly
674
installed rail initially free of damage. The stiffness and alignment fault at the bridge is
675
exaggerated for clarity.
676
Figure 2: Diagram showing the predicted Rolling Contact Fatigue from Track-Ex output against actual
677
Rolling Contact Fatigue sites from Rail Defect Management System data, demonstrating
678
which sites will be removed from the analysis.
679
Figure 3: Schematic representation of the moving window filtering technique.
680
Figure 4: Distribution of RCF sites and underbridge locations. Shaded circle size indicates underbridge
681
within ±40m of RCF site: small 0, large 1. The enlarged area (10 times zoom) highlights a
682
section of line where 67% of RCF sites occurred.
683
Figure 5: Distribution of RCF sites and long slides. Shaded circle size indicates long slides within
684
±40m of RCF site: small 0, medium 1-2, large 3+. The enlarged area (10 times zoom)
685
highlights a section of line where 67% of RCF sites occurred.
686
Figure 6: Distribution of RCF sites and momentary slides. Shaded circle size indicates momentary
687
slides within ±40m of RCF site: small 0, medium 1-2, large 3+. The enlarged area (10 times
688
zoom) highlights a section of line where 67% of RCF sites occurred.
689
Figure 7: Comparison between the proportion of analysis windows that contain RCF sites or low
690
adhesion events that occurred in the same analysis window as an underbridge, against the
691
baseline. The AllWSP case is adhesion event data without filtering by severity criteria.
692
Figure 8: Comparison between the average number of RCF sites or low adhesion events that occurred
693
in the same analysis window as an underbridge, against the baseline. The AllWSP case is
694
adhesion event data without filtering by severity criteria.
695
Figure 9: Comparison between the proportion of analysis windows that contain low adhesion events in
696
the same analysis window as a RCF site, against the baseline
697
Figure 10: Comparison between the average number of low adhesion events in the same analysis
698
window as a RCF site, against the baseline
699
Figure 11: Number of wheel slide events that occurred per month. Note that these refer predominantly
700
to momentary wheel slide protection events, and not to safety critical events such as signals
701
passed at danger.
702
Figure 12: Number of wheel slide events that occurred per hour, Method A (no normalisation)
703
Figure 13: Number of wheel slide events that occurred per hour for observed services 2009-2013,
704
normalised by national number of station stops per hour (Method B).