Int. J. Electrochem. Sci., 7 (2012) 2928 - 2937
International Journal of
ELECTROCHEMICAL
SCIENCE
www.electrochemsci.org
Interference Effect of Various Ions on Determination of Iron
with Flow Injection Analysis Using the Potentiometric
Technique
Marija Bralić1, Maša Buljac1,*
, Marijo Buzuk1, Slobodan Brinić2 1
Department of Environmental Chemistry, Faculty of Chemistry and Technology, Teslina 10/V, 21000 Split, Croatia
2
Department of General and Inorganic Chemistry, Faculty of Chemistry and Technology, Teslina 10/V, 21000 Split, Croatia
*
E-mail: [email protected]
Received: 13 February 2012 / Accepted: 14 March 2012 / Published: 1 April 2012
Fluoride-selective electrode (FISE) was used for determination of Fe3+ using home-made cell for flow injection analysis (FIA). Lowest signal obtained for this system was 10-5 M, with slope of 28.9 mV per decade at pH 3.4 and flow rate of 2.86 mL/min. Influence of various cations and anions on determination of Fe3+ was examined. In the presence of 0.01 M cations significant interference did not noticed, except slightly parallel shift (within 10 mV) in the slope of the calibration curves. Contrariwise, determination of Fe3+ in the presence of various anions (particularly SCN-, S2O82-, SO32-) was significantly obstructed. However, these interferences can be occurred at high concentration of interfering anions and does not disturb determination of Fe3+ in real samples. The results of real samples analysis, with this system, were compared to those obtained by FAAS.
Keywords: FISE, iron (III), flow injection analysis, interference
1. INTRODUCTION
Iron can exist as inorganic species of Fe3+ or Fe2+, be organically complexed, exist as colloids of oxides, oxyhydroxides or mixed with organic material, and be suspended as both biotic and abiotic particles. [3]. Iron is an essential nutrient and is abundant in many mineral oxides that exchange iron with surface and ground waters trough dissolution and precipitation.
Numerous analytical techniques for determining aqueous iron concentration have been developed and deployed, including titrimetric, electrochemical, chromatographic, ultracentrifugation and photometric methods [4]. Also, potentiometric determination of iron was reported 5, 6. Most of electrodes used in potentiometry were either solid-state or ionophore-free, ion-exchange electrodes; ionophore-based membrane sensors for Fe3+ ion are quite spares. Moreover, most of these electrodes suffer a lack of stability, selectivity or long response time [7]. Furthermore, even less papers were publicized in which FISE has been described as a detector for the determination of iron [8, 9]. When determining Fe3+ with ISE, correct choice of pH is important as it affects both the formation of Fe3+ complex and the linearity of FISE response [10]. The selectivity of ion-selective electrodes (ISE), i. e., their behavior in the presence of interfering ions, has been of interest as long as ISE have existed.
The available literature [11, 12, 13] describes the various methods for determination of trace amount of various metals.
In this paper, we report a novel potentiometric method and effect of various ions on determination of Fe3+, in flow injection analysis (FIA) with home-made flow cell.
2. EXPERIMENTAL
2.1. Instrumentation
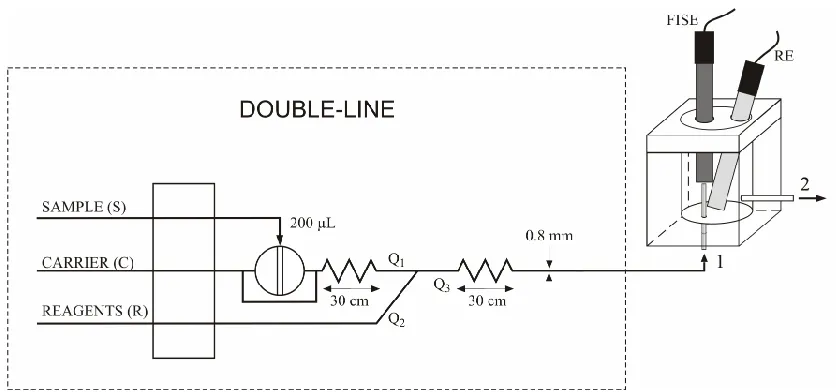
An Orion fluoride ion-selective electrode (FISE) Model 94-09 SC was placed into conducts of the flow and flow injection system as shown in Figure 1.Potentiometric data were recorded with a millivoltmeter (Model MA 5741, Iskra, Slovenia) coupled to a personal computer and recorder.
The flow system consisted of a peristaltic pump (Minipuls 2, Gilson, France), fitted silicone rubber tubing of 0.8 mm id. and an injection valve (model V-100, Tecator, Sweden). The outlet of the injector was connected to the flow cell via silicone tubing of 0.8 mm id.
The measurements were provided at constant temperature of 25 1 °C.
2.2. Cell design
[image:3.596.87.505.179.375.2]
mm away. The stream of the solution wets the whole area of the membrane and, pouring down the reference electrode, effectuates the electric contact between the working and reference electrode. The reference electrode is in contact with rest of the solution, the volume of wich is about 2 mL. The opening for out flow (2) is positioned at a high of 5 mm from the cell bottom. The reference electrode is always dipped 2 mm above the cell bottom.
Figure 1. The home-made cell and apparatures used in flow analysis
2.3. Reagents
All chemicals were of analytical reagent grade. Solutions were prepared with doubly distilled water.
Standard sodium fluoride solution, 0.1 M was prepared in a calibrated polypropylene flask from dried (110 C°) sodium fluoride. Dilute standard fluoride solution was prepared by mixing standard sodium fluoride with 0.1 M KNO3 and acetate buffer, using propylene flask and pipettes. pH 2.8 or 3.4 buffers were prepared by diluting glacial acetic acid and sodium acetate. The stock Fe3+ solution 0.1 M was prepared by weighing and dissolving an appropriate amount of Fe3+ nitrate in 0.1 M KNO3 and acetate buffer (pH 2.8 or 3.4). The Fe3+ was titrated by a standardized 0.01 M EDTA solution. Other solutions of iron were prepared from the stock solution by dilution with 0.1 M KNO3 and acetate buffer (pH 2.8 or 3.4). Solutions of interfering ions were prepared on same way as Fe3+ solution.
2.4. Measurement Procedure
potassium nitrate buffered on pH 2.8 or 3.4 with acetate buffer and 2 × 10⁻⁶ M sodium fluoride solution which mixed together. After the injection valve such a mixture came on the FISE.
The potentiometric response of electrochemical cell was monitored with milivolltmeter and potentiometric data were continuously recorded by a personal computer.
2.5. Real Sample-Soil
Before analysis, the soil sample was dried and sieved trough a 2 mm stainless steel sieve in order to remove the coarse material. The following procedures were implemented for the extraction and determination of Fe3+ and /or total iron.
A) A portion of sample (50 g) was shaken with 0.1 M HCl (500 mL) for 24 hours to extract the fraction of Fe. After filtration, in the clear filtrate, Fe3+ was determined.
B) An amount of soil (50 g) was shaken with 2.5% HAc (500 mL) for 24 hours to extract the fraction of Fe. After filtration, in the clear filtrate, Fe3+ was determined.
3. RESULTS AND DISCUSSION
3.1. Mechanism of potentiometric response
The optimized flow conditions (FC) were similar to those found in early studies [8].
It was noticed that the potential change per concentration decade is a function of the time and resources necessary to perform measurements at the same time.
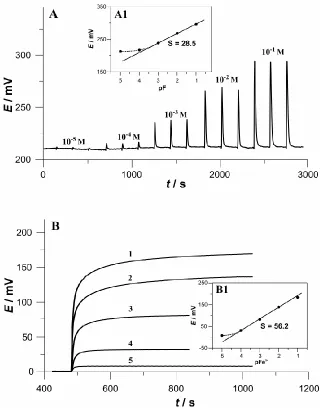
Figure 2 presents results obtained with FI (A) and classic potentiometric (B) measurements. A linear response at flow rate of 2.86 mL/min for Fe3+ concentration higher than 1.0 x 10⁻³ M, with slopes of 28.5 and 28.9 mV per decade (at pH 2.8 and 3.4 respectively), was observed. When flow rate was 3.45 mL/min, the slope was 25.9 mV at both pH values. Furthermore, at classic potentiometric measurement slope was 56.2 mV per decade and 55.3 mV per decade at pH 2.8 and 3.4 with linear range down to 4.5 x10⁻⁴ M.
In the presence of fluoride, electrode potential at different pH is given by following expression:
E = konst. –S log c’F 1 + KHF H+ (1)
where S, c’F and KHF denote the Nernstian slope (59 mV), total or analytical concentration of fluoride and the formation constant of HF ( KHF = 7.93 x 10² M), respectively.
However, at sufficient Fe3+ concentration, formation FeFn(3-n)+ complexes induce decreasing of fluoride concentration by reaction:
Figure 2. (A) The peaks obtained for injection of Fe3+; (A1) relationship between peak height and concentration of Fe3+; (B)The dynamic response curve of the cell with FISE after adding 2.0 ml Fe3+ , (B1) The relationship between the potential and concentration of Fe3+.
For cFe(III) cF, n is expected to be 1 and consequently, the slope should be 59 mV per decade (theoretical), respect to our investigation it should be 56.2 and 55.3mV per decade.
According above stoichiometry, electrode potential after injection of Fe3+ can be presented by equation (3)
E = konst.- S log
1 2 2 * 1 * ' ' / / 1/ H H
c c c F Fe F (3)
where 1 i i* (i= 1,2) represent stability constant of FeF2+ and hydrolysis of Fe3+
i
ii
i FeOH Fe3 H )
3 ( *
/
[image:5.596.137.459.66.476.2]
After injection of Fe3+ peak hight in FIA experiment can be given by equation (5)
2
2 * 1
* 1
'
/ /
1 log 1
log log
log
S c c K H H H
h Fe F HF (5)
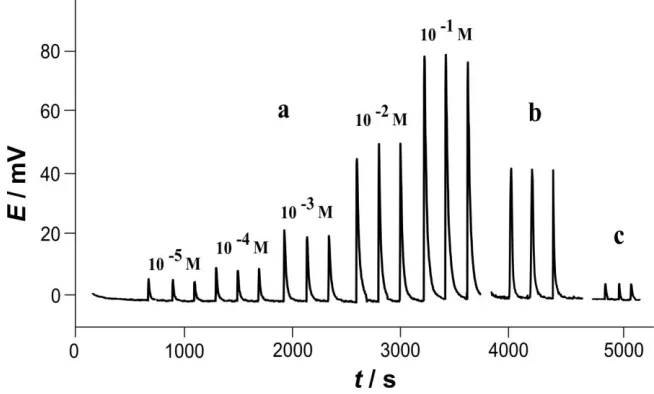
Response toward F-, in the concentration range between 10-5 to 10-1 M, was fast (within few seconds) and reproducible. Respecting the last equation (5), when only one complex was dominant, stoichiometry of the reaction product can be determined from dependence between peak height (h) and log c(Fe3+). According above, from experimental slope of 28.5 and 25.9 mV per decade (in dependence of pH, respectively), formation of FeF2+, instead expected FeF2+, can be assumed.
3.2. Interferences
[image:6.596.124.472.360.649.2]The selectivity of ion-selective electrodes (ISE), i.e., their behavior in the presence of interfering ions, has been of interest as long as ISE have existed. In the available literature, only interference on the determination of fluoride ions were examined [17,18,19].
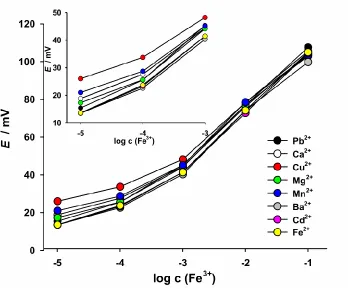
Figure 3. Dependence of peak height vs. log c (Fe3+) in the presence of various cations (c= 0.01 M) at pH=2.8. Inlet: Enlarged region around detection limit.
rate (2.8 and 3.45 mL/min ). These conditions provide enough time for completing the reaction between involved species.
Figure 4. Dependence of peak height vs. log c (Fe3+) in the presence of various anions (c= 0.01 M except c(HPO42-)= 1 × 10⁻⁵ M; c(CO32-)= 1 × 10⁻³ M) at pH= 2.8
[image:7.596.145.491.116.410.2] [image:7.596.129.470.497.720.2]
Although interferences of investigated cations, according available data for complex formation and solubility products, were not expected, slightly parallel shift (within 10 mV) of calibration curves (peak height vs. concentration of Fe3+) were obtained in the presence of various cations (c(X) = 0.01 M) (see Figure 3). This shift, which is more discernible at low concentration of Fe3+ (see inlet of Figure 3) and it is followed by deterioration in detection limit, can be attributed to change of ionic strength in the sample stream, if we bearing on mind high concentration of interfering cations.
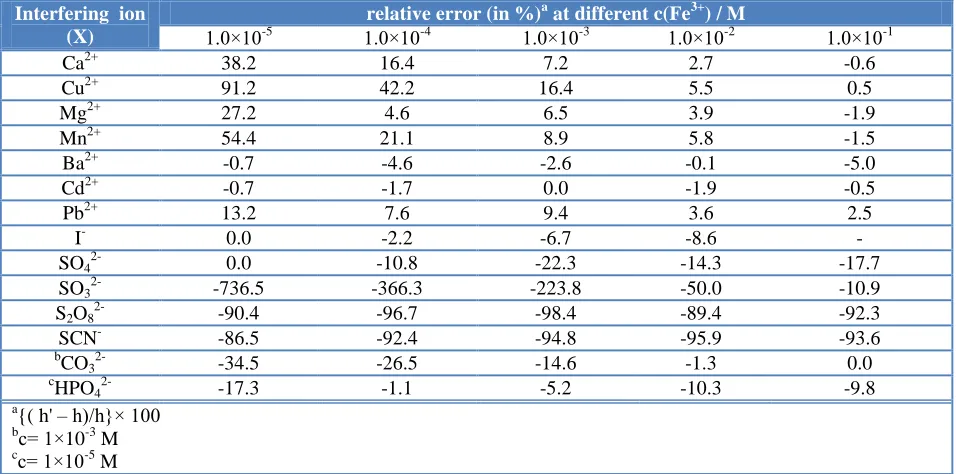
Table 1. Relative error (in %) calculateda from peak height obtained, at pH 2.8, by injection of different Fe3+ concentration in (h') and without (h) presence of interfering ion (c(X) = 0.01 M).
Interfering ion (X)
relative error (in %)a at different c(Fe3+) / M
1.0×10⁻⁵ 1.0×10⁻⁴ 1.0×10⁻³ 1.0×10⁻² 1.0×10⁻¹
Ca2+ 38.2 16.4 7.2 2.7 -0.6
Cu2+ 91.2 42.2 16.4 5.5 0.5
Mg2+ 27.2 4.6 6.5 3.9 -1.9
Mn2+ 54.4 21.1 8.9 5.8 -1.5
Ba2+ -0.7 -4.6 -2.6 -0.1 -5.0
Cd2+ -0.7 -1.7 0.0 -1.9 -0.5
Pb2+ 13.2 7.6 9.4 3.6 2.5
I- 0.0 -2.2 -6.7 -8.6 -
SO42- 0.0 -10.8 -22.3 -14.3 -17.7
SO32- -736.5 -366.3 -223.8 -50.0 -10.9 S2O8
2--90.4 -96.7 -98.4 -89.4 -92.3
SCN- -86.5 -92.4 -94.8 -95.9 -93.6
bCO
32- -34.5 -26.5 -14.6 -1.3 0.0
cHPO
42- -17.3 -1.1 -5.2 -10.3 -9.8
a
{( h' – h)/h}× 100 bc= 1×10⁻³ M cc= 1×10⁻⁵ M
For clearer representation of deviation of obtained peak high in the presence of 0.01 M (except CO32- and HPO42-) interfering ions, relative errors at each concentration of Fe3+ are given in Table 1.
Drastically deviations were observed in the presence of various anions (see Figure 4). These deviation were manifested in decreasing of slope and deterioration of detection limit (for HPO42-, I-, SO42-) and can be explain by oxidoreduction reactions in the case of I-, SO32-. Precluding of determination in the presence of SCN- is probably due to strong complexation of Fe3+ with SCN -(
3
) (SCN Fe
K ≈ 109). Same problem was probably responsible for interference occurred in the case of HPO42-, even at concentration of 1.0 × 10⁻⁵ M (at this pH dominant form is H2PO42-; 1024
4 2 PO FeH K ).
Influence of S2O82- can be attributed to decomposition of S2O82- in weak acid media to HSO4- and O2 and strong interference of produced oxygen, as it is known that LaF3 was used as potentiometric sensors for detection of O2 in water 20. Presence of CO32- did not significantly influenced on the determination of Fe3+ comparing to other examined anions.
[image:8.596.60.538.242.479.2]
Insufficient number of published papers, concerning FIA method for determination of Fe3+, does not allow a quality comparison of proposed method in this paper. Chen and Alexander 21 proposed use of tungsten oxide electrode in FIA for determination of Fe3+. However, lack of selectivity was noticed, as tungsten oxide electrode was also selective for Cu2+, Pb2+ and Ca2+. Teixeira and authors 22 reported construction and analytical evaluation of graphite-epoxy ion-selective electrode in FIA for determination of Fe3+. Ion-selective membrane was based on ion-pair incorporated in PVC and limitation in useful lifetime was noticed (which is disadvantage of PVC based selective membrane). Furthermore, this method was characterized by complex construction (tubular electrodes, complex membrane composition and complicated electrode construction that included graphite-epoxy resin coated with PVC membrane). Measuring range and detection limit was similar in both mentioned methods to those obtained with method described in this paper.
3.2. Analytical applications
We studied the possibility of applying the FIA to the determination of iron in the soil sample (Figure 6) and results obtained are compared with results of tests of soil samples from the FAAS.
Earlier studies have shown that aluminum interferes with the strongest potentiometric determination of iron, so, FAAS used to determine the concentrations of Al and Fe in the sample. The result of analysis showed that the concentration of Al 10-3 M and Fe 10-5 M.
The implementation of the proposed method (FIA) in real samples showed good agreement of the results with those obtained when using FAAS for sample treated with HAc, while in the soil sample treated with HCl signal is greater than the gain of only Al and Fe only. Actually, obtained signal was summed signal of Fe and Al, suggesting the possibility of using the FIA for determining the controlled extraction of Fe.
[image:9.596.133.460.530.727.2]Similar observations was obtained in earlier investigation [22]
4. CONCLUSION
This work presents a novel procedure for the reliable determination of free Fe3+ in real samples between 10-5 to 10-1 M.
Investigation concerning peak height for Fe3+ in the presence of various cations revealed small influence of reported cations. However, significantly influence of anions was observed when concentrations of anions were extremely high (0.01 M). The described method was used for determination of the Fe3+ in real samples (soil). These results were significantly influenced by sample preparation method.
The results (in the real samples) obtained by proposed method, are in good agreement to those obtained by FAAS.
References
1. P. Ugo, L. M. Moretto, A. De Boni, P. Scopece, G.A. Mazzocchin, Anal. Chim. Acta, 474 (2002) 147
2. Ç. A. Şahin, I. Tokgöz, S. Bektaş, J. Hazard. Mater., 181 (2010) 359 3. D. A. Weeks, K. W. Bruland, Anal. Chim. Acta, 453 (2002) 21
4. V. K. Gupta, B. Sethi, N. Upadhyay, S. Kumar, R. Singh, L. P. Singh, Int. J. Electrochem. Sci., 6 (2011) 650
5. M. H. Mashhadizadeh, I. S. Shoaei, N. Monadi, Talanta, 64 (2004) 1048
6. C. J. Borman, B. P. Sullivan, C. M. Eggleston and P. J. S. Colberg, Sensor, 9 (2009) 4390 7. A. R. Fakhari, M. Alaghemand and M. Shamsipur, Anal. Lett., 34 (2001) 1097
8. M. Bralić, S. Brinić, E. Generalić, L. Vrsalović, Talanta, 63 (2004) 777 9. B. Sun, Y. Ye, H. Huang, Y. Bai, Talanta, 40 (1993) 891
10. R. De Marco, D.J. Mackey, Mar. Chem., 68 (2000) 283
11. M. B. Gholivand and F. Raheedayat, Electroanalysis, 16 (2004) 1330 12. M. B. Gholivand and F. Sharifpour, Talanta, 60 (2003) 707
13. P. L. Croot, P. Laan, Anal. Chim. Acta, 466 (2002) 261 14. M. Bralić and Nj. Radić, Analusis, 27 (1999) 57
15. M. Bralić, E. Generalić, S. Krka, Anal. Lett., 33 (2000) 1811
16. J. A. Boržitsky, A. V. Divini, O. M. Petrukhin, Y. I. Urusov, Analyst, 118 (1993) 859 17. W. Frenzel and P. Brätter, Anal. Chim. Acta, 187 (1986) 1
18. R. Bock and S. Strecker, Fresenius Z. Anal. Chem., 235 (1968) 322 19. P. Kauranen, Anal. Lett., 10 (1997) 451
20. N. Yamazoe, J. Hisamoto, N. Miura, Sensors and Actuators,12 (1987) 415 21. Z. Chen, P. Alexander, Electroanalysis, 9 (1997) 141
22. C. D. Stalikas, A. Ch. Pappas, M. I. Karayannis and P. G. Veltsistas, Microchim. Acta, 142 (2003) 43