Patient-Centric Cellular Networks Optimization
Using Big Data Analytics
MOHAMMED S. HADI , (Graduate Student Member, IEEE), AHMED Q. LAWEY, TAISIR E. H. EL-GORASHI, AND JAAFAR M. H. ELMIRGHANI, (Senior Member, IEEE) School of Electronic and Electrical Engineering, Institute of Communication and Power Networks, University of Leeds, Leeds LS2 9JT, U.K.
Corresponding author: Mohammed S. Hadi ([email protected])
This work was supported in part by the Engineering and Physical Sciences Research Council (EPSRC), in part by the INTERNET under Grant EP/H040536/1, and in part by the STAR Projects under Grant EP/K016873/1.
ABSTRACT Big data analytics is one of the state-of-the-art tools to optimize networks and transform them from merely being a blind tube that conveys data, into a cognitive, conscious, and self-optimizing entity that can intelligently adapt according to the needs of its users. This, in fact, can be regarded as one of the highest forthcoming priorities of future networks. In this paper, we propose a system for Out-Patient (OP) centric Long Term Evolution-Advanced (LTE-A) network optimization. Big data harvested from the OPs’ medical records, along with current readings from their body-connected medical IoT sensors are processed and analyzed to predict the likelihood of a life-threatening medical condition, for instance, an imminent stroke. This prediction is used to ensure that the OP is assigned an optimal LTE-A Physical Resource Blocks (PRBs) to transmit their critical data to their healthcare provider with minimal delay. To the best of our knowledge, this is the first time big data analytics are utilized to optimize a cellular network in an OP-conscious manner. The PRBs assignment is optimized using Mixed Integer Linear Programming (MILP) and a real-time heuristic. Two approaches are proposed, the Weighted Sum Rate Maximization (WSRMax) approach and the Proportional Fairness (PF) approach. The approaches increased the OPs’ average SINR by 26.6% and 40.5%, respectively. The WSRMax approach increased the system’s total SINR to a level higher than that of the PF approach, however, the PF approach reported higher SINRs for the OPs, better fairness and a lower margin of error.
INDEX TERMS LTE network optimization, big data analytics, cellular network design, patient-centric network optimization, MILP, naïve Bayesian classifier, resource allocation, OFDMA uplink optimization, resource management.
I. INTRODUCTION
RIOR to the emergence of big data, decisions were made relying on data samples. Consequently, the decisions were semi-optimum [1]. Those ill-informed decisions spanned over different areas from marketing to law enforcement, sports, and healthcare. With the proliferation of social media applications, Internet of Things (IoT) sensors, and Global Positioning System (GPS)-based services, people may now be considered as walking generators of data. The powerful capability of big data analytics in analyzing massive amounts
The associate editor coordinating the review of this manuscript and approving it for publication was Giovanni Angiulli.
of data and inferring knowledge from it [2] has brought about better predictions paving the way for better decisions.
daily routine, diet, allergies, and genetic information, etc. Such analyses can be time-consuming and require a certain level of expertise to be carried out by medical personnel [4]. An example mentioned in [5] reports the use of big data analytics by Columbia University Medical Centre to diagnose complications in patients with a bleeding stroke caused by a ruptured brain aneurysm. Based on physiological data, the diagnosis was reported 48 hours beforehand in patients with brain injuries, which gave the medical professionals a head start to address these complications.
In the healthcare sector, there are many sources of big data, for example; IoT medically-related sensors, smart watches, and smartphone medical applications. What the above-mentioned data generators have in common is their reliance on network connectivity. Maintaining this connectiv-ity and ensuring its qualconnectiv-ity is a dilemma that many researchers tried to solve optimally. Here, the patient’s big data can play a double role. In addition to diagnosis, it can guide the network operator to the patients who have the highest and most urgent needs, and thus direct their network resources towards these patients. We believe that ensuring high-quality connectivity between the patient-linked peripherals and their healthcare provider is an important step towards highly personalized e-healthcare services and applications.
A wireless connection is preferred over a wired one for what it has to offer in terms of mobility. Consequently, cellu-lar and Wi-Fi are the most popucellu-lar connectivity technologies. The level of freedom (mobility-wise) varies between wireless technologies, for example, Wi-Fi may provide an adequate data rate, nevertheless, it forces an Out-Patient (OP) that needs to keep his/her medical IoT sensor (e.g. IoT pacemaker) connected, to stay within a relatively small coverage area (i.e., indoors mainly). Utilizing the already-existing cellular networks can provide much-needed freedom to that OP. How-ever, due to path loss and fading, this approach faces several problems because there might be some blind-spots, deeply-faded locations, where the Signal to Interference plus Noise Ratio (SINR) level is so low that the connection is unreliable or cannot be established. In a slow fading channel, this could mean that the signal level may not be adequate at the instant(s) when critical information relating to the OP’s health has to be conveyedimmediatelyto the health care provider.
Big data is portrayed in [6] as a next-generation tool that can be used to find an optimal trade-off problem between resource sharing, allocation, and optimization in wireless net-works. Nevertheless, optimizing cellular networks in a user-centric style is still underexplored. In this paper, we introduce for the first time two OP-conscious approaches optimizing the uplink side of a multi-cell Orthogonal Frequency Divi-sion Multiple Access (OFDMA) network. In both models, the objective function prioritizes the OPs by maximizing their SINR received at the Base Station (BS) while keeping the goal of maximizing the network’s overall SINR.
The network that serves OPs can either be a dedicated network or a non-dedicated network. We chose to optimize a non-dedicated cellular network for a number of reasons.
Firstly, a non-dedicated can be deployed at a fraction of the cost of a dedicated network and such a network requires much lower commissioning time to be operational. Secondly, our approach can help provide the same level of service to other users while improving the OPs’ SINRs. Thirdly, using an established operational network can facilitate the adoption of our approach and the idea of providing such service can be appealing to operators and regulators as it is for the ben-efit of patients. Fourthly, a dedicated network can limit the mobility of the patients to within the network’s coverage, while using the proposed approach can provide nation-wide (if not more) freedom, especially if it was standardized and regulated.
The models comprise an assignment scheme powered by big data analytics where OPs are assigned Physical Resource Blocks (PRBs) with powers proportional to their current medical situation. Fairness was incorporated to minimize the negative impact of such assignment on other users. The models are subject to a number of power and PRB assignment constraints that govern its operation. The main contributions of this paper are: (i) the introduction of an interdisciplinary approach to optimize the uplink of a Long Term Evolution-Advanced (LTE-A) network while priori-tizing cellular-connected-OPs using big data analytics and MILP optimization to grant the OPs suitable PRBs according to their current health condition; (ii) the development of a mathematical method to determine the likelihood of a stroke by using a naïve Bayesian classifier and real patient big data sets.
The remainder of this paper is organized as follows. Section II discusses the related work. Section III presents the proposed system and the MILP formulation of the PRB assignment optimization problem. A real-time heuristic for PRBs assignment is presented in Section IV. Section V presents and discusses the results. The open research chal-lenges are highlighted in Section VI. Section VIII concludes the paper.
II. RELATED WORK
Due to the nature of our proposed system, there are funda-mentally two parts that need to be investigated in this section. The first part is concerned with the use of big data analytics for resource allocation and optimization in a cellular network. The second part focuses on the use of big data analytics to support the healthcare sector. This section concludes with a third part illustrating the link that we are proposing between the former two parts to forge a cellular network optimized to serve outpatients by reacting according to their needs.
A. USING BIG DATA ANALYTICS FOR CELLULAR NETWORKS RESOURCE ALLOCATION
The topic of utilizing big data analytics in network design was thoroughly discussed in our survey paper. We observed that the highest number of papers in this area are in the wireless field [2]. Significant effort is dedicated currently to endow-ing wireless cellular networks with the ability to seamlessly
prioritizeusers and serve them accordingly. Previous work in this area includes the work of the authors in [6] who proposed the use of configuration, alarm, and log files and processing the mentioned data using a big data processing environment, thus identifying the behavior of both the user and the net-work. The goal is to solve the problem of radio resource allocation to users in the Radio Access Network (RAN) in a manner that ensures minimal delay between resource request and assignment. Another idea was presented by the authors of [7] to manage the network resources in Heterogeneous Net-works (HetNets). This was achieved through the utilization of sentimental and behavioral analysis of data collected from social networks, along with communication network data. The latter was exploited to predict sudden increases in the usage of the mobile network. The aim was to achieve minimal service disruption by servicing the right place at the right time.
B. USING BIG DATA ANALYTICS IN HEALTHCARE
Several approaches have attempted to address the riddle of employing big data analytics to accomplish the task of OP monitoring. A system that has a real-time response when an emergency case arises was proposed by the authors in [8]. The system is capable of processing data collected from millions of Wireless Body Area Network (WBAN) sensors. The authors of [9] investigated the challenges associated with designing and implementing big data services that utilize data harvested from medical sensors as well as other IoT appli-cations. They also considered the requirement of processing this data in real-time. Another approach to help patients with Parkinson’s disease was proposed by the authors of [10]. The system monitors the loss of flexibility as it is a sign of disease progression. This is done by analyzing big data collected from the body and 3D sensors, such as the Microsoft Kinect sensor system. The disease development and treatment effectiveness can both be observed by the patients as well as their healthcare providers in real-time. A survey conducted by the authors in [11] showed different approaches to detect heart disease at an early stage. The common theme among those approaches is that they are all based on data mining, machine learning, and big data analytics techniques.
C. MISSING PIECE OF THE JIGSAW
All the approaches mentioned in the previous subsection assumed networks with ideal connectivity. However, in a real-world scenario, opposing elements like channel fading and noise need to be taken into consideration. Our approach exploits big data analytics for the purpose of optimizing the Radio Access Network (RAN) side of an LTE-A network to serve a specific category of people, in this case, the OPs. Our approach ensures service availability to OPs, especially at times when they are in desperate need for it. We argue that by analyzing the OPs’ big data we can predict the ones that are at high risk of having a stroke. Consequently, OPs will be prioritized over normal users and the network’s attention (in terms of the quality of the assigned resources) can be shifted
towards them. In the US, about 795 thousand people suffer a stroke annually [12]. This is equivalent to 1.5 stroke incidents per minute on average which is significant and frequent. In England, Northern Ireland and Wales, a third of stroke patients went to the hospital during 2016-2017 not knowing what time their symptoms commenced [13]. The problem is serious given an average time from the start of the symp-toms till admission to a hospital of 7.5 hours, with another 55 minutes door-to-needle time (duration between arrival at the emergency department and administering an anesthetic) and the fact that a stroke patient is losing 1.9 million neurons each minute before treatment commence [13]. The use of our proposed system can have a tremendous impact on minimiz-ing this time since patients are prioritized and given reliable resource. Moreover, the increase in the SINR will result in an increase in the spectral efficiency hence fewer resources are required to transmit the same amount of data [14]. The proposed system can also help in providing reliable connec-tivity to medical IoT devices when transmitting the patient’s vital signs to the healthcare provider. In addition, it can help with early detection of symptoms and facilitate early emergency admittance to the hospital to help save patients’ lives. If other forms of ill health are included, the proposed system will be called upon even more frequently. It should be noted that the delay component from the collection of outpatient’s current state till the processing of data in the cloud is negligible in comparison to the 7.5 hours and 55 min-utes figures quoted earlier, hence, it is not considered in this paper.
In terms of the need to respond fast to the channel vari-ation and the changes in patients’ needs, we would like to note that the MILP is used only to establish the optimal solution, while the simple heuristic is used to provide the fast response needed (at the cost of sub-optimal, but good performance).
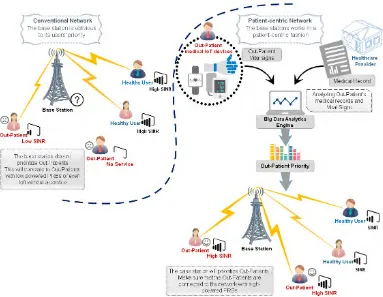
FIGURE 1. Patient-centric cellular network.
a MILP-based optimization framework to study the optimal performance of the uplink side in HetNets. Several admission control policies for uplink WiMAX networks were proposed by the authors in [24]. The authors employed MILP and heuristic for that purpose.
At the patient’s end, the authors in [25] emphasized that home-measured blood pressure has stronger predictive power than conventional blood pressure measurements. Addition-ally, the authors concluded that while there is no specific threshold (within the range of 1-14) for the number of mea-surements, they suggested as many as 14 or more measure-ments per day can enhance the prediction of a stroke. Taking the worst case scenario by doubling this number (i.e., 28 surements/day), the proposed system still only performs mea-surements and predictions every 50 minutes which is more than sufficient.
Lastly, we would like to draw attention to the fact that what we have integrated with our proposed approach the ability to access OP’s vital signs, classify their medical state, and optimize the network in light of this state while taking into consideration other (healthy) users
III. OP-CENTRIC NETWORK OPTIMIZATION MODEL
In this section, we present the system model, then we describe the problem formulation. For that purpose, a set of mathe-matical programming formulations adopted throughout this paper is presented.
A. SYSTEM MODEL
We consider an urban environment covered by an LTE-A cellular network. The area is populated with a number of users scattered at random distances from the BSs (between 300 and 600 meters). The users fall into two categories; normal (healthy) users and OPs as shown in Fig.1. As we previously indicated, cellular networks can provide an opti-mal way for OPs to have a connection. Since OPs are randomly-located, different power levels (signal strengths) will be received from their mobile devices. We are assum-ing a system with a slow fadassum-ing channel where the channel gain remains constant within one transmission time interval (TTI). Thus, the coherence time is assumed to be greater than the duration of a TTI. OPs with a higher likelihood of stroke must transmit their data as soon as possible. How-ever, if the OP was assigned a channel with a low SINR, the required medical response may not arrive in time. The goal is to prioritize OPs over normal users in terms of resource allocation.
The OP data is analyzed in a cloud-located big data ana-lytics engine running a naïve Bayesian classifier, one of big data analytics algorithms [26]. This engine is used to predict the stroke likelihood for an OP. Based on this likelihood, the OPs are assigned proportional weights (i.e. priorities) to grant them PRBs with an optimal SINR favoring them over normal (i.e., healthy) users. To this end, the objective function of our optimization model guarantees the allocation of high
gain PRBs to OPs, aiming at maximizing the total SINR received at the base station and preserves fairness among users to ensure such a resource allocation scheme will not negatively impact other users. We note that the terms ‘healthy user’ and ‘normal user’ are used interchangeably throughout this paper.
B. NAÏVE BAYESIAN CLASSIFIER
[image:5.576.299.537.87.238.2]We used the naïve Bayesian classifier to determine the likeli-hood of occurrence of a certain incidentc(e.g., a stroke) rely-ing on a given set of independent feature variablesfiobtained from the OPs’ big data (i.e. medical records). Given, acurrent stateof a certain OP, the classifier can use the training dataset (medical record) to determine the likelihood that this OP would suffer a stroke and quantify it as a risk factor. These feature variables represent the vital readings (e.g., Systolic and Diastolic blood pressure, total cholesterol, and smoking rate) that can be collected by body-attached IoT sensors and fed to the big data analytics engine where the naïve Bayesian classifier resides. It is worth noting that this classifier is termednaïvedue to the assumption that the feature variables are conditionally independent [27]. In this work, the Naïve Bayesian classifier is preferred over other classifiers due to the following reasons; (i) The classifier’s linearity [28] facilitates its direct joint use with the MILP while keeping the model’s complexity low. Employing nonlinear classifiers imposes the use of additional linearization procedures hence the model’s complexity increases. This ultimately impedes further the system’s development. Non-linear algorithms (e.g. artificial neural networks) can be computationally intensive by nature. Additionally, this can slow future model develop-ments and scalable expansions; (ii) In a comprehensive study in [29], the authors stated that it is complicated to select a single tool for all types of disease analysis and they chose the naïve Bayesian classifier for heart disease problems. (iii) According to [30], the naïve Bayesian classifier was used for cardiovascular disease risk discovery and it was validated by a number of cardiologists where more than 80% of the respon-dents agreed with the classifier’s accuracy. (iv) Its confirmed competitiveness when compared to other algorithms includ-ing neural networks and decision trees [27]; (v) The naïve Bayesian classifier requires a small training dataset [31]; (vi) It was the choice of many other researchers in cardio-vascular disease risk prediction as in [31]–[38]; (vii) In the field of e-healthcare and disease risk prediction, the Naïve Bayesian classifier proved to be one of the optimal (and sometimes the optimal) for such task, its accuracy surpassed Decision Trees, K-Nearest Neighbor and Neural Networks as discussed in [39]. The classifier gave higher accuracy when compared with Decision Trees in [40]. An intelligent Heart Disease Prediction System was proposed in [41], the authors compared naïve Bayesian classifier, Neural Networks, and Decision Trees. The naïve Bayesian classifier proved to be the most effective as it had the highest percentage of correct predictions.
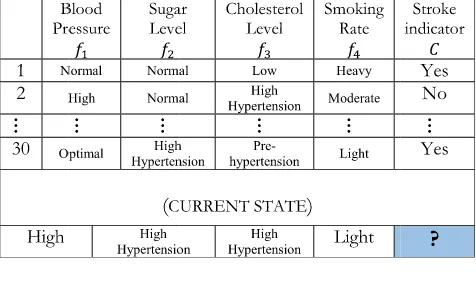
TABLE 1.Outpatient medical record (sample).
ThelikelihoodofFgivenCis given as
p(Fi =fi|C=c)= Pn
i=1 C =c
V Fi=fi
Pn
i=1(Ci=Ci)
(1)
The naïve Bayesian classifier’sposterior probabilitycan be expressed as shown in equation (2).
p(C =c|Fi=fi)=P(C =c) n Y
i=1
P(Fi=fi|C =c) (2)
whereP(C=c)representsthe prior probability of stroke, in other words, it is the number of days in which a stroke occurred over the total number of days (i.e. observation period). While5ni=1P(Fi = fi|C = c) represents thejoint probability.
A dataset comprised of five columns is depicted in Table 1. The monitored body readings are stored in four columns represented by the feature variables f1. . .f4 reflecting the recorded state of each feature, whereas the fifth column rep-resents the class variableCthat registers whether a stroke (or a critical state) occurred in the corresponding day. The total number of rows represents the observation period for each OP and in this work, it is 30 which stands for 30 days. The total number of medical records is equivalent to the number of OPs, which in this manuscript is three OPs. It should be noted that since the dataset is text-based with no multimedia components, its size is measured in kilobytes of data and this is harmonious with other datasets as in [42].
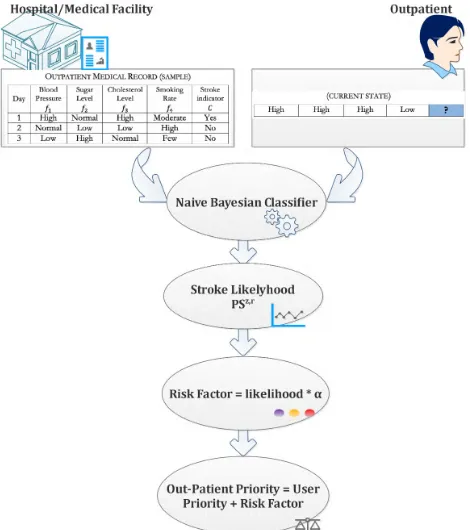
The role of the naïve Bayesian classifier is illustrated in Fig. 2. The classifier reads the OP’smedical record(check table 1) and uses the OP’s current state (the lower part in Table 1) to predict the likelihood of an upcoming stroke. This likelihood is to be converted later (in the upcoming sub-section) into a risk factor used to calculate the weight given to each OP to be prioritized among other users during PRB assignment which is implemented in this work using a MILP and a heuristic, as explained in the subsequent subsection C. We also note that the terms ‘‘user weight’’ and ‘‘user priority’’ are used interchangeably throughout this paper.
FIGURE 2. Naïve bayesian classifier role / user weight calculation procedure.
an extended period of time. The available datasets either reported statistics or were acquired through a collaboration with a medical institute that provided them with such datasets. Unfortunately, such datasets were not publicly accessible as in [30]. Thus, instead of generating a random dataset and risk having non-medically-compliant readings, we are fortunate in that the Framingham heart study in [43] has a big dataset that covers the features we needed. We populated our dataset by segmenting rows from the Framingham dataset and assign each segment to an OP. Thus, the resulting dataset repre-sents an observational period of 30 readings for each OP. It is worth noting that the Framingham cardiovascular cohort study started in 1948, and targeted adults residing in the town of Framingham, Massachusetts. The study is ongoing, and a new phase has started in 2002 with the enrollment of the third generation of participants [44]. The above–mentioned OP data has the characteristics of big data; hence, big data analytics algorithms can be used to predict the likelihood of occurrence of a certain incident (i.e. a stroke in our case).
It should be noted that data reduction, data cleansing, and data generalization are the data preparation steps that the Framingham study had to carry out before applying the Naïve Bayesian classifier. Data preparation (or data preprocessing) is a vital stage to prepare the dataset before the use of big data analytics/Machine Learning algorithms [45], [46]. Moreover, having the dataset ready is a one-time process (i.e. before running the analysis [47]) as the rest of the procedure is for the naïve Bayesian to read the current state and to run its classification procedure against the outpatient’s medical
record (i.e. dataset) which is not time-consuming as we stated earlier. A similar process is done in relation to new incoming data from the outpatient. This data is labeled ‘‘current state’’ in Table 1, which is only one row of data per user. Thus, the preparation time is negligible. As for adding the newly acquired readings to the dataset, those readings are added periodically:
1) DATA REDUCTION
In this process, particular features are retained while others are excluded. There are three reasons for this; firstly, reducing the number of features has a direct effect on the dataset dimensions, thus, reducing the processor and memory utiliza-tion while improving the classifier’s accuracy [48]. This can be a crucial element in reducing the MILP’s execution time. Secondly, in this work, we are targeting the main stroke con-tributors. Thus, according to [49], [50], Hyperlipidemia (i.e. Total Cholesterol), blood pressure, and smoking are among the main contributors to a stroke. Thirdly, since each OP has a dataset comprised of their own readings, the inclusion of other fixed and very slowly-changing feature variables like weight, gender, age, and body mass index (BMI) is unre-alistic. Hence, the selected features in this paper. However, the impact of feature selection/ranking is to be investigated as a future extension to this work as highlighted in Section IV.
2) DATA CLEANSING
Incomplete, erroneous, and inconsistent entries were omitted. Thus, the resulting dataset is error-free and have a complete set of values across all entries.
3) DATA GENERALIZATION
The discretization of data converts large numbers of contin-uous feature values into smaller ones. The purpose is to find concise data representations as categories [51]. The authors of [52] and [53] showed that the naïve Bayesian models’ accuracy can be positively impacted by discretization. More-over, it is considered a data reduction mechanism because it reduces data from a large domain of numeric values to a subset of values that fall in categories [54].
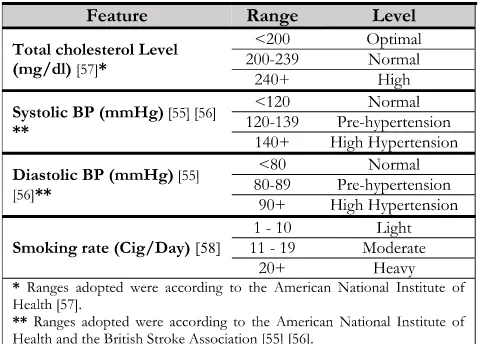
Given the medical nature of the application and to stay in line with the medically-accredited ranges in the data discretization stage, the ranges defined by the American National Institute of Health and the British Stroke Associ-ation in [55], [56] and [57] were adopted for the Systolic and Diastolic blood pressure values and total Cholesterol, respectively. As for the smoking rate, we categorized it into the levels: light, moderate, and heavy, respectively as in [58]. Consequently, the continuous values of the Framingham dataset were categorized as observed in Table 1 and according to their medically-accredited ranges shown in Table. 2.
It should be noted that upon further examination we found that data can be discretized according to the European stan-dards. However, investigating this is beyond the scope of this paper.
TABLE 2. Feature values and their corresponding level.
4) CALCULATING THE OP’S PRIORITY USING MILP-COMPLIANT NAÏVE BAYESIAN FORMULATION
We developed the following formulations to include the naïve Bayesian classifier within the MILP model, where it calcu-lates the likelihood PSz of a stoke given a certain current state CSi. The model then transforms this likelihood into an updateduser priority (weight) UPkindicated in equation (7). Rewriting equation (1) in a mathematical programming formulation gives:
CPci,,vz=PFi=VFj,iz|Ci=V
r,z Ci
=
|D|
X
d=1
X
F X
C
SFj,r,d,z
iCi
GrC,d,z
i
∀i∈J,c∈C,z∈Z (3)
where equation (3) is used to calculate the conditional prob-abilityP(Fi|Ci)in the MILP model. The nominator repre-sents the total number of days where the outpatient z has a certain reading VFj,z
i that we want to test, and a stroke (indicated by VC1,z
1) where C1 depicts the class stroke and
r = 1 registers the stroke occurrence. The denominator represents the total number of stroke days.
SFj,r,d,z
iCi ≥0
∀z∈Z, i∈J, d ∈D (4)
SFj,r,d,z
iCi =E
j,d,z
Fi +G
r,d,z
Ci
−1
∀z∈Z, i∈I, d ∈D (5)
Equations (4) and (5) achieve a logical AND operation in which the binary variableSFj,r,d,z
iCi =1 when both binary vari-ablesEFj,d,z
i andG
r,d,z
Ci are equal to 1. This variable indicates that outpatient zwith thejth value of featureFi has therth value of classCiin dayd.
Rewriting equation (2) gives:
PSz,r=
|D|
X
d=1
GrC,d,z
i
|D|
I Y
i=1
PFi=VFCSi i,z|Ci=V
CSi,z
Ci
(6)
∀z∈Z
Equation (6) represents the formulation we used to deter-mine the probability of stroke PSz,r. Given acurrent state CSi, all feature variablesFiare considered. This meansihas the rangei≤ |I|(in this worki=1, ..,4). The L.H.S. repre-sents the posterior probability that outpatientzhas a stroke. The first term on the R.H.S. represents the prior probability of stroke and the second term on the R.H.S. represents the joint probability that patientzhas the given values of the features. The multiplication of the two terms on the R.H.S. shows the naïve nature of the Naïve Bayesian estimate in this case where the features are assumed independent.
UPk =1+α·PSz,r
∀k∈K:z=k, kNU (7)
The user weightUPkis calculated as shown in equation (7). Since the naïve Bayesian classifier produces probabilities of small magnitude, we multiplied the overall probability of stroke (PSz,r) by a tuning factorαto produce an effective-yet-reasonable weight, which drives the objective function into favoring the imperiled outpatients.
C. PROBLEM FORMULATION
Using our track record in MILP optimization and heuristics formulation in [59]–[67], and physical layer modeling track record in [68]–[73], we developed the following MILP mod-els to optimize the cellular system resource allocation for OPs and normal users. We consider the OPs monitoring system to operate in a scenario of an LTE-A network comprisingB
base stations represented by setB= {1, . . . ,B}, operating at channels with 1.4 MHz bandwidth. Each base stationb has
N PRBs represented by setN = {1, . . . ,N}. The network servesK users (normal and OPs) represented by setK = {1, . . . ,K} by allocating PRB n to connect to BS b in an instant in time. The goal is to optimize the uplink of the LTE-A network, so that the OPs are prioritized over normal users; thus, allocating them high-powered PRBs.
We formalize this problem as a MILP model. Table 3 defines the sets, parameters, and variables used in the network optimization problem formulation.
A user’s SINR at the uplink side of an OFDMA network can be expressed as [22].
Tkb,n= Signal
Interference+Noise =
Qbk,nXkb,n
Qb
m,nXmw,n+σkb,n (8)
TABLE 3. System sets, parameters, and variables.
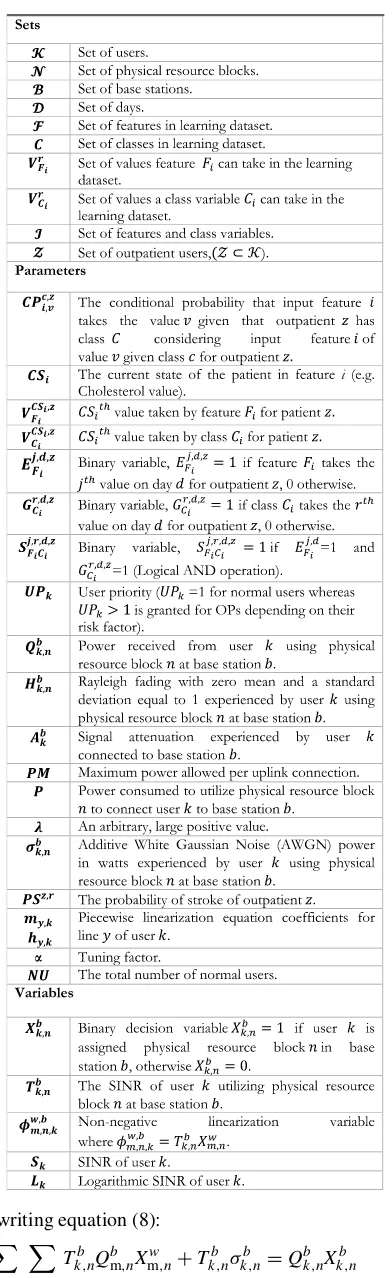
Rewriting equation (8):
X
w∈B
w6=b X
m∈K
m6=k
Tkb,nQbm,nXmw,n+Tkb,nσkb,n=Qkb,nXkb,n (9)
[image:8.576.59.255.75.714.2]∀k∈K, n∈N, b∈B
FIGURE 3. User interference.
The first term in (9) is nonlinear (quadratic) as it involves the multiplication of two variables (Continuous Tkb,n and BinaryXmw,n). Therefore, linearization is essential to solve the NP-hard model using a linear solver such as CPLEX, where the linearization is given in (12) to (15).
We have developed two approaches to solve the resource allocation problem. The first approach uses an objective func-tion that maximizes the Weighted Sum-Rate of the SINRs experienced by the users. The second approach introduces fairness among the users by employing a Proportionally Fair (PF) objective function.
1) MILP FORMULATION FOR THE WSRMAX APPROACH
The objective is to maximize the system’s overall SINR. This can be realized through the maximization of the individual users’ SINRs.
a: BEFORE PRIORITIZING THE OPs
The OPs’ risk factors introduced in the previous section are scaled into priorities (i.e. weights) and used to prioritize the OPs over other users. The MILP model is formulated as follows:
Objective:Maximize X
k∈K
X
n∈N
X
b∈B
Tkb,nUPk (10)
The objective given in (10) aims to maximize the weighted sum of the users’ SINRs. These weights (i.e. priorities) are higher for OPs compared to healthy users and proportional to the OPs calculated risk factor. Note thatUWk has an initial value of 1 for all users as shown in (11). However, the OPs will have updated values according to their risk factor. This will ultimately drive the system into prioritizing the OPs over the healthy users during PRB assignment. The mathematical formulations related to the OP weight (priority) calculation was illustrated in subsection B.1.
All users have equal priorities (i.e. weights) at this stage as shown in (11).
UPk =1
∀k∈K (11)
Constraints:To maintain the model’s linearity while per-forming the multiplication of the float variable Tkb,n by the binary variable Xmw,n, we follow [74], and define a vari-able φmw,,bn,k that includes all the indexes of both aforemen-tioned (i.e., float and binary) variables as in equation (12). Constraints (13), (14), and (15) govern the multiplication procedure. As a result, the only two values satisfying the constraints are either zero (when x = 0) or T (when x=
1). It should be noted that λ is a large enough number whereλ>>T:
Subject to:
φw,b
m,n,k ≥0 (12)
Replacing the quadratic termTkb,nXmw,nwith the lineariza-tion variable φwm,,bn,k that incorporates all the indexes of the multiplied variables.
φw,b m,n,k ≤λX
w
m,n (13)
∀k, m∈K, n∈N,w, b∈B, (m6=k,b6=w)
φw,b m,n,k ≤T
b
k,n (14)
∀k, m∈K, n∈N,w, b∈B, (m6=k,b6=w)
φw,b m,n,k ≥λX
w m,n+T
b
k,n−λ (15)
∀k, m∈K, n∈N,w,b∈B, (m6=k,b6=w)
After replacingTkb,nXmw,nwithφwm,,bn,k, equation (9) can thus be rewritten as in (16).φmw,,bn,k =Tkb,nXmw,nis equal to the SINR of userk connected to base stationbwith physical resource blocknif there is an interfering usermconnected to the other base stationwwith the same physical resource blockn; it is zero otherwise.
X
w∈B
w6=b X
m∈K
m6=k
Qbm,nφmw,,bn,k+Tkb,nσkb,n=Qkb,nXkb,n (16)
∀k∈K,n∈N,b∈B X
n∈N
PXkb,n≤PM (17)
∀k∈K,b∈B
Constraint (17) ensures that the users do not exceed their maximum available amount of power per uplink connections (in case more than one PRB is utilized by the same userk). In the current work, the user is allowed a single PRB.
X
k∈K
Xkb,n≤1
∀n∈N, b∈B (18)
Constraint (18) limits the assignment of each PRB to one user only.
X
b∈B
X
n∈N
Xkb,n≥1
∀k∈K (19)
Constraint (19) guarantees that each user is assigned at least one PRB from any BS. Thus, no user is left without service. Additionally, this prevents the MILP from blocking interfering users to maximize the total SINR.
b: AFTER PRIORITIZING THE OPs
In this approach, OPs’ risk factors introduced in the previous section are scaled into weights to prioritize the OPs over other users. The MILP model is formulated in the same way as mentioned in the previous subsection. However, equation (7) is included in this model to represent the OPs’ weights (i.e. priorities) while (11) is replaced by (20) to cover the normal users only.
UPk =1
∀k∈K:1≤k≤NU (20)
2) MILP FORMULATION FOR THE PF APPROACH
In this approach, the objective is to maximize the logarithmic sum of the user’s SINRs. Due to the nature of the natural logarithm, a slight decrease in the overall SINR might be observed but to the expense of preserving fairness among normal users.
a: BEFORE PRIORITIZING THE OPs
In this case, all users are treated equally, thus there is no prioritization in terms of resource allocation. However, keep-ing fairness among users still holds as a necessity. Since the only part that we are dealing with is the value of the indi-vidual user’s SINR, and to simplify the manipulation of the equation before adding the natural logarithm part, we present the optimization variableSk, to serve as the SINR for each userk.
Sk = X
n∈N
X
b∈B Tkb,n
∀k∈K (21)
Equation (21) replaces the three-indexed variableTkb,nwith a single-indexed variableSk.
Lk =lnSk
∀k∈K (22)
Equation (22) calculatesLk as a logarithmic function of the user’s SINRSk. Since the natural log is a concave func-tion, and to preserve the linearity of our model, piecewise linearization was used as depicted in constraint (24).
The objective is as shown in (23):
X
k∈K
Lk (23)
Constraints:
In addition to constraints (12)-(19) from the previous model, the PF satisfies the following constraint
Subject to:
Lk ≤my,k∗Sk+hy,k
∀k∈K (24)
Constraint (24) represents a set of piecewise linearization relations implemented to linearize the concave function in equation (22). Note that constraint (24) corresponds to the line equation y = mx +h where the line coefficients (i.e.
my,k andhy,k) are selected as in [75]. It should be noted that the number of constraints used in the linearization procedure is dictated by the total number of lines used to cover the linearized interval.
b: AFTER PRIORITIZING THE OPs
In this case, the outpatients are prioritized. Equation (22) is rewritten to reflect the change.
Lk =lnSk
∀k∈K:1≤k≤NU (25)
Equation (25) shows that the log function is applied to normal users only. The OPs, on the other hand, are assigned weights instead.
Objective:Maximize X
k∈K,1≤k≤NU Lk+
X
k∈K,kNU
SkUPk (26)
The multi-objective function in (26) (i) maximizes the sum of the SINRs allocated to all users, (ii) Assigns OPs priority by allocating OPs PRBs with high SINRs that reflect their relative priority, and (iii) Implements Fairness: by assigning healthy users PRBs with comparable SINRs. These objectives were implemented by adding both the summation of a log function of the healthy users’ SINRs (i.e. Proportional Fair-ness) and the weighted sum of the OPs’ SINRs (OPs priority).
Constraints:
The model satisfies constraint (12)-(19) from the previous approach. In addition to equation (20) and:
Lk ≤my,k∗Sk+hy,k
∀k∈K,k≤NU (27)
Constraint (27) represents the same set of equations for the piecewise linearization that was used in constraint (24), how-ever, the difference is in the range of users it is applied to.
3) CALCULATING THE RECEIVED POWER
The received signal power (in Watts)Qbk,nvaries according to the channel conditions and the distance between the user and the BS. Considering Rayleigh fading denoted byHkb,nand
distance dependent path loss denoted byAbk,n, the received signal power is given as:
Qbk,n=PHkb,nAbk (28)
whereHkb,ndenotes Rayleigh fading andAbkrepresents power loss due to attenuation (distance dependent path loss) and is given by [23]:
A(dBm)=128+37.6 log10 distance(meters)
1000 (29)
To unify the units, equation (30) is used to convert the power to Watts.
A(mw)=10A(dBm)10 (30)
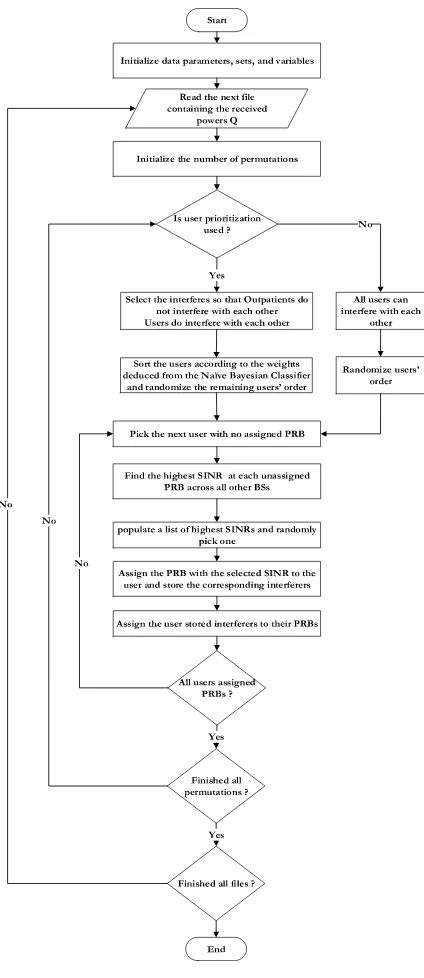
IV. HEURISTIC
To provide a method to validate the MILP operation and to deliver a real time solution, a heuristic approach was devel-oped to optimize the PRBs assignment based on the user’s priority. The heuristic, as shown in the flowchart in Fig. 4, starts by initializing the data parameters, sets, variables and reads the received power (Q) values from a separate file. A check for user prioritization takes place. This affects the users’ admittance order to the system. If user prioritization is ON (i.e. big data analytics are used), the OPs will be arranged according to their priority such that the most crit-ical OP will be served first. This kind of check is vital at this stage due to the sequential nature of the heuristic, thus, the first few users will be granted high SINRs due to the higher number of available channels. OPs do not compete with each other over the available PRBs, i.e. their interfering candidates are normal users only. Finding the PRB at which a user achieves a relatively-high SINR is done by assigning a PRB where interference is attributed to a subset of|B| −1 interferers with minimum interfering power to that user at its PRB, where |B| is the number of BSs (the cardinality ofB). As the heuristic continues to run, the PRB availability is reduced. Once the PRBs are allocated to the OPs, the total number of allocated PRBs will equal to (2∗ Z). On the other hand, the number of free PRBs (FPRB) will be equal to [B∗N]−[2∗Z] giving a total of 2FPRB combinations. Finding an interfering user with the minimum power on each RB (i.e. maximum SINR) results in reducing the above number of combinations. Accordingly, a pool with the length
|FPRB| comprised of the highest achievable SINR on each PRB will be formed. The heuristic follows a semi-greedy approach [76]. Thus, one SINR will be randomly selected from the pool of best SINRs. The reasons behind this selec-tion criterion are (i) to establish local fairness between the user and its interferer so that the interferer does not endure a huge impact by being assigned a very low-powered PRB; moreover, (ii) to conform to the objective function in which each individual user’s SINR is maximized while maximizing the overall system-wide SINR. Once the user is assigned a SINR, the corresponding PRB(s) is assigned to the user and the interferer. The heuristic repeats the above procedure
FIGURE 4. The heuristic flowchart.
for the remaining users. Due to its sequential nature, this heuristic was iterated 1000 times, randomizing the users’ admission order (serving sequence) to the system in each iteration, while maintaining the semi-deterministic nature of the interferer’s PRB assignment stage. The users’ average SINRs are then calculated. Thus, applying this heuristic over different realizations of the network instates fairness among users in the long run. Sensitivity analysis was carried out to calculate the 95% confidence interval. To that end, the heuristic was applied to over 100 files each containing dif-ferent values representing the powers received from the BS. Concurring results between the heuristic and the MILP model
operation can be observed, as will be shown in the results section.
It is of interest to compare the performance of the MILP which leads to the optimal solution with the performance of the heuristic which is sequential in nature. In our optimization model, the objective is to maximize the overall system’s SINR by maximizing the SINRs of all individual userswhile prior-itizing outpatient users over the healthy ones. This proceeds by allocating to user-A PRB-X at BS-1 which has a relatively high received power among the unassigned PRBs on that BS
whilechoosing an unassigned interfering user-B to utilize the same PRB-X where the received power on BS-1 is one of the lowest. Such a scheme will be approached differently by the MILP and the heuristic as their method of operation differs in the following manner:
Given a certain objective and a number of constraints, the MILP produces afeasible region bounded by the con-straints defined in the optimization problem. All points within that region cansatisfy the objective. However, only
one point typically represents the optimal solution. The MILP tries all the points at the boundary of the fea-sible region for all the posfea-sible user-interferer combina-tions and chooses the optimal result which best satisfies the objective (i.e. either attaining the maximum or the minimum).
The heuristic, on the other hand, works on a sequential basis. In our case, it admits and examines the users and the interferers one by one (i.e., sequentially). The user admitted first will have the advantage of being able to select from a wide range of resource blocks that correspond to differ-ent potdiffer-ential interferers. This range decreases as PRBs are assigned to the users one by one. Therefore, first-served users have the highest SINRs. To assert fairness between users, we have randomized the user admission order to the system in each iteration and this fairness is demonstrated when com-paring the heuristic and the MILP results in figures 5, 6, 8, 9, 10, and 12.
V. RESULTS AND DISCUSSION
Before delving into the results of the MILP model and heuris-tic, the parameters indicated in Table 4 should be noted. We consider a cellular network that operates in an urban environment, hence Rayleigh fading channel model with path loss. The results evaluate two scenarios; the first represents the state of the network before using big data analytics to prioritize the OPs. In this case, all the users were given equal base priority (i.e. weight) of 1. The second scenario represents the network state after using big data analytics where the OPs’ priorities are updated according to their risk factor and the value of the tuning factorα.
TABLE 4. Model parameters.
Additionally, the proposed system considers a system that is in operation. Here the dataset and the trained model are operational and the OP current reading is utilized by the naïve Bayesian classifier with the dataset to evaluate their current medical condition. Moreover, we would like to highlight that the classifier’s role in this work is to calculate the probabil-ityof stroke. Since the outpatients are all under continuous monitoring, they are favored according to their probability of stroke as long as the system is operational. The OPs’ stroke likelihoodPSz,r were 0.0032, 0.0064, and 0.00208 for users 8, 9, and 10, respectively.
We have employed the tenfold cross-validation method. The classifier’s accuracy and precision were calculated for all outpatients’ datasets. The classifier scored an accuracy of 60%, 63.3%, and 63.3% and precision of 65.2%, 66% and 71.6% for users 8, 9 and 10 (i.e., OP 1, 2, and 3), respectively. Future work will exten-sively investigate refining the classifier’s accuracy and precision. The use of equation (7) produced 1.104 ≤ UPk ≤ 1.32,1.208≤UPk ≤ 1.64,1.312≤UPk ≤ 1.96m,1.52≤UPk ≤ 2.6,2.04≤UPk ≤ 4.2 user priorities according to tuning factor values ofαof 50, 100, 150, 250 and 500, respectively.
A. THE WSRMAX APPROACH
1) BEFORE PRIORITIZING THE OPS
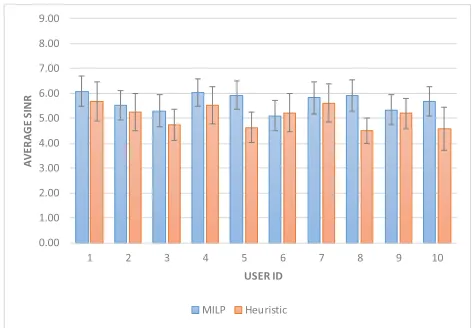
In this scenario, big data analytics is not employed to priori-tize the OPs, i.e., all users have equal weights equivalent to the
[image:12.576.38.278.85.304.2]base user weight(i.e. 1). Observing Fig. 5, it can be seen that the OPs (represented by users 8, 9, and 10, in both the MILP and heuristic results) are assigned PRBs with near average SINR as the MILP and heuristic strive to maximize the overall SINR.
FIGURE 5. Users’ SINR before using big data analytics (WSRMax approach).
Analogous SINR values can be observed in Fig. 5 for both the MILP and the heuristic. The average SINRs computed through the heuristic and the MILP approaches are compara-ble at around 5.4 and 5.5, respectively.
As a measure of fairness, i.e. to quantify how close the SINR values are to the mean, we considered accentuating the Standard Deviation (SD) for the users’ SINRs. The results are 0.4 and 0.3 for the heuristic and the MILP, respectively. Thus, the results confirm that the heuristic can approach the MILP and provide an acceptable level of fairness among the users by implementing the described permutation over independent realizations of the channel, at the expense of slightly sacrificing the overall SINR. An extensive sensitivity analysis was carried out, and 95% confidence intervals for each user’s SINRs are depicted in Fig. 5. The average SINR lied between 5.1 and 6 for the MILP results, and between 4.5 and 5.7 for the heuristic results.
2) AFTER PRIORITIZING THE OPs
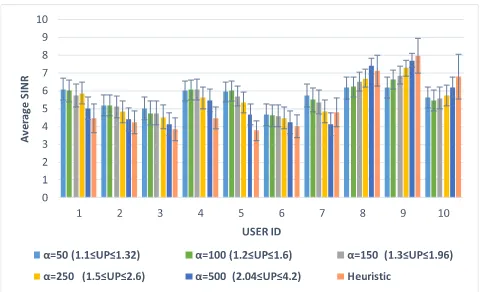
In this scenario, the use of big data analytics resulted in assigning OPs higher priority than normal users by means of the naïve Bayesian classifier. The results shown in Fig. 6 clearly demonstrate that all the OPs (users 8, 9, and 10) were assigned PRBs with high SINRs compared to their previous SINRs in Fig. 5. The system-wide performance is a trade-off (optimally selected) between the task of assigning higher SINRS to OPs versus a reduction in the average SINR in this scenario (between 0.3% (α = 50) and 6% (α =
500)) compared to the average SINR in the first scenario. This reduction in the average SINR is due to the fact that the system was forced to choose a PRB assignment scheme that prioritizes the maximization of OPs’ individual SINRs over the total SINR. The results also show that the heuristic approaches the MILP performance, with a very comparable SINRs, however, the heuristic mostly displayed a marginally higher OP SINRs. This is due to the sequential nature of the heuristic which forced the system to serve the OPs first after further arranging them according to their priorities. This chal-lenge was mitigated by preparing a list of highest achievable
FIGURE 6. Users’ SINR after user prioritization (WSRMax approach).
SINRs and randomly selecting one. The selection criterion of the user and its interferer was conducted on a sequential and a semi-deterministic manner, respectively to instate fairness between users as illustrated in Section IV.
The results in Fig. 6 depict an agreement in terms of the average SINR between the heuristic (5.1) and the MILP (ranged from 5.3 to 5.6 depending on the value of α). This approach slightly impacted the fairness between normal users as will be shown in the upcoming subsection. In this approach, the impact of converting the probability of stroke
PSz,r(<<1) into a risk factor using α can be seen when comparing the users’ average SINRs whenα=50 to the ones associated withα = 500. An OP (user 10) was granted an average SINR value very comparable to other healthy users (as in user 7) and sometimes less than the SINR of healthy users as the case with users 1, 4, 5, and 7. While that same OP had an average SINR higher than all healthy users when α=500 is used.
The average SINR of an individual user ranged between 4 and 7.6 for the MILP (α = 500), and between 3.7 and 7.9 for the heuristic. A clearer illustration can be observed in Fig. 6 where the confidence interval for each individual user’s SINRs is shown.
3) THE IMPACT OFαON FAIRNESS AND SINR
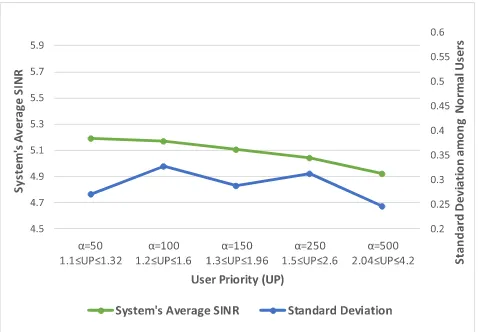
The proposed model can be fine-tuned using the parameter α(i.e. tuning factor) introduced in equation (7). This param-eter enables the reciprocity between the achievable fairness among users quantified by the SD and the average SINR. We examined the effect on the average SINR and the SD of using different values ofαas illustrated in Fig. 7 and in Fig. 8. Increasing the value ofαdirects the system to focus more on the OPs; consequently, a trade-off takes place resulting in lower values of the system’s average SINR as seen in Fig 8, to increase the SINR of the selected users (i.e. the OPs), negatively affecting fairness as illustrated by the increasing SD in Fig. 7.
[image:13.576.37.278.64.210.2]It should be noted that the individual SINRs for the OPs correspond to the weights given to each OP using the Naïve Bayesian Classifier. Sorting the users according to these weights produces an order that conforms to the values
FIGURE 7. The effects of changingαon fairness and average SINR (WSRMax approach).
FIGURE 8. The impact ofαon both user and average SINRs (WSRMax).
depicted in Fig. 8. The highest SINR was granted to user 9 which is the OP with the highest probability of stroke; thus the highest priority, while the lowest among the three OPs was user 10 who also happened to be the one with the least priority among the OPs (nevertheless still higher than the normal users).
B. THE PF APPROACH
1) BEFORE PRIORITIZING OPs
The objective function in (23) is applied to this scenario. The goal is to maximize the summation of the log of the users’ SINRs while ensuring fairness without prioritizing a certain subset of users. The results shown in Fig. 9 bare a trend similar to the one depicted in Fig. 5. However, due to the nature of the log function used in the objective function, fairness was maintained between the users (SD of 0.3 and 0.4 for the MILP and the heuristic, respectively), while the total SINR was reduced by 7% compared to the one produced by the MILP in the WSRMax approach.
[image:13.576.298.537.258.419.2]FIGURE 9. Users’ SINR before user prioritization (PF approach).
FIGURE 10. Users’ SINR after user prioritization (PF approach).
ranged between 4.4 and 6.1, and between 4.1 and 6.4 for the heuristic results.
2) AFTER PRIORITIZING OPs
In this scenario, the OPs’ priorities (i.e. weights) are updated according to the stroke likelihood determined through the use of big data analytics. The objective function in (26) is used; consequently, the model grants the OPs high powered PRBs as can be noted in Fig. 10. Comparing the PF approach to the WSRMax approach, it is evident that this approach grants the OPs higher SINRs (traded off with the other users). Further-more, this approach shows higher conformance between the heuristic and MILP than the previous one. However, this was accomplished by trading off the average SINR. The MILP scored an average SINR between 5.2 (α = 50) and 4.9 (α = 500) as can be seen in Fig. 10, while the heuristic’s average SINR is 5.1. In this approach, the impact of different risk factor values on the OPs is less in comparison with the WSRMax approach due to the use of the natural logarithm causing the SINR to reduce in favor of the OPs. Nevertheless, an increase in the average SINR can also be noted among the OPs as depicted in Fig. 10.
[image:14.576.38.279.252.411.2]Narrower confidence intervals can be noted when employ-ing this approach. As a matter of fact, this is a good indication
FIGURE 11. The effects of changingαon fairness and average SINR (PF approach).
FIGURE 12. The impact ofαon both user and average SINRs (PF approach).
of the precision of the approach in hand, thus producing results with narrower margins of error than the previous approach.
3) THE IMPACT OFαON FAIRNESS AND SINR
Increasing the weights allocated to the OPs in this approach has similar effects to the ones in the previous subsection V.A.3 as shown in Fig. 11 and in Fig. 12. The reduction in the SINR is around 4%. However, the OPs were assigned higher SINRs. Furthermore, better fairness was reported among healthy users with an SD between 0.27-0.32 (depending on the value ofα). Thus, offering a more stable approach.
Further analysis of Fig. 6 and Fig. 10 reveals that the SINR sum achieved by the WSRMax approach is larger than that of the PF approach. Since the WSRMax target is to maximize the sum rate (which is what an unregulated oper-ator tries to do) while the PF approach introduces fairness, hence resources are not all allocated to the user with the best channel. The PF approach improves fairness but reduces the sum rate (which is the case of a regulated operator).
[image:14.576.295.539.278.436.2]FIGURE 13. The heuristic’s scalability.
C. TESTING THE HEURISTIC’S SCALABILITY
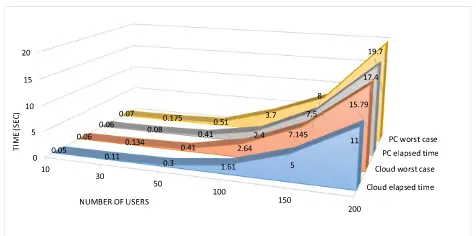
Employing higher LTE-A system bandwidths enables the operator to serve more users creating a challenge for the developed heuristic to allocate resources to OPs with min-imum delay to serve their urgent needs. To evaluate the scalability of the heuristic, elapsed time is considered.
We considered a scenario with six cases where the system operates at bandwidths of 1.4, 3, 5, 10, 15, and 20 MHz and increased the number of users, where all PRBs are occupied. For each case, we measured the time it takes the heuristic to allocate all users appropriate PRBs. The heuristic elapsed time was measured using the MATLAB functionsticandtoc. Time calculation was carried out using two platforms: a Win-dows 10 computer equipped with Intel core i5-4460 3.2 GHz quad-core processor and 16 GB of RAM, and cloud-based MATLAB provided by MathWorks. The latter offers a mea-surement reference where calculations are made by relying on cloud-based resources, where such cloud resources are expected to play a key role in the control of future cellular networks. Given that it can take a stroke-suffering OP up to 8 hours before being administered with an anesthetic, this heuristic’s performance meets the requirements of this appli-cation. However, testing the heuristic’s scalability in terms of other, more time-critical, applications is beyond the scope of this work. Fig. 13 illustrates the heuristic’s total elapsed time (in seconds) for both calculation methods versus the number of users. It should be noted that the worst case scenarios are also considered and depicted in Fig. 13.
The proposed heuristic tries to serveKusers to be allocated to K/2 PRBs on each of the two BSs with another loop dedicated to interferer allocation. The first run contains a search of total K possible interferers (before satisfying the conditionk6=m). This means it requiresO(N∗N
2∗2∗N) time. Additionally, the MATLAB sort function requiresO(NlogN) time [77]. Thus, the overall complexity isO(N4logN). The proposed heuristic provided a reduction in the run time to solve the NP-Hard problem [22] with a slight sacrifice in the accuracy of the results.
VI. OPEN RESEARCH DIRECTIONS
A. CHOOSING THE DECISION-MAKING ENTITY
Choosing the optimal type and location of computing (e.g. cloud, fog, etc.) is a separate optimization problem.
Additionally, this may depend on other factors (or variables) like the ratio of OPs to normal users.
B. TESTING THE IMPACT OF THE FEATURE RANKING TECHNIQUES
The current system treats the feature variables on an equal basis. However, we plan to further study the impact of each feature and correspondingly employ a suitable feature rank-ing technique. The impact of this technique can then be verified with clinical help.
C. ROUTING WITHIN SMALL CELLS IN 5G NETWORKS WITH PRIVACY
The proposed solution can be integrated with 5G networks. Optimized routing algorithms can be developed to carry the OPs’ traffic through the small cells with minimum latency. In addition, it is vital to protect the OPs’ privacy through the traversed hops. This can be addressed by classifying the OPs’ data in a ranking system, where the highest rank is treated as the most private medical data. Hence, a specific (secure) route is selected.
D. IMPACT OF OP MOBILITY
Grouping the OPs into clusters with common mobility pat-terns allows the operator to know in advance if there are some areas with high OP density. Hence, prepare the network. This means deploying more nodes so that these OPs do not severely impact the network operation. In addition, our current system works on a given realization of the patient data and channel conditions (although consideration is given to many realizations). However, in a real-world scenario, there is a constant change in the number of users accessing and leaving the BS coverage. Such dynamic behavior should be addressed, possibly by OP weighted beamforming and beamsteering.
E. USE OF INFRASTRUCTURE SHARING AND GAME THEORY
The use of infrastructure sharing can help ensure the widest coverage since the resulting area is the combination of all the local (or national) operators’ coverage at a reduced cost. To encourage the operators to participate, game theory can be used to establish coalitions, such that, for example, the higher the number of OPs, the more revenue is awarded to the operator, e.g., reduced taxes.
F. WIRELESS ENERGY TRANSFER FOR REMOTE DRUG INJECTION
data collection until administering the injection is crucial and has to be considered in the model.
G. TESTING OTHER DISCRETIZATION VALUES
The current model uses three ranges to categorize the continuous feature values of the Framingham dataset according to medical entities like the American National Institute of Health and the British Stroke Association. However, other medical entities such as the European Soci-ety of Hypertension (ESH) and the European SociSoci-ety of Cardiology (ESC) [78] offer further discretization ranges. In addition to comparing classification results, the use of different discretization techniques can be expected to affect the classification bias and variance of generated naive-Bayes classifiers [79].
VII. CONCLUSIONS
This paper introduced a system that employs the power of big data analytics to optimize the uplink of an LTE-A cellular network. OP’s medical record and readings from medical IoT sensors are processed in a big data analytics engine to find the likelihood of a stroke for an OP. The goal is to target OP users within the network to ensure they can always have access to the best wireless resources when in need. The proposed system achieves that with minimal impact on the wireless system-wide performance and SINR levels among healthy users in the network, thus improving the network utility for telecom operators while saving human lives and preserving fairness among normal users. Two approaches (WSRMax and PF) were presented and compared in terms of the average SINRs and fairness. The WSRMax approach improved the OPs’ average SINR by up to 26.6%, whereas the PF approach increased them by 40.5%. The average SINR for normal users ranged between 5.5 and 4.6 using the WSRMax approach while the PF approach reported a range between 4.6 and 4 (depending on α). Fairness among users was quantified using SD. The WSRMax approach granted the healthy users SINRs with an SD between 0.47 and 0.56 (depending on α) while the PF approach ranged between 0.24 and 0.3 SD. Furthermore, we developed a real-time heuristic to verify the MILP operation. The heuristic achieved comparable results to the MILP, and we demonstrated the heuristic’s scalability. We also presented several open research directions that we believe, if appropriately addressed, would ultimately refine the way future cellular networks can react to their users’ needs.
ACKNOWLEDGMENT
All data are provided in full in the results section of this paper.
REFERENCES
[1] J. Huang, S. Wang, X. Cheng, and J. Bi, ‘‘Big data routing in D2D com-munications with cognitive radio capability,’’IEEE Wireless Commun., vol. 23, no. 4, pp. 45–51, Aug. 2016.
[2] M. S. Hadi, A. Q. Lawey, T. E. El-Gorashi, and J. M. H. Elmirghani, ‘‘Big data analytics for wireless and wired network design: A survey,’’Comput. Netw., vol. 132, pp. 180–189, Feb. 2018.
[3] Y. Wang, L. Kung, and T. A. Byrd, ‘‘Big data analytics: Understanding its capabilities and potential benefits for healthcare organizations,’’Technol. Forecasting Social Change, vol. 126, pp. 3–13, Jan. 2018.
[4] L. A. Winters-Miner, Seven Ways Predictive Analytics Can Improve Healthcare. Amsterdam, The Netherlands: Elsevier, 2014.
[5] W. Raghupathi and V. Raghupathi, ‘‘Big data analytics in healthcare: Promise and potential,’’Health Inf. Sci. Syst., vol. 2, no. 1, p. 3, 2014. [6] P. Kiran, M. G. Jibukumar, and C. V. Premkumar, ‘‘Resource allocation
optimization in LTE-A/5G networks using big data analytics,’’ inProc. Int. Conf. Inf. Netw. (ICOIN), Jan. 2016, pp. 254–259.
[7] K. Zheng, Z. Yang, K. Zhang, P. Chatzimisios, K. Yang, and W. Xiang, ‘‘Big data-driven optimization for mobile networks toward 5G,’’IEEE Netw., vol. 30, no. 1, pp. 44–51, Jan./Feb. 2016.
[8] M. Rathore, A. Ahmad, A. Paul, J. Wan, and D. Zhang, ‘‘Real-time medical emergency response system: Exploiting IoT and big data for public health,’’J. Med. Syst., vol. 40, no. 12, p. 283, 2016.
[9] R. Cortés, X. Bonnaire, O. Marin, and P. Sens, ‘‘Stream processing of healthcare sensor data: Studying user traces to identify challenges from a big data perspective,’’Procedia Comput. Sci., vol. 52, pp. 1004–1009, Jan. 2015.
[10] M. Ballon. (2013). Number Crunchers o Trojan Family Magazine. Accessed: Jan. 23, 2017. [Online]. Available: https://tfm.usc.edu/number-crunchers/
[11] N. S. Banu and S. Swamy, ‘‘Prediction of heart disease at early stage using data mining and big data analytics: A survey,’’ inProc. Int. Conf. Elect., Electron., Commun., Comput. Optim. Techn. (ICEECCOT), Dec. 2016, pp. 256–261.
[12] D. Mozaffarianet al., ‘‘AHA statistical update,’’Heart Disease Stroke, vol. 132, p. e2–e20, Dec. 2015.
[13] State of the Nation: Stroke Statistics, Stroke Assoc., London, U.K., Jun. 2018.
[14] N. Bui and J. Widmer, ‘‘Mobile network resource optimization under imperfect prediction,’’ inProc. IEEE 16th Int. Symp. World Wireless, Mobile Multimedia Netw. (WoWMoM), Jun. 2015, pp. 1–9.
[15] M. Al-Rawi, R. Jantti, J. Torsner, and M. Sagfors, ‘‘Channel-aware inter-cell interference coordination for the uplink of 3G LTE networks,’’ inProc. Wireless Telecommun. Symp., Apr. 2009, pp. 1–5.
[16] S. Sesia, M. Baker, and I. Toufik,LTE—The UMTS Long Term Evolution: From Theory to Practice. Hoboken, NJ, USA: Wiley, 2011.
[17] A. Aijaz, M. R. Nakhai, and A. H. Aghvami, ‘‘Power efficient uplink resource allocation in LTE networks under delay QoS constraints,’’ inProc. IEEE Global Commun. Conf., Dec. 2014, pp. 1239–1244.
[18] F. Ghavimi, Y.-W. Lu, and H.-H. Chen, ‘‘Uplink scheduling and power allocation for M2M communications in SC-FDMA-based LTE-A net-works with QoS guarantees,’’IEEE Trans. Veh. Technol., vol. 66, no. 7, pp. 6160–6170, Jul. 2017.
[19] F. Moety, S. Lahoud, B. Cousin, and K. Khawam, ‘‘Joint power-delay minimization in 4G wireless networks,’’ inProc. IFIP Wireless Days (WD), Nov. 2014, pp. 1–8.
[20] B. Bakhshi and S. Khorsandi, ‘‘On the performance and fairness of dynamic channel allocation in wireless mesh networks,’’Int. J. Commun. Syst., vol. 26, no. 3, pp. 293–314, 2013.
[21] R. V. Sathya, V. Venkatesh, R. Ramji, A. Ramamurthy, and B. R. Tamma, ‘‘Handover and SINR optimized deployment of LTE FEMTO base stations in enterprise environments,’’ Wireless Pers. Commun., vol. 88, no. 3, pp. 619–643, 2016.
[22] P. Adasme, J. Leung, and A. Lisser, ‘‘Resource allocation in uplink wireless multi-cell OFDMA networks,’’Comput. Standards Interfaces, vol. 44, pp. 274–289, Feb. 2016.
[23] J. P. Muñoz-Gea, R. Aparicio-Pardo, H. Wehbe, G. Simon, and L. Nuaymi, ‘‘Optimization framework for uplink video transmission in HetNets,’’ in
Proc. Workshop Mobile Video Del., 2014, p. 6.
[24] J. F. Borin and N. L. S. da Fonseca, ‘‘Admission control for WiMAX networks,’’ Wireless Commun. Mobile Comput., vol. 14, no. 14, pp. 1409–1419, 2014.
[25] T. Ohkuboet al., ‘‘How many times should blood pressure be measured at home for better prediction of stroke risk? Ten-year follow-up results from the Ohasama study,’’J. Hypertension, vol. 22, no. 6, pp. 1099–1104, 2004.
[26] J. G. A. Ebenezer and S. Durga, ‘‘Big data analytics in healthcare,’’J. Eng. Appl. Sci., vol. 10, no. 8, pp. 3645–3650, 2015.
[27] T. M. Mitchell,Machine Learning. New York, NY, USA: McGraw-Hill, 1997.
[28] Z. Zheng, ‘‘Naive Bayesian classifier committees,’’ inProc. Eur. Conf. Mach. Learn., 1998, pp. 196–207.