This is a repository copy of
Mapping the FACT-B instrument to EQ-5D-3L in Patients with
Breast Cancer using Adjusted Limited Dependent Variable Mixture Models vs Response
Mapping
.
White Rose Research Online URL for this paper:
http://eprints.whiterose.ac.uk/131975/
Version: Published Version
Article:
Gray, L.A. orcid.org/0000-0001-6365-7710, Wailoo, A. and Hernandez, M. (2018) Mapping
the FACT-B instrument to EQ-5D-3L in Patients with Breast Cancer using Adjusted Limited
Dependent Variable Mixture Models vs Response Mapping. Value in Health. ISSN
1098-3015
https://doi.org/10.1016/j.jval.2018.06.006
[email protected]
https://eprints.whiterose.ac.uk/
Reuse
This article is distributed under the terms of the Creative Commons Attribution (CC BY) licence. This licence
allows you to distribute, remix, tweak, and build upon the work, even commercially, as long as you credit the
authors for the original work. More information and the full terms of the licence here:
https://creativecommons.org/licenses/
Takedown
If you consider content in White Rose Research Online to be in breach of UK law, please notify us by
A v a i l a b l e o n l i n e a t w w w . s c i e n c e d i r e c t . c o m
j o u r n a l h o m e p a g e : w w w . e l s e v i e r . c o m / l o c a t e / j v a l
Mapping the FACT-B Instrument to EQ-5D-3L in Patients with
Breast Cancer Using Adjusted Limited Dependent Variable
Mixture Models versus Response Mapping
Laura A. Gray, MSc, PhD⁎
, Allan J. Wailoo, MA, MSc, PhD, Monica Hernandez Alava, MSc, PhD
Health Economics and Decision Science, School of Health and Related Research, University of Sheffield, Sheffield, South Yorkshire, UK
A B S T R A C T
Background: Preference-based measures of health, such as the three-level EuroQolfive-dimensional questionnaire (EQ-5D-3L), are required to calculate quality-adjusted life-years for use in cost-effectiveness analysis, but are often not recorded in clinical studies. In these cases, mapping can be used to estimate preference-based measures. Objec-tives:To model the relationship between the EQ-5D-3L and the Functional Assessment of Cancer Therapy—Breast Cancer (FACT-B) instrument, comparing indirect and direct mapping methods, and the use of FACT-B summary score versus FACT-B subscale scores. Meth-ods:We used data from three clinical studies for advanced breast cancer providing 11,958 observations with full information on FACT-B and the EQ-5D-3L. We compared direct mapping using adjusted limited dependent variable mixture models (ALDVMMs) with indirect mapping using seemingly unrelated ordered probit models. The EQ-5D-3L was estimated as a function of FACT-B and other patient-related covariates.Results: The use of FACT-B subscale scores was better than using the total FACT-B score. A goodfit to the observed
data was observed across the entire range of disease severity in all models. ALDVMMs outperformed the indirect mapping. The breast cancer–specific scale had a strong influence in predicting the pain/ discomfort and self-care dimensions of the EQ-5D-3L.Conclusions:
This article adds to the growing literature that demonstrates the performance of the ALDVMM method for mapping. Regardless of which model is used, the subscales of FACT-B should be included as independent variables wherever possible. The breast cancer–specific subscale of FACT-B is important in predicting the EQ-5D-3L. This suggests that generic cancer measures should not be used for utility mapping in patients with breast cancer.
Keywords:mixture models, utility mapping, EQ-5D-3L, ALDVMM, FACT-B.
Copyright&2018, ISPOR–The Professional Society for Health
Econom-ics and Outcomes Research. Published by Elsevier Inc. This is an open access article under the CC BY license
(http://creativecommons.org/licenses/by/4.0/).
Introduction
Outcomes recorded in clinical studies often do not include preference-based measures (PBMs) such as the three-level Euro-Qol five-dimensional questionnaire (EQ-5D-3L). Nevertheless, PBMs are required for use in cost-effectiveness analysis when quality-adjusted life-years need to be calculated. Health utility mapping is used to estimate a PBM using other outcomes that have been collected in clinical trials, including clinical outcome measures. In cancer studies there is often a focus on survival time and on disease-specific quality-of-life measures. This article aims to develop a mapping algorithm that estimates EQ-5D-3L scores in patients with breast cancer.
The EQ-5D-3L is one of the most widely used PBMs, compris-ing five dimensions (mobility, self-care, usual activities, pain/ discomfort, and anxiety/depression) with three levels per dimen-sion (no/moderate/extreme problems).
The Functional Assessment of Cancer Therapy—Breast (FACT-B)
[1] is a self-reported instrument that measures health-related quality of life of patients with breast cancer. It comprises five
subscales including physical well-being, social well-being, emo-tional well-being, funcemo-tional well-being, and a breast cancer– spe-cific (BCS) subscale. Each subscale has seven items, with the exception of the emotional well-being subscale, which has six items, and the BCS subscale, which has nine items. Items are rated from 0 (not at all) to 4 (very much) and a total score is derived. The total FACT-B score ranges from 0 to 123, and is calculated by adding the scores from each of these subscales. Lower scores indicate better health.
The only previous mapping study using FACT-B, according to the Health Economics Research Centre Database of Mapping Studies [2], mapped to the five-level EQ-5D using data from Singapore and applied only simple linear regression methods. There is a large literature that shows that the theoretical assumptions of linear regression methods are not met when mapping to the EQ-5D-3L and that they produce biased results
[3,4]. Response mapping has been shown to outperform standard statistical techniques such as linear regression, generalized linear models, and fractional logistic models[5]. Mixture models, how-ever, have previously been shown to outperform both linear
1098-3015$36.00 –see front matter Copyright&2018, ISPOR–The Professional Society for Health Economics and Outcomes Research.
Published by Elsevier Inc. This is an open access article under the CC BY license (http://creativecommons.org/licenses/by/4.0/).
https://doi.org/10.1016/j.jval.2018.06.006
*Address correspondence to:Laura A. Gray, Health Economics and Decision Science, School of Health and Related Research, University of Sheffield, Sheffield, South Yorkshire S1 4DA, UK.
regression and response mapping in a range of settings[4,6,7]. Mapping models that use the individual subscale scores of an instrument to map to a PBM are expected to have a model fit superior to those that use only the total instrument score; condensing outcome data into a summary measure discards important information but may be more practically relevant to those wishing to use the mapping results in economic models that rely on data that include the summary score only.
In this article we map from the FACT-B instrument to the EQ-5D-3L, using bespoke adjusted limited dependent variable mix-ture models (ALDVMMs) [8] and compare results to response mapping using seeming unrelated (SUR) ordered probit models. We also compare both techniques using the total FACT-B score and the separate subscale scores of the FACT-B.
Methods
Data
Three phase III clinical studies measured both the EQ-5D-3L and FACT-B and were available for analysis.
The Treatment Across multiple liNes wIth Avastin (TANIA) trial recruited patients with HER2-negative locally recurrent/ metastatic breast cancer whose disease had progressed on or afterfirst-line bevacizumab combined with chemotherapy. They were randomized to receive standard second-line chemotherapy either alone or in combination with bevacizumab[9]. In total, 494 patients were randomized. FACT-B was administered at baseline, every 8 or 9 weeks (depending on treatment schedule) during second-line therapy, and at the time of second progression. The EQ-5D-3L was administered at baseline, during second-line treat-ment at weeks 8 and 16 (4-week cycles) or at weeks 9 and 18 (3-week cycles), and at second-line disease progression (up to3
years).
The MARIANNE study is an international, randomized, multi-center, three-arm study involving 1095 people with HER2-positive advanced breast cancer. Patients were assigned 1:1:1 to control (trastuzumab plus taxane), T-DM1 plus placebo, and T-DM1 plus pertuzumab at standard doses.
The Batman study was an open-label, single-arm, multicenter UK study of the safety and tolerability of bevacizumab when combined with taxane monotherapy asfirst-line therapy of 50 patients with triple-negative metastatic breast cancer.
Data were pooled to maximize sample size and reduce uncertainty.
Statistical Analysis
The EQ-5D-3L has a distinctive distribution. Here, we used the UK tariff but its characteristics are common to many other countries. It is bounded below at 0.594 and above at 1. It includes a multimodal distribution as well as a mass of observations at 1, representing full health. There is a gap between full health and the next feasible health state (0.883). These properties are difficult to estimate using standard statistical techniques. We used two statistical methods in an attempt to overcome this problem.
First, we applied response mapping by using SUR ordered probit models using the “cmd” command in Stata (StataCorp, College Station, TX) for estimating conditional mixed process models with multilevel random effects and coefficients. This method estimates responses to each of thefive EQ-5D-3L dimen-sions, jointly using ordered probit models allowing the error terms to be correlated. We then calculated the expected EQ-5D-3L scores on the basis of the probabilities of each of the possible 243 health states as a separate second step.
Second, we used ALDVMMs using the publicly available Stata command“aldvmm”[8]. These bespoke models were specifically designed for mapping to the EQ-5D-3L. These include a discrete element using multinomial logit models for the probability of component (or latent class) membership, including a component representing full health. Using multiple components in a mixture model allows us to capture the multimodal properties of the distribution. The EQ-5D-3L does not show (trastuzumab emtan-sine) a normal distribution and so it is important to be able to accurately estimate the unusual distribution. By limiting the dependent variable, the ALDVMM prevents prediction outside the feasible range: it cannot predict below 0.594 or above 1. It also takes into account the unfeasible gap between full health and the next feasible health state. Independent variables can influence component membership and/or each of the compo-nents in the mixture model part. This model has been used with success in previous mapping studies[4,6,7,10–12].
The FACT-B score is made up of a set of subscores: physical, social, emotional, and functional well-being and a BCS subscale. All cancer-specific FACT-B scores include thefirst four of these subscores as well as a cancer-specific subscale. We mapped from the FACT-B instrument to the EQ-5D-3L using two sets of covariates. First, we used the total FACT-B score, the age of the patient, and age-squared. Second, we used the individual sub-scores of the FACT-B, the age of the patient, and age-squared. Models were estimated without age included, but age was found to improve thefit of the models. We did not include sex because there were very few male patients in the data set. We used the UK value sets for the EQ-5D-3L[13].
To compare results across models we considered different measures of modelfit in line with the International Society for Pharmacoeconomics and Outcomes Research Good Practice Guide on Mapping [14]. To determine the preferred number of components in the mixture models, we considered model fit using mean absolute error (MAE), root mean square error (RMSE), and Akaike and Bayesian information criteria (AIC and BIC, respectively) as well as considered visual representations of model fit. We plotted the mean of the predicted values of FACT-B with the mean of the observed values, for the entire range of disease severity. We also simulated data from the models and plotted the cumulative distribution functions (CDFs), comparing simulated with observed data across the spectrum of disease severity. These CDFs are an important means of assessing modelfit relevant to those settings that may use the mapping for analysis at the patient level, for example, in a trial-based cost-effectiveness analysis or a patient-level decision model[14].
Results
The combined data contained 11,952 complete cases (1,002 in the TANIA study, 10,687 in the MARIANNE study, and 263 in the Batman study), that is, valid EQ-5D-3L values and valid FACT-B scores, including subscores. Six observations from male patients in the MARIANNE study were excluded. Table 1 presents the summary statistics for this sample. The average age was 52.61⫾
11.5 years. Patients spanned the full spectrum of disease meas-ured by the EQ-5D-3L and FACT-B.Figure 1shows the distribution of the EQ-5D-3L reported in the sample. The distribution is multimodal, has a spike of observations at full health, and displays the gap between full health and the next feasible state. There are 3295 observations (27.6% of the sample) at full health and 172 (1.4% of the sample) with values worse than death (o0). Figure 1 also shows the FACT-B distribution, which spans the entire feasible range (0–123) and is positively skewed.
SUR Ordered Probit Models
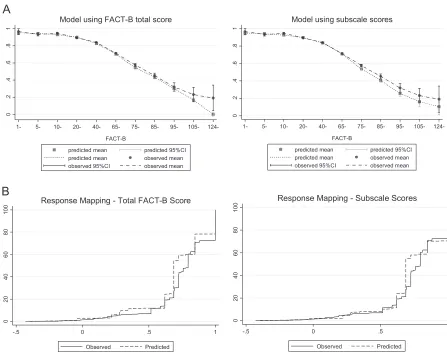
We estimated two response mappings to the EQ-5D-3L using SUR ordered probit models: thefirst using the total FACT-B score and the second using the FACT-B subscale scores.Table 2 presents the modelfit statistics. Of these models, the mean error, MAE, and RMSE are smaller in the model that includes the subscales of FACT-B. AIC and BIC are also lower in the subscale model, and the proportions predicted at full health and in a state worse than death are also closer to the observed data when using the subscales. Figure 2 displays mean predicted versus mean observed values for response mapping using the total FACT-B score and the FACT-B subscale scores. Using the subscale model improves fit at higher values of FACT-B when patients are in poorer health.Figure 2also shows the CDFs for the SUR response mappings using the total FACT-B score and the FACT-B subscale scores. The figure shows that the model that includes the individual subscale scores of FACT-B has a betterfit than the model that includes only the FACT-B summary score.
Adjusted Limited Dependent Variable Mixture Model
We estimated ALDVMMs with one to four components and using FACT-B subscale scores versus total FACT-B score both within the components and as determinants of component membership. We attempted to estimate models using five components, but
there were problems with convergence.Table 2presents thefit statistics.
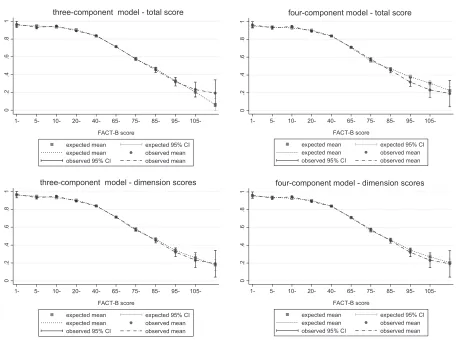
Of the models estimated that include the total FACT-B score, the model with four components is preferred when looking at the AIC and BIC. Nevertheless, the three-component model has lower error measures. Both the three- and four-component models are more accurate than models with fewer components in simulating the proportion of patients at full health and in a state worse than death. Figure 3 shows mean predicted versus mean observed values in the and four-component ALDVMMs. The three-component model appears to predict the observed data better than the four-component model at most of the FACT-B scores. Nevertheless, the three-component model predicts less well individuals scoring extremely poor values on the FACT-B scale.
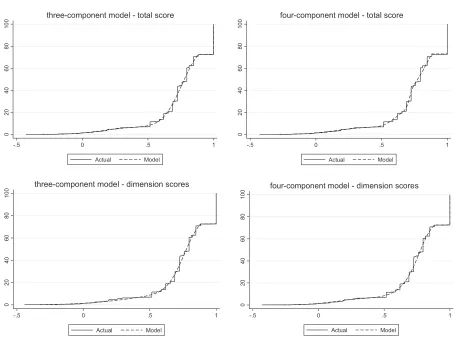
Figure 4, which displays the CDFs for the mixture models that use three and four components, shows that simulated data from the mixture modelsfit the observed data closely for both models that use the total FACT-B score. Given that, the evidence suggests that both the three- and four-component models that use the total FACT-B score fit the data very closely. Because there is little visible difference in modelfit for the two models (Figs. 3and4) as well as the model fit statistics, we prefer the simpler three-component model with fewer parameters.
[image:4.594.47.550.84.242.2]FromTable 2it can be seen that of the models estimated that include the FACT-B subscale scores in place of the total FACT-B
Table 1–Descriptive statistics.
Variable (n¼11,952) Mean⫾SD Minimum Maximum
EQ-5D-3L index score 0.762⫾0.227 0.594 1
Mobility 1.243⫾0.438 1 3
Self-care 1.120⫾0.340 1 3
Usual activities 1.370⫾0.529 1 3
Pain/discomfort 1.611⫾0.545 1 3
Anxiety/depression 1.492⫾0.556 1 3
FACT-B 40.204⫾20.269 0 123
Physical well-being 5.434⫾4.829 0 33
Social/family well-being 6.394⫾5.290 0 28
Emotional well-being 6.407⫾4.522 0 24
Functional well-being 9.663⫾6.073 0 28
BCS 12.306⫾6.234 0 38
Age (y)/10 5.261⫾1.150 2.2 8.7
BCS, breast cancer–specific; EQ-5D-3L, three-level EuroQolfive-dimensional questionnaire; FACT-B, Functional Assessment of Cancer Therapy
—Breast Cancer.
0
2
4
6
8
-.5 0 .5 1
EQ-5D
0
5
0
0.
.0
1
5
1
0.
.0
2
0 50 100 150
FACT-B
[image:4.594.73.522.555.715.2]Table 2–Modelfit for response mappings and ALDVMMs.
FACT-B total/ subscales
Number of components
Log likelihood
AIC BIC Mean
error
Mean absolute
error
RMSE Proportion of predicted observations at
full health (%)
Proportion of predicted observations
below 0 (%)
Response mapping
Total scores
– 29,869.95 59,809.91 60,068.53 0.0117 0.1341 0.1824 21.7 2.8
Subscales – 27,530.01 55,170.02 55,576.43 0.0092 0.1216 0.1682 29.6 1.89
ALDVMMs
Total FACT-B
1 735.2737 1,480.547 1,517.493 0.0018 0.1330 0.1829 34.3 0.2
2 1,217.156 2,406.312 2,302.863 0.0006 0.1324 0.1815 25.2 1.6 3 1,395.884 2,745.768 2,575.818 0.000007 0.1318 0.1815 27.4 1.5 4 1,724.382 3,384.763 3,148.310 0.0001 0.1332 0.1818 27.4 1.5 Subscales 1 435.7411 853.4822 786.9798 0.0002 0.1207 0.1656 33.9 0.1 2 2,476.873 4,901.747 4,709.629 0.0005 0.1199 0.1654 25.9 1.6 3 2,867.129 5,648.258 5,330.524 0.0004 0.1155 0.1631 27.6 1.4 4 3,075.795 6,031.590 5,588.240 0.00009 0.1158 0.1633 27.0 1.5
Note. Proportion of observations at full health¼ 27.6%, proportion in a state worse than death¼1.4%. Note that AIC and BIC are not
comparable between response mapping and ALDVMMs.
AIC, Akaike information criterion; ALDVMM, adjusted limited dependent variable mixture model; BIC, Bayesian information criterion; FACT-B, Functional Assessment of Cancer Therapy—Breast Cancer; RMSE, root mean square error.
0
.2
.4
.6
.8
1
1- 5- 10- 20- 40- 65- 75- 85- 95- 105-
124-FACT-B
predicted mean predicted 95%CI predicted mean observed mean observed 95%CI observed mean Model using FACT-B total score
0
.2
.4
.6
.8
1
1- 5- 10- 20- 40- 65- 75- 85- 95- 105-
124-FACT-B
predicted mean predicted 95%CI predicted mean observed mean observed 95%CI observed mean Model using subscale scores
0
20
40
60
80
0
0
1
-.5 0 .5 1
Observed Predicted Response Mapping - Total FACT-B Score
0
20
40
60
80
0
0
1
-.5 0 .5 1
Observed Predicted Response Mapping - Subscale Scores
A
B
Fig. 2–(A) Mean predicted vs. mean observed values using response mapping with total FACT-B score and subscale scores. (B) Cumulative distribution functions using response mapping with total FACT-B score and subscale scores. CI, confidence interval; FACT-B, Functional Assessment of Cancer Therapy—Breast Cancer.
[image:5.594.71.518.355.711.2]score, the model with three components is preferred when looking at the AIC and BIC as well as the mean error. Never-theless, the four-component model has lower MAE and RMSE. The three-component subscale model produces the most accu-rate simulation of the data in terms of the proportion predicted at full health and in a state worse than death.Figure 3shows little difference between the model fits of the three- and four-component models when using the subscale scores. Figure 4
shows that simulated data from both the three- and four-component mixture models using subscale scores fit the observed data closely. We again consider the three-component model as the preferred model to avoid adding unnecessary parameters.
The results show that including individual FACT-B subscales as independent variables improves model fit compared with using the total FACT-B score. MAE and RMSE as well as AIC and BIC are consistently smaller in the models that include individual subscales. Figure 3 displays the mean predicted versus mean observed values for the mixture models. It shows that models including the individual subscale scores of FACT-B are preferred to those that use the total FACT-B score.Figure 4shows that all ALDVMMs produce simulated data thatfit the observed data very closely.
Model fit statistics in Table 2 suggest that, in all cases, ALDVMMs outperform response mapping using SUR ordered probit models. Similarly,Figures 3and4show that the ALDVMMs provide a significant improvement in modelfit to the response
mappings when compared withFigure 2. In particular,Figure 4
shows that the ALDVMMs produce simulated data that better represent the observed data particularly at the low and high extremes of the EQ-5D-3L. The mixture models are better equipped to deal with the EQ-5D-3L distribution than is the response mapping. More specifically, the ALDVMMs are generally better able tofit the EQ-5D-3L distribution in patients with poor health states.
There is little difference between the modelfit statistics of the ALDVMM when using total FACT-B score compared with the response mapping using individual FACT-B subscale scores (see
Table 2). This is supported by thefigures that show no obvious superiority of the response mapping using FACT-B subscale scores compared with using the ALDVMM with total FACT-B score. The ALDVMM improves modelfit, particularly in the main part of the distribution compared with response mapping, regardless of whether the total FACT-B score or individual subscale scores are used.
In each of the subscale models estimated, the BCS subscale was found to have a strong and statistically significant influence. The response mapping showed that this subscale has a strong influence in predicting the pain/discomfort and self-care dimen-sions of the EQ-5D-3L. The ALDVMM results show that besides having some significant influence on the within-component estimates of the EQ-5D-3L, the BCS subscale of the FACT-B has a substantial influence on the component membership in these models.
0
.2
.4
.6
.8
1
1- 5- 10- 20- 40- 65- 75- 85- 95-
105-FACT-B score
expected mean expected 95% CI expected mean observed mean observed 95% CI observed mean three-component model - total score
0
.2
.4
.6
.8
1
1- 5- 10- 20- 40- 65- 75- 85- 95-
105-FACT-B score
expected mean expected 95% CI expected mean observed mean observed 95% CI observed mean four-component model - total score
0
.2
.4
.6
.8
1
1- 5- 10- 20- 40- 65- 75- 85- 95-
105-FACT-B score
expected mean expected 95% CI expected mean observed mean observed 95% CI observed mean three-component model - dimension scores
0
.2
.4
.6
.8
1
1- 5- 10- 20- 40- 65- 75- 85- 95-
105-FACT-B score
expected mean expected 95% CI expected mean observed mean observed 95% CI observed mean four-component model - dimension scores
[image:6.594.69.525.67.407.2]The ALDVMMs estimated in this study can be easily imple-mented via Excelfiles and Stata’s .sterfiles, which are provided in theSupplemental Materialsfound athttps://doi.org/10.1016/j.jval. 2018.06.006.
Discussion
Little is known about the relationship between FACT-B and PBMs for use in the economic evaluation of technologies in breast cancer. The only such study identified in the HERC Database of Mapping Studies[2]is based on data from patients in Singapore and it used simplistic mapping methods[15]. The study found that linear regression outperformed other simple mapping mod-els based on narrow assessment of summary fit. The lack of previous mapping studies in this disease area emphasizes the need for more research in utility mapping in patients with breast cancer.
This article provides reliable estimates for the calculation of the EQ-5D-3L as a function of FACT-B in patients with breast cancer. We provide estimates that can be used when analysts have access only to total FACT-B scores or when they have access to subscale responses. The mapping algorithms produced in this study should not be used to map from FACT-B to any other PBM, including the EQ-5D-5L.
Our results show that although response mapping has been previously shown to be superior to direct utility mapping using, for example, linear regression and generalized linear models[5], the bespoke ALDVMM offers a betterfit than response mapping
using SUR ordered probit models in this setting. This adds to the growing literature on the performance of mixture models for mapping and is consistent with those thatfind they outperform response mapping[4].
We find that models that use the subscales of FACT-B as independent variables perform the best. Nevertheless, subscale scores are not always reported in summary reports of clinical studies. Often, the total FACT-B score will be all that is available and therefore the corresponding summary score models are important for analysts populating cost-effectiveness models. Wefind that when using the ALDVMM to map the total FACT-B score to the EQ-5D-3L, model fit is similar to the response mapping, which includes each of the subscales.
For the reasons discussed here, we suggest that the three-component ALDVMM that uses the individual subscales is the preferred model with the best overallfit to the data and should be used when individual subscale scores are available. When indi-vidual subscale scores are not available, the three-component ALDVMM using the total FACT-B score should be used.
Consistent with other mapping studies, we found age to be important and statistically significant in predicting the EQ-5D-3L. This is particularly important when mapping algorithms are used in cost-effectiveness analysis. Sex, which is usually included in mapping studies, is not included here because the samples were all female.
Our findings show that the BCS subscale of FACT-B signifi -cantly predicts the EQ-5D-3L. This suggests that it is important to include the BCS questions, either in the form of the FACT-B subscale or within the total FACT-B score. Other FACT measures
0
20
40
60
80
0
0
1
-.5 0 .5 1
Actual Model three-component model - total score
0
20
40
60
80
0
0
1
-.5 0 .5 1
Actual Model four-component model - total score
0
20
40
60
80
0
0
1
-.5 0 .5 1
Actual Model three-component model - dimension scores
0
20
40
60
80
0
0
1
-.5 0 .5 1
Actual Model four-component model - dimension scores
Fig. 4–Cumulative distribution functions using three- and four-component ALDVMMs with FACT-B subscale scores. ALDVMM, adjusted limited dependent variable mixture model; FACT-B, Functional Assessment of Cancer Therapy—Breast Cancer.
[image:7.594.69.523.64.404.2]or instruments that do not contain any BCS questions should not be used to map to PBMs in patients with breast cancer. For example, a general cancer instrument, FACT-G, has previously been used to map to the EQ-5D-3L in a range of patients with cancer[15–18]. Our results show that more specific cancer instru-ments will produce more accurate results.
This study has limitations. The data used contain repeated observations on the same patients over time. To account for this we used clustered standard errors; nevertheless, this was not found to significantly change the results. Although the data used in this study span the full range of the FACT-B and the EQ-5D-3L scores, there are a few observations at the higher end of the FACT-B score. This could be an artefact of the clinical study populations, but may be typical of the breast cancer population. It is important that analysts consider the relevant population for the specific health technology in question when using these results in cost-effectiveness analysis.
Conclusions
The ALDVMM has been shown to outperform linear regression, response mapping, and other statistical models in a range of disease settings. Further research into different types of mixture models, for example, a beta-based mixture model[19], could help to further develop mapping methods in patients with breast cancer.
Acknowledgment
We thank F. Hoffman La Roche for providing data for this project and for providing comments on previous versions of this work.
Source offinancial support: This work was supported by a grant from the Medical Research Council Methodology Research Programme (grant no. MR/L022575/1) and the National Institute for Health and Care Excellence through its Decision Support Unit. Neither the sponsors nor the providers of the data had any control over the content of this article. The views represented are those of the authors alone.
Supplemental Materials
Supplemental material associated with this article can be found in the online version athttps://doi.org/10.1016/j.jval.2018.06.006.
R E F E R E N C E S
[1]Brady M, Cella D, Mo F, et al. Reliability and validity of the Functional Assessment of Cancer Therapy-Breast quality-of-life instrument. J Clin Oncol 1997;15:974–86.
[2]Dakin H, Abel L, Burns R, Yang Y. Review of studies mapping from quality of life or clinical measures to EQ-5D: an online database. Health Qual Life Outcomes 2018;16:1–9.
[3]Gray AM, Rivero-Arias O, Clarke PM. Estimating the association between SF-12 responses and EQ-5D utility values by response mapping. Med Decis Making 2006;26:18–29.
[4]Wailoo A, Hernández M, Philips C, et al. Modeling health state utility values in ankylosing spondylitis: comparisons of direct and indirect methods. Value Health 2015;18:425–31.
[5]Dakin H, Gray A, Murray D. Mapping analyses to estimate EQ-5D utilities and responses based on Oxford Knee Score. Qual Life Res 2013;22:683–94.
[6]Hernandez Alava M, Wailoo A, Wolfe F, Michaud K. A comparison of direct and indirect methods for the estimation of health utilities from clinical outcomes. Med Decis Making 2014;34:919–30.
[7]Gray LA, Hernández Alava M, Wailoo AJ. Development of methods for the mapping of utilities using mixture models: mapping the AQLQ-S to the EQ-5D-5L and the HUI3 in patients with asthma. Value Health 2018;21:748–57.
[8]Hernandez Alava M, Wailoo AJ. Fitting adjusted limited dependent variable mixture models to EQ-5D. Stata J 2015;15:737–50.
[9]Vrdoljak E, Marschner N, Zielinski C, et al. Final results of the TANIA randomised phase III trial of bevacizumab after progression on first-line bevacizumab therapy for HER2-negative locally recurrent/ metastatic breast cancer. Ann Oncol 2016;27:2046–52.
[10]Hernández Alava M, Wailoo AJ, Ara R. Tails from the peak district: adjusted limited dependent variable mixture models of EQ-5D questionnaire health state utility values. Value Health 2012;15:550–61. [11]Fuller G, Hernandez M, Pallot D, et al. Health state preference weights
for the Glasgow Outcome Scale following traumatic brain injury: a systematic review and mapping study. Value Health 2017;20:141–51. [12]Hernández Alava M, Wailoo A, Wolfe F, Michaud K. The relationship
between EQ-5D, HAQ and pain in patients with rheumatoid arthritis. Rheumatology (Oxford) 2013;52:944–50.
[13]Dolan P. Modeling valuations for EuroQol health states. Med Care 1997;35:1095–108.
[14]Wailoo AJ, Hernandez-Alava M, Manca A, et al. Mapping to estimate health-state utility from non-preference-based outcome measures: an ISPOR Good Practices for Outcomes Research Task Force Report. Value Health 2017;20:18–27.
[15]Teckle P, McTaggart-Cowan H, Van der Hoek K, et al. Mapping the FACT-G cancer-specific quality of life instrument to the EQ-5D and SF-6D. Health Qual Life Outcomes 2013;11:1–10.
[16]Young TA, Mukuria C, Rowen D, et al. Mapping functions in health-related quality of life: mapping from two cancer-specific health-health-related quality-of-life instruments to EQ-5D-3L. Med Decis Making
2015;35:912–26.
[17]Longworth L, Yang Y, Young T, et al. Use of generic and condition-specific measures of health-related quality of life in NICE decision-making: a systematic review, statistical modelling and survey. Health Technol Assess 2014;18:1–224.
[18]Cheung YB, Thumboo J, Gao F, et al. Mapping the English and Chinese versions of the functional assessment of cancer therapy-general to the EQ-5D utility index. Value Health 2009;12:371–6.