R E S E A R C H A R T I C L E
Open Access
Pathologic response prediction to neoadjuvant
chemotherapy utilizing pretreatment near-infrared
imaging parameters and tumor pathologic criteria
Quing Zhu
1*, Liqun Wang
2, Susan Tannenbaum
3, Andrew Ricci Jr
4, Patricia DeFusco
5and Poornima Hegde
3Abstract
Introduction:The purpose of this study is to develop a prediction model utilizing tumor hemoglobin parameters measured by ultrasound-guided near-infrared optical tomography (US-NIR) in conjunction with standard pathologic tumor characteristics to predict pathologic response before neoadjuvant chemotherapy (NAC) is given.
Methods:Thirty-four patients’data were retrospectively analyzed using a multiple logistic regression model to predict response. These patients were split into 30 groups of training (24 tumors) and testing (12 tumors) for cross validation. Tumor vascularity was assessed using US-NIR measurements of total hemoglobin (tHb), oxygenated (oxyHb) and deoxygenated hemoglobin (deoxyHb) concentrations acquired before treatment. Tumor pathologic variables of tumor type, Nottingham score, mitotic index, the estrogen and progesterone receptors and human epidermal growth factor receptor 2 acquired before NAC in biopsy specimens were also used in the prediction model. The patients’pathologic response was graded based on the Miller-Payne system. The overall performance of the prediction models was evaluated using receiver operating characteristic (ROC) curves. The quantitative measures were sensitivity, specificity, positive and negative predictive values (PPV and NPV) and the area under the ROC curve (AUC).
Results:Utilizing tumor pathologic variables alone, average sensitivity of 56.8%, average specificity of 88.9%, average PPV of 84.8%, average NPV of 70.9% and average AUC of 84.0% were obtained from the testing data. Among the hemoglobin predictors with and without tumor pathological variables, the best predictor was tHb combined with tumor pathological variables, followed by oxyHb with pathological variables. When tHb was included with tumor pathological variables as an additional predictor, the corresponding measures improved to 79%, 94%, 90%, 86% and 92.4%, respectively. When oxyHb was included with tumor variables as an additional predictor, these measures improved to 77%, 85%, 83%, 83% and 90.6%, respectively. The addition of tHb or oxyHb significantly improved the prediction sensitivity, NPV and AUC compared with using tumor pathological variables alone.
Conclusions:These initial findings indicate that combining widely used tumor pathologic variables with hemoglobin parameters determined by US-NIR may provide a powerful tool for predicting patient pathologic response to NAC before the start of treatment.
Trial registration:ClincalTrials.gov ID: NCT00908609 (registered 22 May 2009)
* Correspondence:[email protected]
1Biomedical Engineering and Electrical and Computer Engineering
Departments, University of Connecticut, 371 Fairfield Road, U2157, Storrs, CT 06269, USA
Full list of author information is available at the end of the article
Introduction
Preoperative or neoadjuvant chemotherapy (NAC) is in-creasingly used in the management of locally advanced breast cancers, as well as in patients with lower tumor stages, to increase the rate of breast-conserving therapy and to reduce the extent of surgery [1-3]. Complete eradication of invasive tumor cells in the primary tumor bed following neoadjuvant therapy is strongly correlated with improved disease-free survival and overall survival [4]. Furthermore, clinical trials in the NAC setting are increasingly being conducted to study new agents and novel therapeutic strategies in breast cancer using patho-logical complete response (pCR), a surrogate marker for survival, as the primary endpoint [5]. Several pathologic variables, such as invasive ductal carcinoma, high tumor grade and high proliferative activity, are associated with a better response to NAC [6-8]. Classifying breast can-cers into molecular subtypes has significantly improved the understanding of preoperative chemotherapy out-comes and has helped guide the selection of treatment [9-11]. Recent studies have established that breast can-cers that are basal-like or“triple-negative” (estrogen re-ceptor–negative (ER−), progesterone receptor–negative (PR−) and human epidermal growth factor receptor 2–negative (HER2−)) respond best to cytotoxic therapies [11,12] and that HER2-positive (HER2+) tumors respond best to trastuzumab-based regimens [13]. In particular, in HER2+ breast cancer, the NAC approach has yielded great successes. The dual HER2 blockade with trastu-zumab and pertutrastu-zumab recently has shown the highest pCR rates ever reported [3]. The NAC approach has yielded much higher rates of pCR in patients with triple-negative breast cancers than for patients with other breast tumor types. However, more than half of triple-negative breast cancer patients do not achieve a pCR and have a very poor prognosis [14]. Current studies are focused on identifying molecular subtypes of triple-negative tumors and their clinical relevancy by deter-mining pCR rates after NAC [15,16]. Recent studies have also shown that luminal A subtype tumors (ER + and HER2− and low tumor grade or low-proliferative phe-notype) exhibit lower sensitivity to standard cytotoxic-based regimens [17].
Nomograms, which integrate clinical and pathological variables including tumor receptors and number of che-motherapy courses using multiple logistic regression model, have been developed to predict complete pa-thological response on the basis of preoperative treat-ment [18-20]. However, reliable individualized prediction of a pathological complete response after preoperative chemotherapy based on conventional pathologic tumor characteristics determined before the start of treatment is difficult, and the response to chemotherapy varies among patients [21,22].
In the past decade, optical tomography and optical spec-troscopy using near-infrared (NIR) diffused light has de-monstrated great potential in the assessment of the tumor vasculature response to NAC [23-30]. The NIR technique utilizes intrinsic hemoglobin contrast, which is directly re-lated to tumor angiogenesis, a key process required for tumor growth and metastasis. In our recent paper pub-lished in Radiology [30], we demonstrated, for the first time to our knowledge, that the baseline pretreatment total hemoglobin (tHb), oxygenated hemoglobin (oxyHb) and deoxygenated hemoglobin (deoxyHb) levels were significantly higher in the tumors with near-complete or complete pathologic response than they were in the tu-mors with modest or no response to NAC. These mea-surements are directly related to tumor blood volume, perfusion, metabolism and tumor vasculature characteris-tics. Our new finding suggests that hypervascular tumors respond to NAC significantly better than hypovascular tumors do. In a recent study in which diffuse optical spectroscopy was used, Uedaet al. reported that the pre-treatment tumor oxygen saturation = oxyHb/tHb × 100 correlated with pathological complete response for pa-tients undergoing NAC [31]. To the best of our know-ledge, our study and theirs are the only published ones in which prediction of NAC on the basis of pretreatment hemoglobin measurements has been described. Water has previously been reported to be sensitive to cell death, and its reduction may reflect a progressive loss of tumor cellu-larity and edema for at least 1 week [23,32] or for 4 weeks [27] after initiation of NAC. Lipid and scatter measuring tumor tissue structure have not been reported as early pre-dictors after the initiation of NAC, because more time may be needed before tumor size changes are detectable [23].
In this article, we introduce a novel prediction model using a multiple logistic regression model by incorpo-rating widely used tumor pathologic variables of tumor type, grade and mitotic index, tumor receptors (triple-negative, HER2+ versus HER2−, ER−versus ER2+) and pretreatment functional parameters of tHb, oxyHb and deoxyHb. We assess the contributions of the hemoglobin functional parameters on improving the prediction sensi-tivity, specificity, positive predictive value (PPV), negative predictive value (NPV) and area under the receiving ope-rating characteristic (ROC) curve (AUC), and we compare these measures with and without those obtained from conventional tumor pathologic characteristics.
Methods Patients
and is HIPAA-compliant (the Health Insurance Portability and Accountability Act). Written informed consent was obtained from all patients. Details of the patient study were reported previously [30]. Briefly, 32 patients who were treated with neoadjuvant chemotherapy were assessed pre-treatment, at the end of each treatment cycle and prior to surgery using ultrasound-guided near-infrared optical to-mography (US-NIR). Two more patients who completed the same study procedures and excluded in the previous report [30] were included in this study because the present study is focused on assessing pretreatment prediction. One patient had an inflammatory breast cancer with very low measurable vascular content throughout the treatment, and the other was an elderly patient treated differently from the rest. Patients’ tumor types, grades (Nottingham score), mitotic index scores and receptor status of ER, PR and HER2 obtained at core biopsy are summarized in Table 1 with the two patients discussed above listed at the bottom of the table.
The 34 total patients (mean age, 48 years; range, 32 to 82 years) were initially split into a training group of 23 pa-tients with a total of 24 tumors enrolled into this study during the first 3 years of the recruitment period and a testing group of 11 patients with a total of 12 tumors. Of these latter 11 patients, 9 patients were enrolled in the last 7 months of the recruitment period and two more were enrolled as discussed in the paragraph above. Thus, two-thirds of the patients are being used for training and one-third for testing. Owing to the small patient sample, especially the limited numbers of triple-negative tumors (n= 6), HER2+ tumors (n= 6) and invasive lobular carcin-omas (ILCs) (n= 5), we performed cross-validation by ran-domly splitting the six triple-negative tumors, six HER2+ tumors and five ILCs between training and testing data sets while keeping approximately two-thirds of the samples of each subcategory in the training data sets. So, 24 pairs of training and testing data sets were generated. Additionally, the rest of the patients were randomly split into training and testing data sets to generate six more pairs of training and testing data sets while keeping approximately a similar percentage (30% to 50%) of patients who achieved a complete or nearly complete response to NAC in each pair of training and testing data sets. Thus, a total of 30 pairs of training and testing data sets were generated to train, valid-ate and compare the prediction models.
Among the 34 patients, 28 HER2- patients were treated with paclitaxel-based regimens (dose-dense doxorubicin/ cyclophosphamide/paclitaxel, docetaxel/cyclophosphamide, doxorubicin/cyclophosphamide/docetaxel, and bevaci-zumab), and 6 HER2+ patients were treated with a trastuzumab-based regimen (docetaxel/carboplatin with trastuzumab). The final pathologic response was assessed using the Miller-Payne grading system [33], in which pathologic response is divided into five grades based on
comparison of tumor cellularity between pre-neoadjuvant core biopsy and definitive surgical specimen. The Miller-Payne grading system is as follows:
Grade 1: no change or some minor alteration in individual malignant cells, but no reduction in overall cellularity
Grade 2: a minor loss of tumor cells, but overall high cellularity; up to 30% reduction of cellularity Grade 3: between an estimated 30% and 90%
reduction in tumor cellularity
Grade 4: a marked disappearance of more than 90% of tumor cells such that only small clusters or widely dispersed individual cells remain (almost pCR)
Grade 5: no invasive malignant cells identifiable in sections from the site of the tumor (pCR)
For this study, the Miller-Payne grades 4 and 5 patients were grouped as responders and grades 1 to 3 were groups as nonresponders. There were a total of 21 grades 1 to 3 tumors and 15 grade 4 or 5 tumors with a response rate of 42%.
Hemoglobin parameters
The imager consisted of a handheld probe with nine source fibers and ten detection light guides deployed around a commercial US probe. The US images were used to localize the tumor and were acquired simul-taneously with the NIR data. For each patient, tumor ab-sorption maps obtained at four optical wavelengths of 740, 780, 808 and 830 nm were reconstructed. From the absorption maps, the tHb, deoxyHb and oxyHb maps were calculated and the maximum tHb, deoxyHb and oxyHB concentrations were measured. Several quality NIR images at the tumor location were used to compute the average maximum tHb, deoxyHb and oxyHB values, which were used to characterize each tumor as reported elsewhere [30]. From phantom studies, we found that the reconstructed maximum value closely represented the true target value.
Statistical analysis and prediction model
Table 2 Statistical analysis of Miller-Payne grades compared with pretreatment variablesa
Maximum tHb Maximum oxyHb Maximum deoxyHb Tumor type NS MC/10 hpf Triple-negative HER2 ER
Spearman’sρ 0.520 0.455 0.395 0.408 0.545 0.538 0.261 0.305 0.375
P-value 0.001 0.005 0.017 0.013 0.001 0.001 0.124 0.070 0.024
a
[image:4.595.56.541.676.717.2]deoxyHb, Deoxygenated hemoglobin; ER, Estrogen receptor; HER2, Human epidermal growth factor receptor 2; hpf, High-power fields; MC, Mitotic count; NS, Nottingham score; oxyHb, Oxygenated hemoglobin; tHb, Total hemoglobin.
Table 1 Patient demographicsa
Age, yr Tumor type (IDC, 1) (IDC/ILC, 1) (ILC, 0 )
Nottingham score (out of 9)
Mitotic count/10 hpf
Triple-negative (+, 1) (−, 0)
HER2 (+, 1) (−, 0)
ER (+, 0) (−, 1) Miller-Payne grade
32 1 9 20 0 0 0 2
51 1 8 8 0 0 0 2
42 1 8 8 1 0 1 5
64 1 9 34 1 0 1 5
48 1 4 0 1 0 1 3
34 1 6 2 0 0 0 1
39 0 7 1 0 0 0 2
48 1 5 6 0 0 0 1
39 1 9 14 1 0 1 1
42 0 3 0 0 0 0 1
35 1 9 39 0 0 0 4
40 1 4 2 0 0 0 2
47 1 9 15 0 0 0 5
53 0 6 0 or 1 0 0 0 2
32 1 9 16 0 1 1 4
64 1 6 4 0 1 1 4
40 1 9 30 0 1 0 3
38 1 7 9 0 1 0 4
64 1 8 44 0 0 0 2
48 0 6 1 0 0 0 2
69 1 7 16 0 0 0 3
82 1 6 0 0 0 0 1
47b 1 8 10 0 0 0 5
38 1 9 20 1 0 1 5
49 1 6 8 0 0 0 3
63b 1 8 10 0 0 0 3
37 1 7 8 0 0 0 4
55 1 7 10 0 1 0 5
44 1 6 5 0 0 0 3
53 1 9 58 1 0 1 5
54 1 9 26 0 0 1 5
42 0 6 5 0 0 0 2
77 1 9 16 0 1 0 5
35 1 6 4 0 0 0 3
a
ER, Estrogen receptor; HER2, Human epidermal growth factor receptor 2; hpf, High-power fields; IDC, Invasive ductal carcinoma; IDC/ILC, Invasive mammary carcinoma with mixed ductal and lobular features; ILC, Invasive lobular carcinoma.b
HER2 and ER tumor status was coded as 1 for triple-negative and 0 for otherwise, 1 for HER2+ and 0 for HER2−, and 0 for ER+ and 1 for ER−. Spearman’s cor-relation calculations were performed using Minitab 15 software (Minitab, State College, PA, USA), and the re-sults are given in Table 2.
Logistic regression is a statistical modeling approach that can be used to describe the relationship of several predictor variables, X1, X2, …Xk, to a dichotomous re-sponse variableY, whereYis coded as 1 (responder) or 0 (nonresponder) for its two possible categories [34]. The model can be written in a form that describes the probability of occurrence of one of the two possible out-comes ofYas follows:
prðY ¼ 1 j X1; X2; … XkÞ
¼ 1
1 þ exp − β0 þ Σk
n ¼ 1 βnXn
The estimated outputs (probability) for each set of predictor variables range from 0 to 1. The model be-longs to the class of generalized linear models based on the exponential distribution family. Given the data forY,
X1,X2,…Xk, the unknown parametersβn,n= 0, 1,…,k
can be estimated using the maximum likelihood method. In this article, we estimate and validate the 13 logistic
models and their prediction power using combinations of 12 sets of predictor variables of tumor characteristics (tumor type, Nottingham score and mitotic counts), tumor pathological variables (tumor characteristics and receptor status of triple-negative, HER2 and ER), five pairs of hemoglobin predictor variables of tHb, oxyHb and deoxyHb only, tHb and oxyHb (tHboxyHb), and tHb and deoxyHb (tHbdeoxyHb), without tumor patho-logical variables and with these variables. The MATLAB (version 2008a; MathWorks, Natick, MA, USA) logistic regression function glmfit was used to compute the coef-ficientsβn, wheren= 0, 1,…,k, and glmval was used to predict the response from these coefficients for the train-ing set. The same coefficients obtained from the traintrain-ing set were used to predict the response for the testing set.
[image:5.595.60.540.89.233.2]We also assess the overall performance of the pre-diction models through the ROC curves and the AUC for all training and testing sets. For this purpose, the estimated outputs ranging from 0 to 1 were inputted to the R console (version R 2.15.2; The R Project for Statis-tical Computing, Vienna, Austria), and the R open source software package pROC [35] was used in the R console to compute the ROC curve and AUC for each model using combined predictor variables. The 95% confidence inter-val (CI) of each AUC was obtained using 10,000 stratified bootstrap replicates, and the average CIs obtained from
Table 3 Statistical analysis of pretreatment hemoglobin parameters with tumor pathological variablesa
tHb oxyHb deoxyHb Tumor type NS MC/10 hpf Triple-negative HER2 ER
tHb 0.841 0.637 0.166 0.430 0.206 0.108 0.144 0.312
P< 0.001 P< 0.001 P= 0.333 P= 0.009 P= 0.229 P= 0.532 P= 0.404 P= 0.064
oxyHb 0.302 0.066 0.234 0.005 0.115 0.108 0.330
P= 0.074 P= 0.703 P= 0.170 P= 0.979 P= 0.505 P= 0.532 P= 0.049
deoxyHb 0.050 0.356 0.292 0.093 0.086 0.275
P= 0.771 P= 0.033 P= 0.084 P= 0.589 P= 0.618 P= 0.105
a
deoxyHb, Deoxygenated hemoglobin; ER, Estrogen receptor; HER2, Human epidermal growth factor receptor 2; hpf, High-power field; MC, Mitotic count; NS, Nottingham score; oxyHb, Oxygenated hemoglobin; tHb, Total hemoglobin.
[image:5.595.57.539.617.716.2]the training and testing groups were computed. A thresh-old of 0.5 was used to separate responders (>0.5) from nonresponders (≤0.5) for each prediction model output and prediction sensitivity, specificity, PPV and NPV were calculated accordingly. In Minitab 15, a sample, two-sidedt-test was used to calculate the statistical significance of differences in the sensitivity, specificity, PPV, NPV and AUC of different models.P<0.05 was considered statisti-cally significant.
Results and discussion
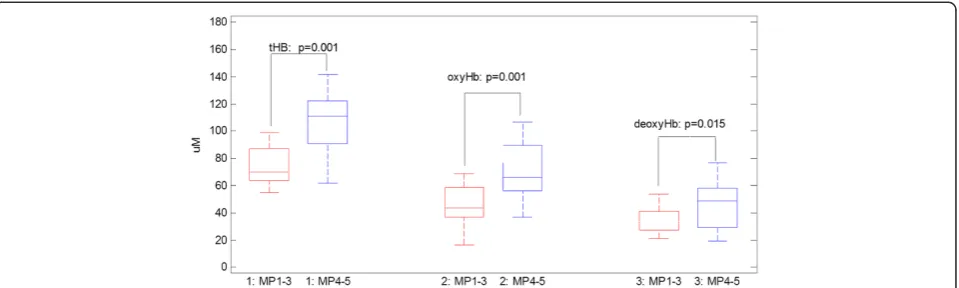
A box-and-whisker plot of pretreatment maximum tHb, oxyHb and deoxyHb values obtained from responder and
[image:6.595.61.538.256.654.2]nonresponder groups is shown in Figure 1. The corre-sponding mean values (SD) of pretreatment maximum tHb, oxyHb and deoxyHb values were 107.9 ± 33.2μmol/L, 70.3 ± 23.1 μmol/L and 46.5 ± 17.6 μmol/L, respectively, for responders. The corresponding values were 72.8 ± 22.5 μmol/L, 45.5 ± 17.6 μmol/L and 34.1 ± 11.5 μmol/L for nonresponders (P= 0.001,P= 0.001 andP= 0.017, re-spectively) (Figure 1). The Spearman’s correlation coeffi-cients of these parameters with Miller-Payne grades are summarized in Table 2. The maximum tHb, deoxyHb and oxyHb values correlate well with the final pathological re-sponse. Correlation coefficients of the other pathological predictor variables with Miller-Payne grades are also
summarized in Table 2. As shown in the table, tumor type, Nottingham score, mitotic count and ER status corre-late well with the final pathological response, and the triple-negative and HER2+ tumors also show reasonable correlation with the final pathological response. Patient age was not correlated with the Miller-Payne grade (Spearman’sρ= 0.127,P = 0.473) and was not used as a predictor variable.
The Spearman’s correlation coefficients between pre-treatment hemoglobin parameters and tumor pathological variables are given in Table 3. It is interesting to note that tHb and deoxyHb correlate well with tumor Nottingham score (P= 0.009 andP= 0.033, respectively) and that tHb and oxyHb show a moderate negative correlation with tumor ER expression (P = 0.064 and P = 0.049, respec-tively). Note that ER+ was coded as 0, and ER−was coded as 1. These results suggest that tumor hemoglobin levels estimated using the US-NIR imager measure the aggres-siveness of breast cancers.
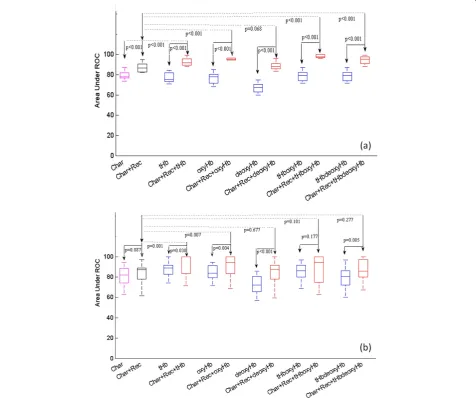
AUC statistics obtained from two sets of predictor vari-ables of tumor characteristics (tumor type, Nottingham score and mitotic count), tumor pathological variables (tumor characteristics and receptor status of triple-negative, HER2, ER) are shown in the first two columns of Figure 2. The horizontal axis indicates the predictor variables. On average, the addition of the tumor receptor status improves the AUC from 76.9% (95% CI, 59.5; 95.46) to 87.1% (95% CI, 71.54; 98.63) in the training data (P<0.001) (Figure 2a) and from 80.0% (95% CI, 51.11; 99.29) to 84.0% (95% CI, 57.16; 99.03) in the testing data (P = 0.087) (Figure 2b). Additionally, five pairs of hemoglobin predictor variables of tHb, oxyHb, deoxyHb, tHboxyHb and tHbdeoxyHb with-out tumor pathological variables and with these variables are shown in groups in Figure 2. The average percentage
AUCs of training and testing results, as well as average 95% CIs of all 12 prediction models using a different set of pre-dictor variables, are summarized in Tables 4 and 5. For training data shown in (Figure 2a), the addition of the tumor pathological variables to each set of hemoglobin pre-dictors significantly improves the AUC and tightens up the 95% CI as compared with data obtained without the patho-logical variables (P≤ 0.001). The AUCs obtained from the hemoglobin predictors with tumor pathological variables are significantly higher than those of the pathological vari-ables alone (P<0.001), except deoxyHb and deoxyHb with the tumor pathological variables pair (P= 0.068), which ap-proaches statistical significance. For the testing data shown in Figure 2b, the combined predictor set of tHb with tumor pathological variables and oxyHb with these variables out-perform tHb and oxyHb alone (P= 0.030 andP= 0.004, re-spectively) and pathological variables alone (P= 0.001 and
[image:7.595.57.542.516.708.2]P= 0.007, respectively). On average, the AUCs of tHb and oxyHb with tumor pathological variables are 92.4% (95% CI, 79.42; 99.80) and 90.6% (95% CI, 74.36; 99.35), respec-tively, as compared with 87.3% (95% CI, 62.13; 99.82) and 84.0% (95% CI, 56.01; 100), respectively, obtained without the pathological variables. Note that the 95% CI is much tighter with the addition of pathological variables. However, the other three sets of hemoglobin predictors combined with tumor pathological variables did not achieve statistical significance as compared with the tumor pathological va-riables alone. One reason is that tHb is correlated with oxyHb and deoxyHb (see Table 3). However, oxyHb and deoxyHb are independent variables. Because the signal-to-noise ratio of estimated tHb and oxyHb is much higher than that of deoxyHb, the tHb and oxyHb pair and tHb and deoxyHb pair are more robust predictors than the oxyHb and deoxyHb pair and are used with and without
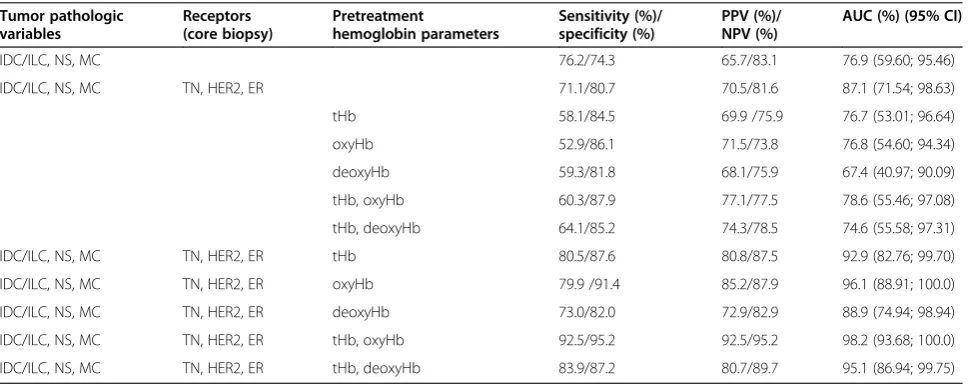
Table 4 Training data set resultsa
Tumor pathologic variables
Receptors (core biopsy)
Pretreatment
hemoglobin parameters
Sensitivity (%)/ specificity (%)
PPV (%)/ NPV (%)
AUC (%) (95% CI)
IDC/ILC, NS, MC 76.2/74.3 65.7/83.1 76.9 (59.60; 95.46)
IDC/ILC, NS, MC TN, HER2, ER 71.1/80.7 70.5/81.6 87.1 (71.54; 98.63)
tHb 58.1/84.5 69.9 /75.9 76.7 (53.01; 96.64)
oxyHb 52.9/86.1 71.5/73.8 76.8 (54.60; 94.34)
deoxyHb 59.3/81.8 68.1/75.9 67.4 (40.97; 90.09)
tHb, oxyHb 60.3/87.9 77.1/77.5 78.6 (55.46; 97.08)
tHb, deoxyHb 64.1/85.2 74.3/78.5 74.6 (55.58; 97.31)
IDC/ILC, NS, MC TN, HER2, ER tHb 80.5/87.6 80.8/87.5 92.9 (82.76; 99.70)
IDC/ILC, NS, MC TN, HER2, ER oxyHb 79.9 /91.4 85.2/87.9 96.1 (88.91; 100.0)
IDC/ILC, NS, MC TN, HER2, ER deoxyHb 73.0/82.0 72.9/82.9 88.9 (74.94; 98.94)
IDC/ILC, NS, MC TN, HER2, ER tHb, oxyHb 92.5/95.2 92.5/95.2 98.2 (93.68; 100.0)
IDC/ILC, NS, MC TN, HER2, ER tHb, deoxyHb 83.9/87.2 80.7/89.7 95.1 (86.94; 99.75)
a
pathological variables as predictors for analysis. Both sets of the tHb and oxyHb pair and the tHb and deoxyHb pair contain information about tumor oxygenated and deo-xygenated blood distributions. The combined predictor deoxyHb with tumor pathological variables performs bet-ter than deoxyHb alone (P <0.001). The validation data suggest that the combined predictor variables of tHb or oxyHb with tumor pathological variables are strong pre-dictors of a patient’s final pathological response and are more informative than the other three sets of combined predictors.
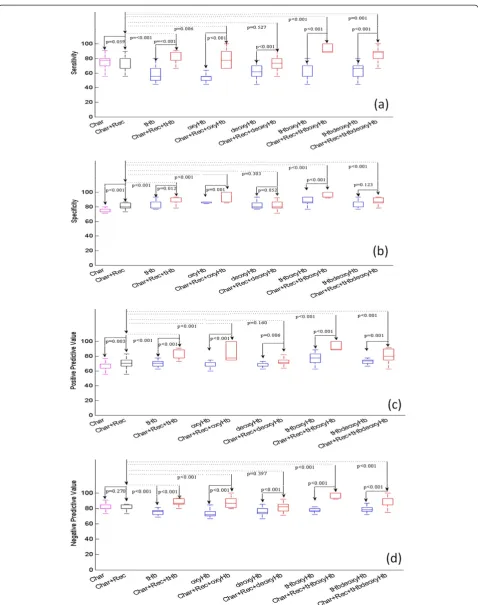
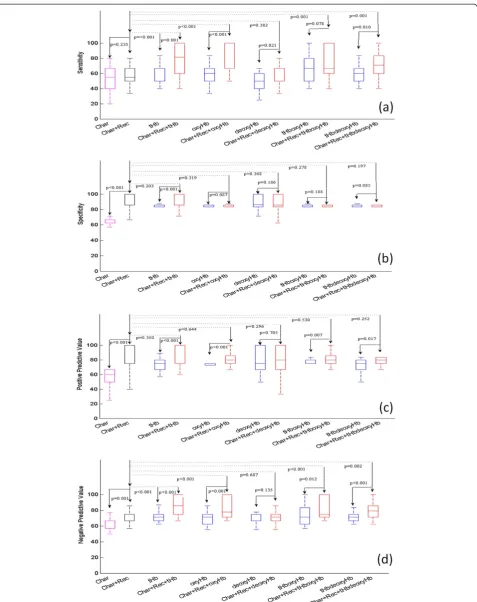
Statistics of prediction sensitivity, specificity, PPV and NPV obtained from two sets of predictor variables of tumor characteristics, tumor pathological variables and five pairs of hemoglobin predictor variables without and with tumor pathological variables are shown in Figure 3 (training) and Figure 4 (testing), respectively. For the training data shown in Figure 3 and Table 4, three pairs of hemoglobin predictors of tHb, oxyHb, tHboxyHb com-bined with tumor pathological variables significantly im-prove prediction sensitivity, specificity, PPV and NPV as compared with corresponding hemoglobin predictors alone (P≤0.012) and tumor pathological variables alone (P≤0.006). deoxyHb combined with pathological variables does not improve the performance of these measures as compared with tumor pathological variables alone; tHbdeoxyHb combined with pathological variables does not improve specificity, but it does improve the other three measures. For the testing data shown in Figure 4 and Table 5, all hemoglobin predictors, except deoxyHb, combined with pathological variables significantly improve the prediction sensitivity and NPV as compared with tumor pathological variables alone (P≤ 0.05). On average, the sensitivity and NPV of tHb, oxyHb, tHboxyHb,
tHbdeoxyHb are 78.7% (P<0.001), 76.9% (P<0.001), 73.2% (P= 0.001), 71.5% (P = 0.001) and 93.6% (P<0.001), and 85.2% (P<0.001), 84.9% (P<0.001) and 84.3% (P= 0.002), respectively, as compared with 56.8% and 70.9% obtained from pathological variables alone. However, no statistically significant improvement is achieved in specificity and PPV as compared with prediction using tumor pathological variables alone. In general, all hemoglobin predictors combined with pathological variables perform better than hemoglobin predictors alone, except deoxyHb. tHb com-bined with the pathological variables is the best predictor, with an average 79% sensitivity, 94% specificity, 90% PPV and 86% NPV. The second best predictor is oxyHb combined with pathological variables, with corresponding measures of 77%, 85%, 83% and 83%, respectively.
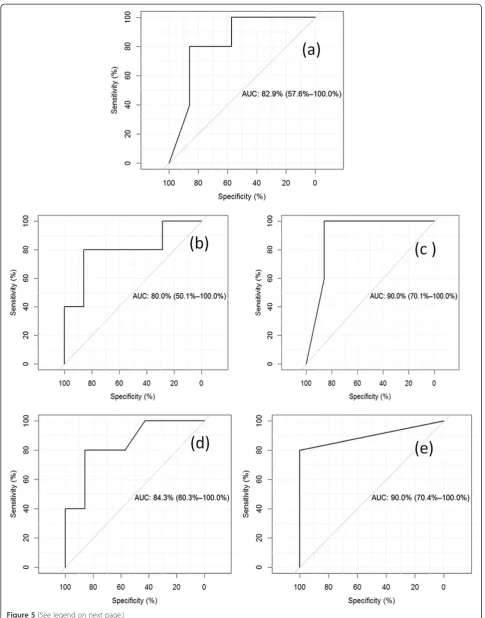
Taken together, our findings based on AUC, sensitivity, specificity, PPV and NPV support the hypothesis that tHb and oxyHb combined with tumor pathological variables are strong pretreatment predictors of patient final patho-logical response. Figure 5 shows a typical example of ROC curves obtained from tumor pathological variables only (Figure 5a), tHb without pathological variables (Figure 5b) and tHb with pathological variables (Figure 5c), oxyHb without pathological variables (Figure 5d) and oxyHb with pathological variables. The AUC values computed by pROC are 82.9%, 80.0%, 90%, 84.3% and 90%, respectively. The 95% CI value is also given in each figure.
[image:8.595.58.539.99.292.2]Different breast cancers have different degrees of che-motherapy sensitivity. Conventionally used tumor his-topathological variables have been used to predict a patient’s pathological response. Immunohistochemistry results of ER, PR and HER2 status have been routinely evaluated in assisting and guiding the treatment selec-tion. High tumor grade, ER−, triple-negative and HER2+
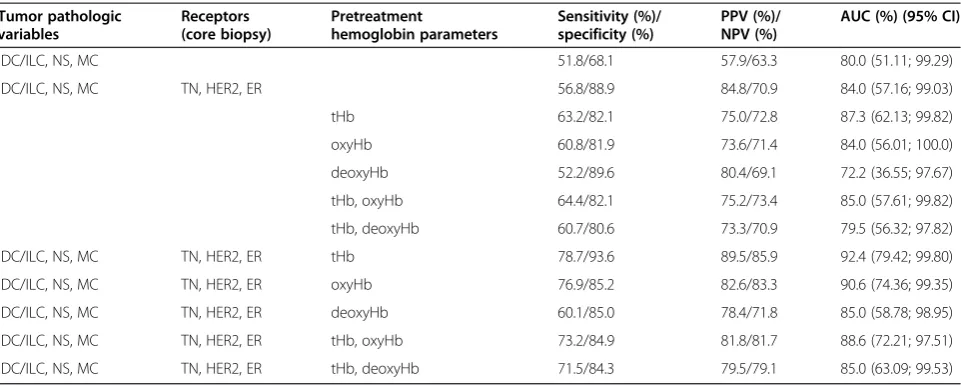
Table 5 Testing data set resultsa
Tumor pathologic variables
Receptors (core biopsy)
Pretreatment
hemoglobin parameters
Sensitivity (%)/ specificity (%)
PPV (%)/ NPV (%)
AUC (%) (95% CI)
IDC/ILC, NS, MC 51.8/68.1 57.9/63.3 80.0 (51.11; 99.29)
IDC/ILC, NS, MC TN, HER2, ER 56.8/88.9 84.8/70.9 84.0 (57.16; 99.03)
tHb 63.2/82.1 75.0/72.8 87.3 (62.13; 99.82)
oxyHb 60.8/81.9 73.6/71.4 84.0 (56.01; 100.0)
deoxyHb 52.2/89.6 80.4/69.1 72.2 (36.55; 97.67)
tHb, oxyHb 64.4/82.1 75.2/73.4 85.0 (57.61; 99.82)
tHb, deoxyHb 60.7/80.6 73.3/70.9 79.5 (56.32; 97.82)
IDC/ILC, NS, MC TN, HER2, ER tHb 78.7/93.6 89.5/85.9 92.4 (79.42; 99.80)
IDC/ILC, NS, MC TN, HER2, ER oxyHb 76.9/85.2 82.6/83.3 90.6 (74.36; 99.35)
IDC/ILC, NS, MC TN, HER2, ER deoxyHb 60.1/85.0 78.4/71.8 85.0 (58.78; 98.95)
IDC/ILC, NS, MC TN, HER2, ER tHb, oxyHb 73.2/84.9 81.8/81.7 88.6 (72.21; 97.51)
IDC/ILC, NS, MC TN, HER2, ER tHb, deoxyHb 71.5/84.3 79.5/79.1 85.0 (63.09; 99.53)
a
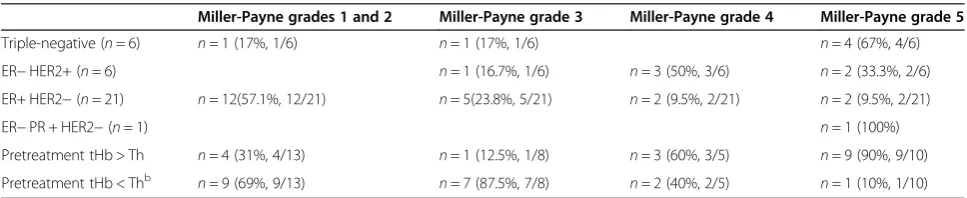
cancers have significantly higher rates of response to chemotherapy than other breast cancers. However, these models have always fallen short. Our data derived from 34 patients demonstrate that 67% of triple-negative tu-mors were Miller-Payne grade 5 and 83.3% of the HER2 + tumors were grade 4 or 5 (Table 6). On the basis of NIR pretreatment tHb level, we could predict responders with 80% accuracy for grades 4 and 5 tumors. It is known that ER+ tumors do not respond well to standard paclitaxel-based regimens. Our data show that 80.9% of the ER+ tumors were Miller-Payne grades 1 to 3. On the basis of NIR pretreatment tHb level, we could predict nonresponders with 69% accuracy for grades 1 and 2 tumors and 87.5% accuracy for grade 3 tumors (Table 6). This result is comparable to that based on receptor markers.
Our current study shows that when the pretreatment measurements of hemoglobin content are used together with histopathologic parameters as predictors in a multi-variable prediction model, a substantially improved esti-mation of patient treatment outcome, especially prediction sensitivity and NPV, is obtained.
Ueda et al., using a diffuse optical spectroscopy technique, found that the pretreatment tumor oxygen saturation correlates with pathological complete
re-sponse for patients undergoing NAC [31]. Our
hemoglobin parameters were estimated from max-imum values of US-guided tomographic images with spatial and depth distributions. In tomography, oxy-gen saturation = oxyHb/tHb × 100% can be obtained pixel by pixel using tHb as a denominator, and it is not robust for pixels with small tHb values. There-fore, we did not compute oxygen saturation directly; however, we show in Figure 1 that pretreatment tHb, oxyHb, deoxyHb predict responders from nonre-sponders with statistical significance.
ER−cancers are typically high-grade and more aggres-sive. Our study shows that tHb and oxyHb inversely cor-relate with ER expression. A cor-related study was reported by Koukourakis et al., who found an inverse association of microvascular density with ER expression [36]. In another study [37], Fuckar et al. reported a negative correlation between vascular endothelial growth factor expression and ER status. These ER−negative tumors were cha-racterized by higher proliferative activity. The precise mechanisms for oncogenic and angiogenic activities in ER−breast cancer are not fully understood [38].
This study has limitations. First, the patient sample is small, in particular the ILC, HER2+ and triple-negative tumor cases. A large sample size would make the logistic regression results more reliable because of the increased number of observations in each case and thus the in-creased accuracy in estimation of regression parameters and improved prediction. However, the predictive values of ILC, HER2+ and triple-negative tumors for NAC are well-documented in the literature, and the new know-ledge reported in this study is the improved prediction of NAC by addition of hemoglobin parameters. Overfit-ting could occur when three hemoglobin predictors, as well as pretreatment optical scatter data, in addition to tumor pathological variables were used as predictor vari-ables to fit a limited set of training data points. As a re-sult, the model memorizes the training data and is less robust to generalize to an independent testing set. Cur-rently, a larger-scale patient study is being designed to validate the initial results reported in this article. More data could allow robust estimation and validation of additional predictor variables, such as pretreatment op-tical scatter data and new biomarkers. Once validated with a larger patient pool, it may serve as a benchmark for preoperative chemotherapy prediction and also for integrating newly discovered molecular markers and
(See figure on previous page.)
[image:12.595.56.540.617.716.2]Figure 5Typical example of receiver operating characteristic curves obtained with pathological variables. (a)Receiver operating characteristic curve (ROC) obtained from tumor pathological variables only.(b)ROC obtained from tumor tHb only.(c)ROC obtained from tHb with pathological variables.(d)ROC obtained from oxyHb only.(e)ROC obtained from oxyHb. The 95% confidence interval is also given in each figure.
Table 6 Distributions of tumor receptor status and tumor responses based on Miller-Payne gradesa
Miller-Payne grades 1 and 2 Miller-Payne grade 3 Miller-Payne grade 4 Miller-Payne grade 5
Triple-negative (n= 6) n= 1 (17%, 1/6) n= 1 (17%, 1/6) n= 4 (67%, 4/6)
ER−HER2+ (n= 6) n= 1 (16.7%, 1/6) n= 3 (50%, 3/6) n= 2 (33.3%, 2/6)
ER+ HER2−(n= 21) n= 12(57.1%, 12/21) n= 5(23.8%, 5/21) n= 2 (9.5%, 2/21) n= 2 (9.5%, 2/21)
ER−PR + HER2−(n= 1) n= 1 (100%)
Pretreatment tHb > Th n= 4 (31%, 4/13) n= 1 (12.5%, 1/8) n= 3 (60%, 3/5) n= 9 (90%, 9/10)
Pretreatment tHb < Thb n= 9 (69%, 9/13) n= 7 (87.5%, 7/8) n= 2 (40%, 2/5) n= 1 (10%, 1/10)
a
ER, Estrogen receptor; HER2, Human epidermal growth factor receptor 2; tHb, Total hemoglobin.b
guiding tailored therapy. Second, patients in the study were treated with standard chemotherapy regimens, in-cluding anthracyclines, taxanes and trastuzumab. The applicability of the prediction model to novel targeted agents remains to be tested in future clinical trials.
Conclusions
As demonstrated by ROC analysis on testing data, tumor pathologic predictor variables achieved an average pre-diction sensitivity of 56.8%, specificity of 88.9%, PPV of 84.8%, NPV of 70.9% and AUC of 84.0%. tHb combined with the tumor pathological variables is the best predictor, with corresponding measures of 79%, 94%, 90%, 86% and 92.4%. oxyHb combined with pathological variables is the second best predictor, with corresponding measures of 77%, 85%, 83%, 83% and 90.6%. The addition of tHb or oxyHb significantly improves the prediction sensitivity, NPV and AUC as compared with using tumor patho-logical variables alone. Our initial data indicate that combining widely used breast tumor pathologic variables with novel tumor functional parameters of hemoglobin (assessed by using a US-NIR technique) as predictor vari-ables may provide a powerful tool for predicting patient pathological response before the initiation of neoadjuvant chemotherapy.
Abbreviations
AUC:Area under receiving operating characteristic curve;
deoxyHb: Deoxygenated hemoglobin; ER: Estrogen receptor; HER2: Human epidermal growth factor receptor 2; NAC: Neoadjuvant chemotherapy; NPV: Negative predictive value; oxyHb: Oxygenated hemoglobin; PPV: Positive predictive value; PR: Progesterone receptor; ROC: Receiving operating characteristic curve; tHb: Total hemoglobin; TN: Triple-negative.
Competing interests
QZ is the inventor of the patents related to the ultrasound-guided near-infrared technology and the patents owned by the University of Connecticut.
Authors’contributions
QZ designed and conducted all aspects of the ultrasound-guided tomography data acquisition, image reconstruction and data analysis and contributed to manuscript preparation. LW contributed to the statistical analysis and manuscript preparation. ST recruited neoadjuvant chemotherapy patients at the University of Connecticut Health Center, coordinated oncological aspects of the study and contributed to manuscript preparation. AR assessed and interpreted all histopathologic data of the breast tissue samples of patients recruited from Hartford Hospital and contributed to manuscript preparation. PD recruited neoadjuvant chemotherapy patients at Hartford Hospital and coordinated oncological aspects of the study. PH assessed and interpreted all histopathologic data of the breast tissue samples of patients recruited from the University of Connecticut Health Canter. All authors read and approved the final manuscript.
Acknowledgements
The authors are grateful for the financial support of this work from the National Institutes of Health (grant R01 EB002136) and the Natural Sciences and Engineering Research Council of Canada. The authors also thank the anonymous reviewers for their valuable suggestions and comments, which significantly improved the manuscript.
Author details 1
Biomedical Engineering and Electrical and Computer Engineering Departments, University of Connecticut, 371 Fairfield Road, U2157, Storrs, CT
06269, USA.2Department of Statistics, University of Manitoba, 186 Dysart Road, Winnipeg, MB R3T 2N2, Canada.3Clinical and Translational Breast Program, University of Connecticut Health Center, 263 Farmington Avenue, Farmington, CT 06030, USA.4Department of Pathology, Hartford Hospital, 80 Seymour Street, Hartford, CT 06106, USA.5Helen & Harry Gray Cancer Center, Hartford Hospital, 80 Seymour Street, Hartford, CT 06106, USA.
Received: 23 June 2013 Accepted: 6 October 2014
References
1. Fisher B, Brown A, Mamounas E, Wieand S, Robidoux A, Margolese RG, Cruz AB Jr, Fisher ER, Wickerham DL, Wolmark N, DeCillis A, Hoehn JL, Lees AW, Dimitrov NV:Effect of preoperative chemotherapy on local-regional disease in women with operable breast cancer: findings from National Surgical Adjuvant Breast and Bowel Project B-18.J Clin Oncol1997,
15:2483–2493.
2. Wolmark N, Wang J, Mamounas E, Bryant J, Fisher B:Preoperative chemotherapy in patients with operable breast cancer: nine-year results from National Surgical Adjuvant Breast and Bowel Project B-18.J Natl Cancer Inst Monogr2001,30:96–102.
3. Gampenrieder SP, Rinnerthaler G, Greil R:Neoadjuvant chemotherapy and targeted therapy in breast cancer: past, present, and future.J Oncol2013,
2013:732047.
4. Rastogi P, Anderson SJ, Bear HD, Geyer CE, Kahlenberg MS, Robidoux A, Margolese RG, Hoehn JL, Vogel VG, Dakhil SR, Tamkus D, King KM, Pajon ER, Wright MJ, Robert J, Paik S, Mamounas EP, Wolmark N:Preoperative chemotherapy: updates of National Surgical Adjuvant Breast and Bowel Project Protocols B-18 and B-27. J Clin Oncol 2008, 26:778–785. A published erratum appears in.J Clin Oncol2008,26:2793.
5. Bardia A, Baselga J:Neoadjuvant therapy as a platform for drug development and approval in breast cancer.Clin Cancer Res2013,
19:6360–6370.
6. Rakha EA, Ellis IO:An overview of assessment of prognostic and predictive factors in breast cancer needle core biopsy specimens.J Clin Pathol2007,60:1300–1306.
7. Pinder SE, Murray S, Ellis IO, Trihia H, Elston CW, Gelber RD, Goldhirsch A, Lindtner J, Cortés-Funes H, Simoncini E, Byrne MJ, Golouh R, Rudenstam CM, Castiglione-Gertsch M, Gusterson BA:The importance of the histologic grade of invasive breast carcinoma and response to chemotherapy.
Cancer1998,83:1529–1539.
8. Denley H, Pinder SE, Elston CW, Lee AH, Ellis IO:Preoperative assessment of prognostic factors in breast cancer.J Clin Pathol2001,54:20–24. 9. Sørlie T, Perou CM, Tibshirani R, Aas T, Geisler S, Johnsen H, Hastie T, Eisen
MB, van de Rijn M, Jeffrey SS, Thorsen T, Quist H, Matese JC, Brown PO, Botstein D, Lønning PE, Børresen-Dale AL:Gene expression patterns of breast carcinomas distinguish tumor subclasses with clinical implications.Proc Natl Acad Sci U S A2001,98:10869–10874.
10. Sotiriou C, Neo SY, McShane LM, Korn EL, Long PM, Jazaeri A, Martiat P, Fox SB, Harris AL, Liu ET:Breast cancer classification and prognosis based on gene expression profiles from a population-based study.Proc Natl Acad Sci U S A2003,100:10393–10398.
11. Rouzier R, Perou CM, Symmans WF, Ibrahim N, Cristofanilli M, Anderson K, Hess KR, Stec J, Ayers M, Wagner P, Morandi P, Fan C, Rabiul I, Ross JS, Hortobagyi GN, Pusztai L:Breast cancer molecular subtypes respond differently to preoperative chemotherapy.Clin Cancer Res2005,
11:5678–5685.
12. Venkitaraman R:Triple-negative/basal-like breast cancer: clinical, pathologic and molecular features.Expert Rev Anticancer Ther2010,
10:199–207.
13. Chang HR:Trastuzumab-based neoadjuvant therapy in patients with HER2-positive breast cancer.Cancer2010,116:2856–2867.
14. von Minckwitz G, Martin M:Neoadjuvant treatments for triple-negative breast cancer (TNBC).Ann Oncol2012,23:vi35–vi39.
15. Masuda H, Baggerly KA, Wang Y, Zhang Y, Gonzalez-Angulo AM, Meric-Bernstam F, Valero V, Lehmann BD, Pietenpol JA, Hortobagyi GN, Symmans WF, Ueno NT:Differential response to neoadjuvant chemotherapy among 7 triple-negative breast cancer molecular subtypes.Clin Cancer Res2013,
19:5533–5540.
17. Lips EH, Mulder L, de Ronde JJ, Mandjes IA, Vincent A, Vrancken Peeters MT, Nederlof PM, Wesseling J, Rodenhuis S:Neoadjuvant chemotherapy in ER + HER2−breast cancer: response prediction based on
immunohistochemical and molecular characteristics.Breast Cancer Res Treat2012,131:827–836.
18. Colleoni M, Bagnardi V, Rotmensz N, Viale G, Mastropasqua M, Veronesi P, Cardillo A, Torrisi R, Luini A, Goldhirsch A:A nomogram based on the expression of Ki-67, steroid hormone receptors status and number of chemotherapy courses to predict pathological complete remission after preoperative chemotherapy for breast cancer.Eur J Cancer2010,
46:2216–2224.
19. Rouzier R, Pusztai L, Delaloge S, Gonzalez-Angulo AM, Andre F, Hess KR, Buzdar AU, Garbay JR, Spielmann M, Mathieu MC, Symmans WF, Wagner P, Atallah D, Valero V, Berry DA, Hortobagyi GN:Nomograms to predict pathologic complete response and metastasis-free survival after preoperative chemotherapy for breast cancer.J Clin Oncol2005,
23:8331–8339.
20. Keam B, Im SA, Park S, Nam BH, Han SW, Oh DY, Kim JH, Lee SH, Han W, Kim DW, Kim TY, Park IA, Noh DY, Heo DS, Bang YJ:Nomogram predicting clinical outcomes in breast cancer patients treated with neoadjuvant chemotherapy.J Cancer Res Clin Oncol2011,137:1301–1308.
21. Frati A, Chereau E, Coutant C, Bezu C, Antoine M, Chopier J, Daraï E, Uzan S, Gligorov J, Rouzier R:Comparison of two nomograms to predict pathologic complete responses to neoadjuvant chemotherapy for breast cancer: evidence that HER2-positive tumors need specific predictors.
Breast Cancer Res Treat2012,132:601–607.
22. Colleoni M, Bagnardi V, Rotmensz N, Dellapasqua S, Viale G, Pruneri G, Veronesi P, Torrisi R, Luini A, Intra M, Galimberti V, Montagna E, Goldhirsch A:A risk score to predict disease-free survival in patients not achieving a pathological complete remission after preoperative chemotherapy for breast cancer.Ann Oncol2009,20:1178–1184.
23. Cerussi A, Hsiang D, Shah N, Mehta R, Durkin A, Butler J, Tromberg BJ:
Predicting response to breast cancer neoadjuvant chemotherapy using diffuse optical spectroscopy.Proc Natl Acad Sci U S A2007,104:4014–4019. 24. Choe R, Durduran T:Diffuse optical monitoring of the neoadjuvant breast
cancer therapy.IEEE J Sel Top Quantum Electron2012,18:1367–1386. 25. Zhu Q, Tannenbaum S, Hegde P, Kane M, Xu C, Kurtzman SH:Noninvasive
monitoring of breast cancer during neoadjuvant chemotherapy using optical tomography with ultrasound localization.Neoplasia2008,
10:1028–1040.
26. Jiang S, Pogue BW, Carpenter CM, Poplack SP, Wells WA, Kogel CA, Forero JA, Muffly LS, Schwartz GN, Paulsen KD, Kaufman PA:Evaluation of breast tumor response to neoadjuvant chemotherapy with tomographic diffuse optical spectroscopy: case studies of tumor region-of-interest changes.
Radiology2009,252:551–560.
27. Soliman H, Gunasekara A, Rycroft M, Zubovits J, Dent R, Spayne J, Yaffe MJ, Czarnota GJ:Functional imaging using diffuse optical spectroscopy of neoadjuvant chemotherapy response in women with locally advanced breast cancer.Clin Cancer Res2010,16:2605–2614.
28. Roblyer D, Ueda S, Cerussi A, Tanamai W, Durkin A, Mehta R, Hsiang D, Butler JA, McLaren C, Chen WP, Tromberg B:Optical imaging of breast cancer oxyhemoglobin flare correlates with neoadjuvant chemotherapy response one day after starting treatment.Proc Natl Acad Sci USA2011,
108:14626–14631.
29. Zhu Q, Kurtzman S, Hegde P, Tannenbaum S, Kane M, Huang MM, Chen NG, Jagjivan B, Zarfos K:Utilizing optical tomography with ultrasound localization to image heterogeneous hemoglobin distribution in large breast cancers.Neoplasia2005,7:263–270.
30. Zhu Q, DeFusco PA, Ricci A Jr, Cronin EB, Hegde PU, Kane M, Tavakoli B, Xu Y, Hart J, Tannenbaum SH:Breast cancer: assessing response to neoadjuvant chemotherapy by using US-guided near-infrared tomography.Radiology 2013,266:433–442.
31. Ueda S, Roblyer D, Cerussi A, Durkin A, Leproux A, Santoro Y, Xu S, O’Sullivan TD, Hsiang D, Mehta R, Butler J, Tromberg BJ:Baseline tumor oxygen saturation correlates with a pathologic complete response in breast cancer patients undergoing neoadjuvant chemotherapy.Cancer Res2012,72:4318–4328.
32. Falou O, Soliman H, Sadeghi-Naini A, Iradji S, Lemon-Wong S, Zubovits J, Spayne J, Dent R, Trudeau M, Boileau JF, Wright FC, Yaffe MJ, Czarnota GJ:
Diffuse optical spectroscopy evaluation of treatment response in women
with locally advanced breast cancer receiving neoadjuvant chemotherapy.
Transl Oncol2012,5:238–246.
33. Ogston KN, Miller ID, Payne S, Hutcheon AW, Sarkar TK, Smith I, Schofield A, Heys SD:A new histologic grading system to assess response of breast cancers to primary chemotherapy: prognostic significance and survival.
Breast2003,12:320–327.
34. Kleinbaum DG, Kupper LM, Muller KE, Nizam A:Applied Regression Analysis and Other Multivariable Methods.3rd edition. Independence, KY: Duxbury Press; 1998.
35. Robin X, Turck N, Hainard A, Tiberti N, Lisacek F, Sanchez JC, Müller M:
pROC: an open-source package for R and S + to analyze and compare ROC curves.BMC Bioinformatics2011,12:77.
36. Koukourakis MI, Manolas C, Minopoulos G, Giatromanolaki A, Sivridis E:
Angiogenesis relates to estrogen receptor negativity, c-erbB-2 overexpression and early relapse in node-negative ductal carcinoma of the breast.Int J Surg Pathol2003,11:29–34.
37. Fuckar D, DekanićA, Stifter S, MustaćE, Krstulja M, Dobrila F, JonjićN:VEGF expression is associated with negative estrogen receptor status in patients with breast cancer.Int J Surg Pathol2006,14:49–55. 38. Elkin M, Orgel A, Kleinman HK:An angiogenic switch in breast cancer
involves estrogen and soluble vascular endothelial growth factor receptor 1.J Natl Cancer Inst2004,96:875–878.
doi:10.1186/s13058-014-0456-0
Cite this article as:Zhuet al.:Pathologic response prediction to neoadjuvant chemotherapy utilizing pretreatment near-infrared imaging parameters and tumor pathologic criteria.Breast Cancer Research 201416:456.
Submit your next manuscript to BioMed Central and take full advantage of:
• Convenient online submission
• Thorough peer review
• No space constraints or color figure charges
• Immediate publication on acceptance
• Inclusion in PubMed, CAS, Scopus and Google Scholar
• Research which is freely available for redistribution