International Journal of Innovative Technology and Exploring Engineering (IJITEE) ISSN: 2278-3075, Volume-8 Issue-8S, June 2019
Abstract: Now a day’s research works on agriculture field have been widely incorporated and showing promising growth. The man free system for food processing unit like classification based on variety, quality and other aspect plays a crucial role in the agricultural research. This paper discuss about the seed classification based on multiple feature extraction and minimum distance classifier. Feature extraction is associated with spatial, color, shape, texture and statistical features of the seed. In this work rice, corn and wheat are used as test samples to demonstrate the effectiveness of the Connected Component Analysis and classification process.
Keywords: classification, rice, wheat, corn, feature extraction, minimum distance classifier.
I. INTRODUCTION
Plant weeds are known because the presence of a plant species in wrong place and time. Interference of weed species with plant crops might cause up to ninetieth loss of yield production. Among the assorted applied strategies for weed management, bar of weed seeds from beingness with fascinating crops‘ grains or seeds may be a reliable approach. In agriculture business, the identification and elimination of weed seeds are among the foremost determined factors. For invasive weeds, the identification of seeds through state agriculture quarantines is that the opening for consequent actions for exportation or importation of such exotic species. Among totally different seeds identification strategies supported sure morphological, textural and color options, visual mechanical approaches were with success applied for each plant and weed species seed recognition and identification. The application of machine vision is incredibly necessary in agricultural business. Seed analysis and classification will give additional information in their production, seeds internal control and in impurities identification. Usually these activities are performed by specialists by visually inspecting every sample, that may be a terribly tedious and time overwhelming task.
Revised Manuscript Received on May 22, 2019.
Surekha R, Research Scholar, Dr. M G R Educational and Research Institute
R.Shobarani, Professor, Dr. M G R Educational and Research Institute
G.Victo Sudha George, Professor, Dr. M G R Educational and Research Institute
So, automation is needed during this field. Now a day, pc vision technology is applied during a giant sort of fields to extend the potency of the work. So, this paper uses machine vision technique for the popularity side of the aforementioned problems.
II. RELATEDWORK
Early day‘s seed classifications have been carried out with the help of human beings which consumed a lot of time. And later many researchers worked out on seed classification process through image recognition system which are discussed below.
Classification of chickpea varieties with different performance of supervised and unsupervised neural network has been proposed by kaka, Piroz and Jam. They concluded that accuracy of classification with unsupervised method s high when compared with supervised classification method. Morphological features of chickpeas are taken in consideration for classification.
Brinkkemper computed shape and size features for classification. Also it has been followed by statistical analysis of the databases with QDA (Quadratic Discriminant Analysis) and stochastic Neighbor Embedding system. This system helped for seven different seed varieties.
Identification of wheat, rice and gram seeds using the technique CBIR[1] and ANN for feature extraction and classification respectively the authors have shown 95% of accuracy. Alireza Pazoki and Zohreh Pazoki [2] applied a MLP neural network with 2 hidden layers with six cultivars and shows 84-87% of accuracy. Shantaiya and Ansaria proposed a system for rice variety classification with neural network system with the help of color and morphological features. And this system gives about 84% of accuracy. Chen et al [3] proposed a classification system for China corn varieties with five types with an accuracy of 90%. Guevara-Hernandez and Gomez-Gil [4] classified wheat and barley kernels with KNN based on colour, texture and morphological feature and discriminant analysis which shown 90% accuracy.
P. Zapotoczny [5] proposed a system to classify 11 varieties of wheat with 90-95% accuracy, classification is made through geometric feature with the help of Meta Multi Class Classifier. Morphological and color feature of rangeland seed species resulted in % accuracy was proposed by Anvarkhah et al [6].
Seed Classification using Multi Feature
Extraction
Pandey et al [7] combined CBIR (content Based Image Retrieval) for recognition of seeds and classification with ANN and Euclidean distance. Resulted with 95% on ANN and 84.4% on Euclidean distance classifier. Pazoki [8] introduced MLP neural network and Neuro-Fuzzy methods for classification of five different corn seed varieties with accuracies of 94% for MLP neural network and 96% for Neuro- Fuzzy Neural Network. V. Sree Hari Rao[9] and M. Naresh Kumar predict the risk factors with an accuracy of 99.73% using PSO(Particle Swarm Optimization) technique.[10] Gang Liu, Li Yao, Xiaojie Zhao uses DT-MRI data acquisition method in image processing and shows higher accuracy. Olivier Salvado, Claudia Hillenbrand, Shaoxiang Zhang, and David L Wilson[11] used fuzzy logics and segmentation LEMS algorithm and provided greater accurarcy MRI. Suhas.S, C R Venugopal [12] presents a technique where both median and mean filtering are combined to remove noise and improves the accuracy of medical images. Comaniciu and P. Meer[13] The mean shift based feature space analysis technique using computer vision techniques .
III. METHODOLOGY
This paper explains about the classification of seed variety based on various feature extracted from the seed image. Grain Data and Image acquisition
Grains considered in this work for classification are rice, corn and wheat. These common grains used for house hold purpose. For image acquisition, grains are spread on a dark surface and images are captured through a high quality digital camera with 5Mega pixel quality. These images are used for further processing and classification. Classification is done using MATLAB2013b. Complete process is as follows. Gray scale conversion
Input image is converted from three planes (RGB image) to single plane image (Gray scale image). Input images obtained from MRI scans are in RGB format, which increases computation time, storage space, and complexity of coding. Hence Color conversion of input bio-medical image is performed. The color conversion is performed by taking average value of red, green and blue pixel values or by taking weighted sum of RGB pixels, e.g.: 0.4R + 0.39G + 0.21B. Image resizing
Image scaling refers to resizing of an image i.e. increasing or decreasing total count of pixels of the image.It also refers to varying the size of rows and columns to change the overall image matrix size.
Biomedical image processing needs images of fixed size to perform segmentation and analyze uniform results. Here, the paper performs scaling operation by simple method of nearest neighbor interpolation and decimation process.
like histogram equalization, Histogram stretching, image sharpening and many more process. Here we have used image adjustment with 0.5 threshold function for image enhancement.
Binary conversion
Final preprocessing step is binary conversion. Image binarization in is the processing of converting 8 bit pixel to logical value corresponding to the pixel present there. This process reduces the complexity of calculating morphological feature parameters. And this binary conversion is done with 0.3 as threshold in order to convert maximum data logical ‗0‘. Connected component analysis
CC analysis includes grouping connected data i.e. pixel together in order to analyze individual objects. It is done by scanning an image from top to bottom analyzing each pixel to group connected and similar pixels to form groups. Since input is a binary image this process groups all ‗1‘s together. This is to get each grain as an object. Follow area open function this eliminates broken grain and dusts. Also this acts a filter to eliminate unwanted objects from the image.
Area
Area refers to number of whitepixel ‗1‘ present in each object. It refers to number of pixels representing each seed. Major Axis Length (MAL)
It is Length of the seed which refers to the longest line connecting either side of the seed.
Minor Axis Length (mAL)
It is the width of the seed which refers to the shortest line connecting either side of the seed.
Eccentricity
It refers to the ratio of MAL and Foci of the seed data. Convex area
Total number of pixels that covers the convex hull is convex area of the object.
Filled area
Area of seed covered with ‗0‘ Equivalent diameter
Diameter of seed is calculated assuming seed area to be a circle.
Solidity
It is the ratio between seed area to its convex or concave area
Extent
International Journal of Innovative Technology and Exploring Engineering (IJITEE) ISSN: 2278-3075, Volume-8 Issue-8S, June 2019
Perimeter
Number of pixels connected to form the border of the seed Convex ratio
Convex ratio refers to the ratio between difference of convex area and seed area to the convex area
Circularity
Circularity is the ratio between seed area and its perimeter. Ellipse ratio
Ellipse ratio is the ratio between seed area and the product of MAL and mAL.
Circle Ratio
It is the ratio between seed area and MAL. Compactness
Compactness is the ratio between seed area and mAL. Aspect ratio
It is the ratio between MAL and mAL. Roundness
Roundness is the ratio between perimeter and seed area. Shape factors
There are four major shape factors
Ratio between MAL power of two to seed area
Ratio between seed area to MAL power of three.
Ratio between seed area to the mean of MAL power two
Ratio between seed area to the product of mean MAL power two and mean mAL power two.
Elongation
Ratio between mAL and MALMean, Median, Standard Deviation, Covariance, Skewness, Kurtosis, and Moment has been calculated for the gray scale image. All the above features are calculated for multiple set of input images of grains and database is formed. Thus the same process is followed for query image.
Finally Euclidian distance classifier has been used for classification with the above features
Euclidian Distance classifier
Euclidean distance is the distance calculated between features of query image and database. And it is calculated through the formula
𝑬𝒖𝒄𝒍𝒊𝒅𝒊𝒂𝒏 𝑫𝒊𝒔𝒕𝒂𝒏𝒄𝒆 = (𝒙 𝒊, 𝒋 − 𝒚(𝒊, 𝒋))𝟐
[image:3.612.335.539.60.243.2]IV. RESULT ANALYSIS
Fig. 1 Output of various stages of Image preprocessing In Figure1, Output of various stages of preprocessing is shown. Those are input image, gray scale image, enhanced image, binary image, binary image filtered with area open function.
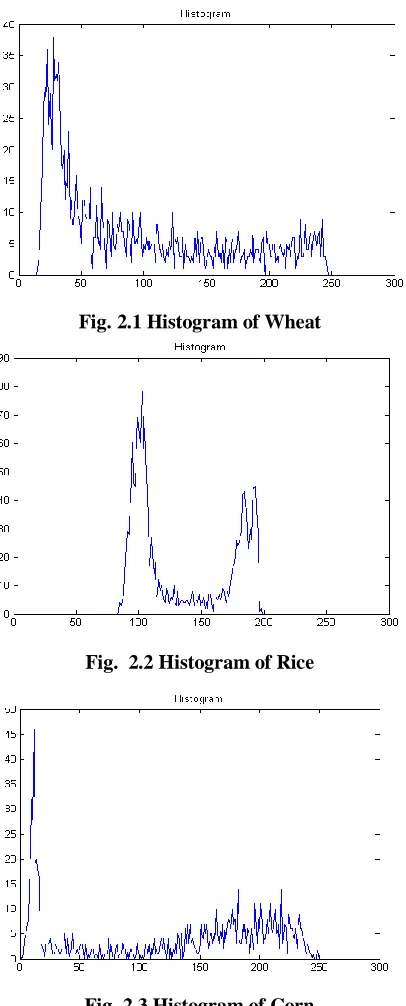
[image:3.612.346.528.326.665.2]Fig. 2.1 Histogram of Wheat
Fig. 2.2 Histogram of Rice
Fig. 2.3 Histogram of Corn
Fig.2.1 to 2.3 shows the variation of peak related to various seed varieties. These values are related to the variation of neighbor pixels. And we can see both pattern and peak variation in the above figures.
Here X axis represents the event whose frequency have to be count. And Y axis represents the frequency
For wheat the maximum peak is in the range of 35-40. Average frequency lies in the range of 12-18. For Rice maximum peak lies in the range of 70-80. Average frequency lies in the range of 30-40 Hz. And for corn maximum peak lies in the range of 45-50. Average frequency lies in the range of
Fig. 3 Classified result
V. CONCLUSION
In this work the multiple formulations method, connected component analysis approaches is used to extract the features like spatial, color, texture, morphological and statistical features from the sample seed images.
Later the seed images are classified through Euclidian distance classifier. Three grains wheat, Rice and Corn are used here to demonstrate the effectiveness of the proposed method and it is shown that the accuracy of 97% has been achieved. To enhance the performance of the proposed method further in spectral feature extraction and classification.
REFERENCES
1. N. Pandey, S. Krishna and S. Sharma, "Automatic Seed Classification by
Shape and Color Features using Machine Vision Technology", International Journal of Computer Applications Technology and Research, Vol. 2, Issue 2, 2013, pp. 208 – 213.
2. Pazoki, A.R. and Z. Pazoki, 2011. Classification system for rain fed wheat
grain cultivars using artificial neural network. African J. Biotechnol., 10(41):8031-8038.
3. X. Chen, Y. Xun, W. Li and J. Zhang, "Combining discriminant analysis
and neural networks for corn variety identification", Computer and Electronic in Agric., Vol. 71, 2010, pp. 48-53.
4. Melchinger, Albrecht E., et al. "In vivo haploid induction in maize: identification of haploid seeds by their oil content." Crop Science54.4 (2014): 1497-1504.
5. N. Vapnik, ―The nature of statictical learning theory,‖ New York:
Springer Verlag, 1995.
6. Smelser, A., M. Blanco, T. Lubberstedt, A. Schechert, A. Vanous, and C.
Gardner, 2015: Weighing in on a method to discriminate maize haploid from hybrid seed. Plant Breed. 134, 283—285.
7. Chaikam V, Boddupalli MP (2012). Double Haploid Technology in
Maize Breeding: Theory and Practise. CIMMYT, Mexico, pp. 20-23.
8. Katerina NOVOTNA , Jan VRBA'‖ New Methods For Treatment Of
Atherosclerosis‖ in Proceedings of IEEE International Conference on Image Processing, 2008.
9. SreeHari Rao, Senior Member, IEEE, and M. Naresh Kumar,‖ Novel
[image:4.612.73.276.50.553.2]International Journal of Innovative Technology and Exploring Engineering (IJITEE) ISSN: 2278-3075, Volume-8 Issue-8S, June 2019
10.Gang Liu, Li Yao, Xiaojie Zhao,‖ Optimization of Image Preprocessing for Diffusion Tensor Magnetic Resonance Imaging‖in proceedings of IEEE 2010 Sixth International Conference on Natural Computation (ICNC 2010).
11.Olivier salvado, claudiahillenbrand, shaoxiangzhang, and david . Wilson‖
Method To Correct Intensity Inhomogeneity In Mr Images For Atherosclerosis Characterization‖, in IEEE transactions on medical imaging, vol. 25, no. 5, may 2006
12.Suhas.S, C R Venugopal,‖ An Efficient MRI Image preprocessing and
Noise removal technique using linear and nonlinear filters‖, in 2017 International Conference on Electrical, Electronics, Communication, Computer and Optimization Techniques (ICEECCOT)
13.Comaniciu and P. Meer, ―Mean shift: A robust approach toward feature
space analysis,‖ IEEE Transactions on Pattern Analysis and Machine