Performance Analysis of Twister based MapReduce Applications
on Virtualization System in FutureGrid
*Yunhee Kang
*
Division of Information and Communication
Baekseok University
115 Anseo Dong, Cheonan, Korea 330-704
[email protected]
Geoffrey C. Fox
Pervasive Technology Institute
Indiana University
2719 E 10th St. Bloomington, IN 47408, USA
[email protected]
Abstract
This paper presents the result of performance evaluation of Twister based MapReduce applications to facilitate a virtualized cluster system running in the FutureGrid. For this work, we set up a virtualized cluster system made of a set of VM instances. In this experiment we observe that the overall performance of a data intensive application is strongly affected by the configuration of the VMs and load balancing is essential to handling large files in the case of having limited computing resources in the FutureGrid. The result of this experiment can be used for selecting a set of VM instances in proportion to 1) how much data are processed 2) what type of application runs in the FutureGrid. It can be used to identify the bottleneck of the MapReduce application running on the virtualized cluster system with various VM instances.
Keywords: MapReduce application, Cloud computing,
Performance evaluation, FutureGrid1. INTRODUCTION
Cloud computing is designed to provide on-demand computing resources or services over the Internet with the reliability level of a data center [1]. Conceptually users acquire computing platforms or IT infrastructures from clouds and then run their applications on the inside clouds [12]. Virtualization technologies partition hardware and consolidate utilization of server workload so that it is used to reduce the actual number of physical servers and to improve scalability and elasticity according to workload in the cloud environment. Hence virtualization technologies are the bases of cloud computing. In cloud computing environment, a virtual machine (VM) is a computing platform that creates a virtualized layer between the computing hardware and the application.
FutureGrid, a science cloud, plays a role as a resource provider, which has a cloud stack including Infrastructure as a Service(IaaS), Platform as a Sevice(PaaS) and Software as a Service(SaaS) [2]. The demanding requirements in the FutureGrid have led to the development of a new programming model like MapReduce. A MapReduce application is deployed at the provider’s computing infrastructure and its runtime supplies the developers a programming environment having a set of well-defined APIs that is referred to as PaaS.
This paper describes the result of performance evaluation of two kinds of MapReduce applications: one is a data intensive
application and the other is a computational intensive application. For this work, we construct a virtualized cluster system that consists of a set of nodes of which are VM instances in the FutureGrid [2].
In this paper we report that it is important to determine the configuration of a virtualized cluster system in order to run a MapReduce application efficiently in FutureGrid. Eventually we show that the appropriate selection of a set of VM instance types increases the overall utilization of resources in the FutureGrid. This approach is the way to identify the relationship between the type of applications and resources allocated for running them.
The rest of paper is organized as follows: Section 2 describes the related works including a brief overview of MapReduce, Twister and the FutureGrid. Section 3 reports the results from our experimental study and the observations on the result of our experiments. Conclusions are presented in Section 4.
2. RELATED WORKS
2.1 MapReduce
MapReduce, introduced by Dean and Ghemawat, is the most dominant programming model for developing applications in a cloud computing environment [3-5]. It is a kind of data parallel languages aimed at loosely coupled computations that execute over given data sets [3]. This requires dividing the workload across a large number of machines. The degree of parallelism depends on the input data size.
In this programming model the computation takes a set of (key, value) pairs, and produces a set of output (key, value) pairs. It consists of two functions: map and reduce. These two functions have the following signatures:
number of map operations. All reduce operations can also be executed independently.
Traditional parallel applications are based on a runtime library that has some features of communication and synchronization [10,11,13]. The feature provided by a runtime library is a low-level primitive one. However, a MapReduce programmer is able to focus on the problem that needs to be solved since only the map and reduce functions need to be implemented, and the framework takes care of the burden the programmer has to deal with lower-level mechanisms to control the data flow [2,4].
2.2 Twister
[image:2.612.45.284.394.533.2]There are some existing implementations of MapReduce such as Hadoop [6] and Sphere [7]. Twister is one of MapReduce implementations that is an enhanced MapReduce runtime with an extended programming model that supports iterative MapReduce computing efficiently [8]. In addition it provides programming extensions to MapReduce with broadcast and scatter type for transferring data. These improvements allow Twister to support iterative MapReduce computations highly efficient compared with other MapReduce runtimes. It reads data from local disks of the worker nodes and handles the intermediate data in the distributed memory of the worker nodes.
Fig. 1. Overall architecture of Twister
As shown in Figure 1, all communication and data transfers are performed via a pub/sub broker network which is a distributed messaging infrastructure [9]. As in other MapReduce runtimes, a master worker (MRDriver) controls the other workers according to instructions given by the user program. Twister uses a pub/sub broker network to handle four types of communication needs; (i) send and receive control events, (ii) send data from the client-side MR driver to the Twister MR daemons, (iii) transfer intermediate data between map and reduce tasks, and (iv) send the outputs of the reduce tasks back to the client side MR driver.
A twister based MapReduce application uses the following systems.
• Twister 0.8
• NaradaBroker 4.2.2
• Linux 2.6.x running on Xen
2.3 FutureGrid
FutureGrid is a project for building a distributed testbed for developing research applications and middleware, which employs virtualization technology to allow the testbed to support a wide range of operating systems. The project provides a capability that makes it possible for researchers to tackle complex research challenges aimed at minimizing overhead and maximizing performance in computer science related to the use and security of grids and clouds. It has been offering a flexible reconfigurable testbed based on dynamically provisioning software to support deploying a specific image to a variety of environments composed of virtual machines [2].
One of the goals of this project is to understand the behavior and utility of cloud computing approaches. FutureGrid dynamically provides diverse configurations that have different operating systems and middleware configurations. The goal of dynamic provisioning is to partition a set of resources in an intelligent way to provide a user-defined environment to any user that makes such a request.
3. EXPERIMENTAL RESULTS
3.1 Experiment Environment
In this experiment, a virtualized cluster system consists of a set of VM nodes that are allocated from a cluster named India, which is one of the FutureGrid environments. The image of an instance for VM basically contains Linux 2.6.27 and Java VM 1.6. Each instance provides a predictable amount of dedicated computing capacity that is defined in FutureGrid. To set up the virtualized cluster systems, we deploy images and run the instances in India.
Table 1. Main specification of VM instance type
Type of VM instance
Main HW Features
CPU Memory(Mbyte) Disk
c1-medium 1 1,024 7
m1-large 2 6,000 10
[image:2.612.323.574.568.665.2]Table 1 shows an overview of the types of VM instances to be used in the experiment. Hereafter CPU is used to represent core.
We make a configuration, which is based on the type of VM instance described in Table 1, for a virtualized cluster system as a testbed and use various configurations that are used to evaluate performance of the aforementioned MapReduce applications. The configuration has various middleware setups. It is used to represent a specific workload. For example, Type-1 represents an unbalanced workload allocation and Type-3
represents a balanced workload allocation. Table 2 shows the list of configurations except gf14-gf15 and India. The
[image:3.612.316.576.155.300.2]gf14-gf15 is composed of two Linux machines. India is a multi-core machine having 1,024 cores in 128 nodes in the FutureGrid.
Table 2. Configuration of virtualized cluster systems
Configuration
Main Features
Virtualized Clusters
CPU Memory
(Mbyte)
Location of NaradaBroker
Type-1 3 7,024 c1-medium 1*c1-medium 1*m1-large Type-2 3 7,024 m1-large 1*c1-medium
1*m1-large Type-3 4 12,000 m1-large 2*m1-large Type-4 2 12,000 m1-xlarge 1*m1-xlarge
3.2 Experiment: Data Intensive Application
In this experiment, there are five configurations set up to run a data intensive application. These configurations can be classified into two types: one is a cluster system composed of physical machines and the other is a virtualized cluster computing system. To evaluate performance of a data intensive application, we construct a MapReduce application that is used to handle a data set collected from a music radio site, Last.fm(http://www.last.fm/). Last.fm provides the metadata for artists including biography by API. This application is used to generate a histogram of the counts referred by musicians and to construct a bi-directed graph based on similarity values between musicians in the data set.
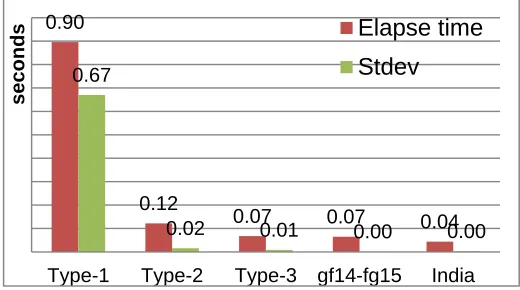
We adapt application’s performance metrics in terms of elapse time and standard variation. The graph in Figure 2 plots the results using the MapReduce application. In the part of the graph, Type-1 to Type-3, we see that as the resources of VMs including CPU and memory increase, the elapse time of the application and the value of its standard variation decrease.
What we observed is that the number of CPUs has less impact on the elapse time in comparison with the results of
Type-2 and Type-3. Most obviously, though performance degrades as the application runs in the virtualization
environment, the performance of Type-3 still provides 80.9% of the average performance of gf14-gf15 and India when running the physical computing environment. Based on the performance evaluation we may choose the configuration of a virtualized cluster system to provide around 80% of performance of a real cluster system.
Fig. 2. Elapse time of similarity: 5 configurations virtualized cluster systems (3 configurations) and physical
cluster systems (2 configurations)
Figure 3 and Figure 4 show the different load averages as the application runs on the Type-1 and Type-2 with different setting of a message broker even if these computing resources have the same virtualized system that consists of 1*c1-medium and 1*m1-large. Three values of load average represent the processor queue lengths in past one, five, and fifteen minutes. We can see that performance of a virtualized cluster system is affected by the configuration depending on the location of the message broker that sends and receives the message to/from the application. The gap of load average shown in Figure 3 and Figure 4 is caused by CPU and memory capability of the node running the message broker. The values of load average sharply decrease around 600 in Figure 3 and around 300 in Figure4 due to the completed application.
In summary, this observation induces that it is essential to choose properly a configuration that consists of a set of VM instances in the FutureGrid.
0.90
0.12
0.07 0.07 0.04 0.67
0.02 0.01 0.00 0.00
Type-1 Type-2 Type-3 gf14-fg15 India
s
e
c
onds
Elapse time
Stdev
0 2 4 6
1
57
1
13
1
69
2
25
2
81
3
37
3
93
4
49
5
05
5
61
6
17
6
73
7
29
7
85
8
41
8
97
9
53
load
av
er
age
[image:3.612.42.290.266.397.2] [image:3.612.318.577.561.701.2]Fig. 3. Load average of Type-1 (NaradaBrokering running on the node c1-medium)
Fig. 4. Load average of Type-2 (NaradaBrokering running on the node m1-medium)
3.3 Experiment: Computation Intensive Application
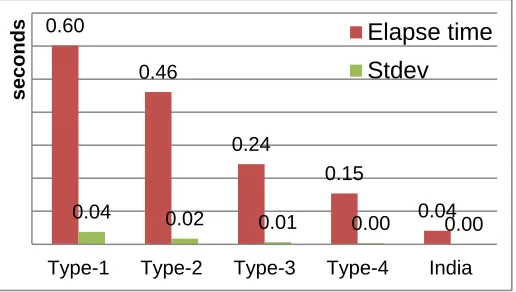
[image:4.612.39.297.453.599.2]To evaluate performance of a MapReduce application typed computation intensive, one configuration, type-4, is added to the configurations of this experiment. In this experiment, we use a parametric k-means algorithm with 100,000 data points, which is to organize these points into k clusters. We compare environments, a virtual cluster system and a physical cluster system, with application’s performance metrics in terms of elapse time and standard variation.
Fig. 5. Elapse time of k-means: 5 configurations - virtualized cluster systems (4 configurations) and a
physical cluster system (1 configuration)
As shown in Figure 5, our experiments indicate that the average of elapse time increases over 375.5% in the virtualized cluster computing system, in comparison with a physical cluster system represented by India. Besides, the elapse time decreases
proportionally as VM’s CPU capability is added to the virtualized cluster computing system. Furthermore, the standard deviation is less affected by configuration change and the size of input data. We observe that Type-4 has better performance than Type-3. Based on this observation we derive that the performance of this application can be variable depending on network I/O bandwidth which is required to deliver the intermediate results of map tasks to the reduce tasks.
In the physical cluster system india, the value remains very low at about 1-2% of the variation of elapse time due to the capability of system mainly related with CPU power. In addition, the standard variation in the three configurations
Type-2, Type-3 and Type-4 of the virtualized cluster computing systems remains low at about 2.0-3.78%. Hence we can expect that as the number of available VMs increases, there is a proportional improvement of elapse time.
3.4 Analysis
Though load balancing is not so significant in execution of a MapReduce algorithm, it becomes essential to handling large files in the case of having limited computing resources in the FutureGrid. Figure 6 shows that the elapse time reduces up to 7.34 times from 89.57 seconds to 12.19 seconds when relocating a messaging broker to a node having higher memory capability across nodes in the same VM configuration. It enhances hardware utilization in resource-critical situations with a slight improvement in performance. It is important to determine a configuration of a virtual cluster system in order to run a MapReduce application efficiently in the FutureGrid.
[image:4.612.316.579.484.615.2]The result obtained from the experiments suggests that it is important to determine a configuration of a virtualized cluster system in order to run a MapReduce application efficiently in FutureGrid.
Fig. 6. Speedup over relocating the NaradaBrokering
We have observed an anomaly of system behavior as a data intensive MapReduce application runs in a virtualized cluster system that consists of VMs in the FutureGrid. In Type-1, there is the same resource starvation problem that occurs as 0
0.5 1 1.5
1 64
127 190 253 316 379 442 505 568 631 694 757 820 883 946
load
av
er
age
1min
5min
15min
0.60
0.46
0.24
0.15
0.04 0.04 0.02 0.01
0.00 0.00
Type-1 Type-2 Type-3 Type-4 India
s
e
c
onds
Elapse time
Stdev
Type-1 Type-2
Elapse time 89.57 12.19
Stdev 66.97 1.55
se
con
d
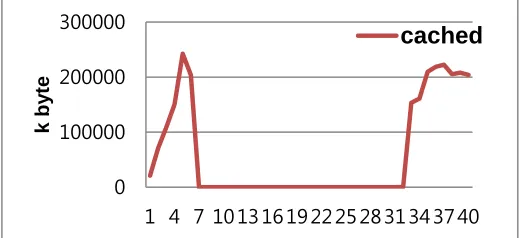
both applications (data intensive application and computation intensive application) run. It is caused by a lack of computing resources including CPU and memory capability to run the application and by having an inappropriate configuration of a set of VMs associated with a middleware setting. Figure 7 shows that the variation of cached memory happens. Cached memory is essentially free, in that it can be replaced quickly if a running application needs the memory. However, there is no available cache memory whereby the memory usage is sharply high by up to 100 % in 7 seconds after starting to monitor the system behavior. Hence system is still pending caused by little or no memory available memory. It can exacerbate failures.
Fig. 7. Cached memory in VM
4. CONCLUSION
This paper addressed the result of performance evaluation of two kinds of MapReduce applications running in the FutureGrid. What we have observed in the experiments is that the overall performance of data intensive application is strongly affected by the throughput of the messaging middleware since it requires to transfer data when a map task sends the intermediate result to a reduce task. While it is close to its limit of available memory as a data intensive MapReduce application runs on the specific configuration of nodes, the elapse time sharply increases and its standard deviation is high. Based on the experimental result in this paper, we can see that the performance of the MapReduce application is very strongly affected by the configuration of VM. Eventually we conclude that the appropriate selection of a set of VM instance types increases the overall utilization of resources in the FutureGrid. However the performance of computational intensive application is associated with CPU throughput. It is less affected by the configuration of VMs having the same CPU power. Hence the result provides a first step towards understanding the relationship between the configuration of VMs and performance effects associated with the type of applications. As we have seen the result of the experiments can
be used for selecting the proper configuration based on the proposed guideline in cloud computing. It can be used to identify the bottleneck of a MapReduce application running on the resource, given a VM configuration. It will be used to extend the information service system associated with the middleware for cloud computing.
REFERENCES
1. Armbrust, M., Fox, A., Griffith, R., Joseph, A.D., Katz, R.H., Konwinski, A., Lee, G., Patterson, D.A., Rabkin, A., Stoica, I., Zaharia, M.: Above the Clouds: A Berkeley View of Cloud Computing. EECS Department, University of California, Berkeley (2009)
2. https://portal.futuregrid.org/
3. Dean, J., Ghemawat, S.: MapReduce: A Flexible Data Processing
Tool. CACM 53,72-77 (2010)
4. Morton, K., Friesen, A., Balazinska, M., Grossman, D.: Estimating the Progress of MapReduce Pipelines. IEEE 26th International Conference on Data Engineering (ICDE), 2010, pp. 681 - 684, Long Beach, CA (2010)
5. Dean, J., Ghemawat, S.: Mapreduce: Simplified data processing on
large clusters. CACM 51,107-113 (2008)
6. Wang, F., Qiu, J., Yang, J., Dong, B., Li, X., Li, Y.: Hadoop high availability through metadata replication. Proceeding of the first international workshop on Cloud data management, pp. 37-44, Hong Kong, China (2009)
7. Grossman, R., Gu, Y.: Data mining using high performance data clouds: experimental studies using sector and sphere. Proceeding of the 14th ACM SIGKDD international conference on Knowledge discovery and data mining, pp. 920-927. ACM, Las Vegas, Nevada, USA (2008)
8. Ekanayake, J., Li, H., Zhang, B., Gunarathne, T., Bae, S.-H., Qiu, J., Fox, G.: Twister: A Runtime for Iterative MapReduce. The First International Workshop on MapReduce and its Applications (MAPREDUCE'10) - HPDC2010, (2010)
9. Geoffrey Fox and Shrideep Pallickara. Deploying the
NaradaBrokering Substrate in Aiding Efficient Web & Grid Service Interactions. Invited paper for Special Issue of the Proceedings of the IEEE on Grid Computing. Vol 93, No 3, 564-577( 2005).
10. MPI. MPI(Message Passing Interface). Available:
http://www-unix.mcs.anl.gov/mpi/
11. Kim, J., Searching Toxic: Web Service for Chemoinformatics Workflows, International Journal of Grid and Distributed Computing. Vol. 1, No. 1, 17-22(2008)
12.Yoo, H., Hur, C., Kim, S., Kim, Y., An Ontology-based Resource Selection Service on Science Cloud, International Journal of Grid and Distributed Computing. Vol. 2, No. 4, 17-26(2009)
13. Han, Y., Bioworks: A Workflow for Automation of Bioinformatics Analysis Processes, International Journal of Science and Bio-Technology. Vol. 3, No. 4, 59-68(2011)
0
100000 200000 300000
1 4 7 10 13 16 19 22 25 28 31 34 37 40
k
b
y
te