Abstract: This paper exhibits a methodology for distribution expansion planning utilizing multi objective Particle Swarm Optimization (PSO). The Optimization objectives are power losses, Investment & Operating costs, Improve voltage profile. The PSO method has been verified by 30 real time nodal system. While planning the expansion and operation of distribution network, utilities have a complex combination of technical constraints, which must be considered together with the investment decisions on the behavior of the distribution system along the planning horizon.
Keywords:Distributed network Expansion planning, PSO..
I. INTRODUCTION
Due to growing of power demand, power system distribution expansion planning is necessary; this can be achieved by adding distribution system to the network. In this manner, the goal of power distribution planning is to portray the improvement of the system to fulfill the future power need with an attractive level of intensity quality at any rate cost [10].The arranging procedure is separated in to two arrangements: long range arranging & short range arranging. The long-range arranging or planning is to guarantee all short-range choices have enduring worth and add to a minimum cost system. And to make certain choices that are made in the short-run planning have a low present worth expense and fit the long term needs. Short-run arranging or planning is required to make the system to supply capacity to the clients consistently to distribution system.
II. PLANNINGPROCESS
There are three steps involved in planning process of distribution systems. Step1 is to identify alternatives. Second step is assessing them against criteria and third step is desired properties. To make best plan and proper decision the planner must consider the uncertainties while solving the planning problem. To pick or distinguish best arrangement, the options must be assessed against criteria and limitations [2]. The criteria and constraints are characterized by the problem formulation. The objectives & constraints in Distributed system planning are follows.
A. Economical cost
One goal to limit in any power system planning is cost. The affordable expense of a power distribution system can be
Revised Manuscript Received on September 03, 2019
*Poshitha B, E&EE department, Adichunchanagiri Institute of Technology, Chikkamagaluru, India .
**Dr. Surekha Manoj, E&EE department, Vidya Vikas institute of Engineering & Technology, Mysuru, India.
partitioned into two sorts: capital expense and working expense [10]. The capital expense incorporates the construction, development, installation establishment, and different expenses related with putting the system into operation.. The capital expense is considered as a one-time cost and the working expense as an intermittent expense. In addition, the capital expense is viewed as fixed expense while the working expense is viewed as factor cost. A fixed expense does not fluctuate as an element of any factor component of the framework, for example, the stacking of substations and lines.
B. Voltage drop constraint
Voltage drop characterizes constrains inside which service is required. The planning procedure can take quite a while and can be incredibly troublesome and costly if it is done manually. An improvement strategy utilizes a scientific definition of the planning issue and optimization algorithms.
C. Active and Reactive power constraints
The integration of DG units must cover the total active power losses and total load by considering total active power generation from the different sources as per the load demand. The reactive power generation is also considered depending upon the power generation.
D. DG generation active , reactive power limits
The dynamic power created by every DG is confined by its lower and furthest points of confinement on the measure of generation through DG. The most extreme DG introduced limit points of installation have been considered as 20% and 30% of rated capacity of substation. . The reactive power of every DG is confined by its lower and maximum boundaries.
III. PROBLEMSTATEMENTS
A. Problem definition
The issue of distribution system expansion planning is to find the zone and point of limit of substations and feeders to supply ability to a given capacity of future power demand at any rate cost with least expense, with a good power quality and meeting particular necessities. [3]. Even more expressly, the planning issue incorporates the decision of the number, region and size of substations and feeders with the true objective that the capital cost (fixed cost) and the cost of vitality energy losses (variable cost) is least; keeping up the radiality of the network and at the same time not harming the boundaries and voltage drop constraints.
Distributed Expansion Planning By Using
Particle Swarm Optimization Method
B. Mathematical formulation: Multi objective Planning Model
Investment & Operating Cost
The proposed planning methodology limits diverse cost capacities related to the operation & investment cost P1(x),
energy loss cost P2(x) and power con-gestion cost P3(x). It is
written as (1).
Minimum P(x)={P1(x),P2(x),P3(x)} (1)
The operation & investment cost for the total capacity of DG units indicated in (2). It states that by considering (2), DG units at different load buses are obtained by using optimization algorithm.
S1= PDG,ij+ PDG,ij.Aj.aj.T (2)
Where,
Icj and Ocj are the yearly based operation & investment cost of jth unit.
N indicates distribution system load buses. T is operating time in hour’s yearly basis. Aj is the factor of availability
aj indicates factor of average capacity of jth DG unit.
Line real power losses
Real power loss is given by f=Prpl
Prpl=
(3)
Where,
Nn=Total number of buses of Distributed system. PGni= generator active power output at bus ni [11] PDni= Demand of active power at bus ni
Vmi=Bus voltage at mi Vni=Bus voltage at ni
Yni=Admittance of buses between ni & mi
mi=Phase angle at mi
ni=Phase angle at ni
ni=phase angle of Yi=Ynini ni = Bus numbers at receiving end mi=Bus number of the sending end
Improve Voltage Profile
F= 2
Where,
Vni=Voltage of bus ni Vrated=Rated voltage (p.u)
C. Constraints
Active & Reactive power constraints of DG units
Pdg,imin≤PDG,i≤PDG,imax
QG,min≤QG≤QG,max
Active Power constraints of Distribution system lines
│Pn,m(,v) │≤Pn,m,max
│Pm,n(,v) │≤Pm,n,max
Voltage Limits
VniminVni Vni max
IV. MULTIOBJECTIVEPSO
Steps of Multi Objective PSO are [7]
Step 1: Give system data input such as line data, bus data, and load data.
Step 2: Newton raphson method of load flow analysis is used to calculate the losses.
Step 3: Consider initially iteration count k=0. Generate number of population as particles randomly. Generate velocities & positions of particles randomly.
Step 4: Calculate the total loss in using equation (3) by considering bus voltage limits for each particle.
Step 5: Comparison is done between objective value (OV) and its individual best by considering each particle. The current Pbest is decided when the OV is lesser than Pbest, also note the respective particle position.
Step 6: From all the particles select minimum value of best particle. This is noted as overall Global best.
Step 7: Best positions & velocities are updated. (step4 & step5)
Step 8: Check the OV reached maximum boundary then go for step9 else set iteration value i=i+1 & repeat step4. Step 9: The real power losses are calculated by considering best location & sizing of DG’s.
V. PROGRAMFLOW
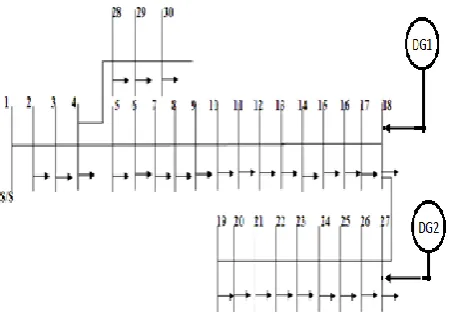
Multi objective program flow as shown in Fig. 1.The study has been considered for 30 bus real time system. Planning Schemes are shown in Fig. 2. Analysis made for placement of Two DG units for the real time 30 bus distribution system.
VI. RESULTANDDISCUSSION
[image:3.595.42.571.311.408.2]Fig. 2. Single line diagram of real time 30 bus system without DG
Table-I: Power loss before & after optimization
The results are obtained using PSO programming code in mat lab for optimal placement and losses are calculated. The results are shown in Table I for before and after optimization to place DG. The result which shown in Table-I clearly states, the losses are reduced after the PSO optimization. The amount of total loss reduced after the placement of DG’s is Power-Loss= 1.498207e+001 KW
Power-Loss= 9.461983e+000 KVAr.
The placement of two DG’s is shown in Fig. 3.
Fig. 3. Single line diagram of real time 30 bus system with DG
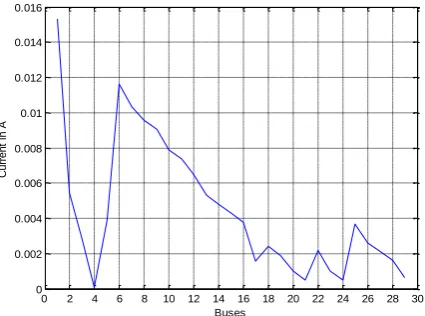
Fig.4. shows variation of current at different busses before and after optimization. It also indicates that variation of current is reduced after PSO optimization shown in Fig. 5.
[image:3.595.323.532.474.663.2]And variation of power factor after optimization as shown in Fig. 6. The analysis for the real time 30 bus system shows by placing the DG’s or using optimization the losses are reduced, variation of current and power factor is maintained, voltage profile at different buses are improved.
0 2 4 6 8 10 12 14 16 18 20 22 24 26 28 30
0 0.5 1 1.5 2 2.5 3 3.5
4x 10
-3
Buses
C
u
rr
e
n
t
in
[image:3.595.57.283.538.697.2]A
Fig. 4. Variation of current at different buses before optimization
DG location Bus No Power Loss (KW)
Before Optimization
Power Loss (KVAR) Before Optimization
Power Loss (KW) After Optimization
Power Loss (KVAR) After Optimization
DG 1 27 3.731229e+002 2.35624e+002 2.35667e+001 1.488095e+001
0 2 4 6 8 10 12 14 16 18 20 22 24 26 28 30 0
0.002 0.004 0.006 0.008 0.01 0.012 0.014 0.016
Buses
C
u
rr
e
n
t
in
[image:4.595.57.270.60.218.2]A
Fig. 5. Variation of current at different buses after PSO
optimization 0 2 4 6 8 10 12 14 16 18 20 22 24 26 28 30
0.972 0.974 0.976 0.978 0.98 0.982 0.984 0.986 0.988 0.99 0.992
Buses
P
o
w
e
r
Fa
c
to
[image:4.595.322.528.62.248.2]r
Fig. 6. Variation of Power factor at different after PSO optimization
VII. CONCLUSION
This paper presents basic power flow analysis is applied to calculate the losses for real time 30 bus network. Due to the placement of optimal DG’s & at optimal location voltage profile at different buses are improved & losses are reduced. After PSO optimization for the system approximately 4.15% of losses are reduced. Multiple DG’s are installed in the system and different type of constraints active & reactive power constraints of DG units & distribution system voltage profile have been considered.
REFERENCES
1. Dong-xiao niu, yun-peng ling, qi zhao, qing-ying zhao, “An improved particle swarm optimization method based on borderline search strategy for transmission network expansion planning”, fifth international conference on machine learning and cybernetics, dalian, 13-16 august 2006,IEEE.
2. Partha Sarathi Sensarma, Mohamed Rahmani, Antonio Carvalho, “A Comprehensive Method for Optimal Expansion Planning Using Particle Swarm Optimization”, 2002 IEEE.
3. Bharti Dewani, Dr. M.B. Daigavane, Dr.A.S. Zadgaonkar, “A review of various computational intelligence techniques for transmission network expansion planning”, 2012 IEEE International Conference on Power Electronics, Drives and Energy Systems”,December16-19, 2012, Bengaluru, India.
4. A. Simo, St. Kilyeni, C. Barbulescu, “Artificial Intelligence based Dynamic Transmission Network Expansion Planning”, 2015, IEEE. 5. R. Romero, M.J. Rider, I. de J.Silva, “A Metaheuristic to Solve the
Transmission Expansion Planning", IEEE Transactions on Power Systems, 2007, vol. 22, nr. 4, pp. 2289-2291.
6. A. Arabali, M. Ghofrani, E.M. Amoli, M.S. Fadali, M.M. Aghtaie, “A multiobjective transmission expansion planning framework in deregulated power systems with wind generation", IEEE Transactions on Power Systems, vol. 29, nr. 6, 2014, pp. 1-8
7. A.D. Le, M.H. Nguzen, M. Eghbal, D.H. Nguzen, "Transmission expansion planning in electricity market: the case in Vietnam", in Proceedings of the IEEE Australasian Universities Power Engineering Conference (AUPEC), Hobart, Australia, 2013, pp. 1-6.
8. A. Verma, B.K. Panigrahi, P.R. Bijwe, "Transmission network expansion planning with adaptive particle swarm optimization", in World Congress on Nature & Biologically Inspired Computing NaBIC, Coimbatore, India, 2009, pp. 1099-1104
9. R. D. Zimmerman et al, “MATPOWER Steady-State Operations, Planning and Analysis Tools for Power Systems Research and Education”, IEEE Transactions on Power Systems, vol. 26, no. 1, pp.12- 19, Feb. 2011.
10.Rivas-Davalos, Francisco(Irving, MR). "A genetic algorithm for power distribution system planning", Brunel University School of Engineering and Design PhD Theses, 2014.
11.Payasi, RP, AK Singh, and D Singh. "Review of distributed generation planning: objectives, constraints, and algorithms", International Journal of Engineering Science and Technology, 2011.
AUTHORS PROFILE
Mrs. Poshitha B secured Bachelor Degree in Electrical & Electronics Engineering at SIET, Tumakuru and Master’s Degree in Computer Aided in Industrial Drives at MCE, Hassan. Presently working as Asst Prof in the dept of EEE, AIT chikkamagaluru, and Research Scholar at VVIET, Mysuru.