International Journal of Innovative Technology and Exploring Engineering (IJITEE) ISSN: 2278-3075, Volume-8 Issue-10, August 2019
Sumanjit Das, Sarojananda Mishra
Abstract: The main attractive feature to stock market is speedygrowth of stock economic value in short yoke of time. The investor analyses the demonstration, estimated value and growth of organizations before investing money in market. The analysis may not be enough by using conventional process or some available methods suggested by different researches. In present days large number of stocks are available in market it is very difficult to study each stock by help of very few suggested foretelling methods. To know the anticipated stock value we need some advanced prediction technology for stock market. This paper introduce an advanced skillful method to plan and analyze the different organizers stock execution in market and prognosticate best suitable stock by predicting close price of stock. The projected arrangement is based on multilayer deep learning neural Network optimized by Adam optimizer. Recent 6 years (2010-2016) data of different organizations are applied to the model to demonstrate the skillfulness of the projected proficient method. From result it has been ascertained that the projected framework is best suited to all different data set of various sectors. The prediction error is very minimal as visible from outcome graph of framework.
Keywords: Stock market, deep learning, multilayer perceptron, ANN, forecasting, soft computing.
I. INTRODUCTION
In the present economic situation of the world exchange rate of currency and stock market value plays great role. The development of stock value of companies represents growth in terms of doing business and growth of economic status as well as share holders value. In current days people across the globe are more interested to invest money directly or indirectly into share market for quick growth of fund in comparison to other sectors. So before investing into stock market everybody wants to know which one is better in terms of return. The days of technology helps them to find a solution to the problem. The exact prediction of stock price by using chart is now next to impossible. The efficient market assumptions put forward that stock value gives recent data which leads to impulsive. The random walk recommended that stock price cannot be exactly predicted by help of historical values [1]. After all of this uncertainty and risk people are investing in stock market due to high return. This attraction has been creating a challenge for researcher to develop high efficient models for forecasting. Numerous mathematical models have been developed still the outcomes are not satisfying [2].
Revised Manuscript Received on August 01, 2019
Sumanjit Das, PhD Scholar Biju Patanaik University of Technology, Rourkela, Odisha, India.
Sarojananda Mishra, Dept. of Computer Science and Engineering Indira Gandhi Institute of Technology, Saranga, Odisha, India
People have worked ANN based model for stock price prediction and in some cases hybrid models have been used in relation with stock market forecasting [3]. The stock market index prediction is always toughest task because of its volatile nature, Many researchers have taken this as challenge to develop efficient models which work on real data using fuzzy to predict stock index price [4-9]. Apart from that some models hybrid fuzzy with particle swam optimization [7,10], neural network [11] models are also discovered to develop the accurateness of forecasting in stock market value. To get better result of the financial predictions by help of few extra features in input of supervised models beside among historical data of the intention market. [12-13] used some stock market data in south korean stock and product costs in ANN based semi-supervised model by not paying concentration to the historical data of the time series being expected and accomplished superior outcome contrast to their challenger by using only historical data of the objective. [13-14] suggested a model that supportive in projecting composite associations in between unexpected changes of financial data. An additional dimension of research is time gap of forecasting [15] talk about the significance of data regularity in sampling. noisy character of financial time series formulates it complex to calculate track for short epoch regularities. This paper focused on the approach of deep learning using Multi Layered Perceptron (MLP) to predict close stock price. This model is trained then applied on different stock data and from the result it is observed that simulation performance of the proposed model is best suited to each data set of stock market. The predicted result is measured in terms of Mean Absolute Percentage Error (MAPE) for all data sets. It is observed that the proposed model is prospective enough to predict stock market price with very less prediction error. The origination of paper as like: ‘Literature Study’ segment illustrates the information of review in interrelated field, ‘Materials and Methods’ segment consist of data sets, MLP and Optimization technique. The projected foretelling framework, activity flow of framework along with normalized real data used to test the projected framework incontestable in ‘Projected Methodology for Prediction’ segment. The representation and empirical outcome, provision of input option, statistical and fiscal conditions, MAPE and similitude with different data set results with projected foretelling framework is unregenerate in ‘Empirical Result’ segment. At last, ‘Summery and Emerging Directions’ segment concludes the projected framework with its limitation and use.
Advanced Deep Learning Framework for Stock
II. LITERATURE STUDY
The prospective of fuzziness to improve predicting schemes present in most of the applications because of its compact nature between different data like numerical and qualitative. One liner regression analysis with fuzzy model [16] has been implemented by considering fuzzy data not the statistical. There are also researchers implementing fuzzy concept for prediction using time series data [17]. The authors of [18, 19] focus on randomness associated with random regression model in different situations for estimate of price and implemented the model for oil palm fruit prediction. But in [20, 21] FR-R model and FR-AR Model are used in supervised data set of shanghai composite index to predict weekly. In modern days the working process of random fuzzy variable are also applied to find solution in the field of supply chain master planning and network [22, 23]. In [24] the author’s implemented different neural networks like MLP, ANN based DAN2 and hybrid neural network to predict stock value. They have analyzed results and recommended that DAN2 scheme is better than other schemes. To address the constraints of local search in standard model a new hybrid was proposed by [25] based on PSO and GA using congregation biological mechanism. A novel ANN based heuristic optimization hybrid model suggested in [26)] to increase the efficiency of stock market growth prediction in language of financial performance. The authors demonstrate that ANN based model has ability to choose and decide inner layer neurons. To choose the appropriate technical pointers, they set prearranged 45 changeable and at last part of synthesis 26 and 23 changeable are particular element not repeated by GA and HS schemes. By following this complex process of changeable choosing is diminished to virtually fifty percent and shaping the best probable number of neurons in inner layer eradicates more or less fitting problems of ANN models. A RCCRO has been proposed in [27] to resolve the improvement difficulty and suggested an accommodate plan of action RCCRO for presentation enhancement. The working efficiency of RCCRO has been evaluated with many different available models on a set of usual uninterrupted standard mathematical relation. An advanced version of PSNN (Pi-Sigma) has been proposed in [28, 29] trained by ACRO known as CRO-PSNN scheme. Result of the implemented model compared with different standard data and it is observed that this composite scheme is finer than PSNN, GAPSNN and PSO-PSNN. The use of GA for selecting the most favorable factor of ANN based representations was suggested in [30]. The scheme engaged composite scheme to discover real data locations in the fiscal supervised data & integrated them to increase the predicting correctness. In [31] a new forecasting scheme based on neural network along with multivariate time series model to predict exchange rate of USA, UK and Japan then GRNN used to find the predictive errors in model. A Bayesian Vector Auto Regression based multivariate time series model designed to predict 33 exchange rates [32] and in [33] prediction of rate for high frequency data set. Another model used Radial basis functions neural network (RBFNN) optimized by particle swam optimization to estimate foreign exchange rates [34]. To examine and prognosis stock market
International Journal of Innovative Technology and Exploring Engineering (IJITEE) ISSN: 2278-3075, Volume-8 Issue-10, August 2019
III. MATERIALS AND METHODS: A. Data Description
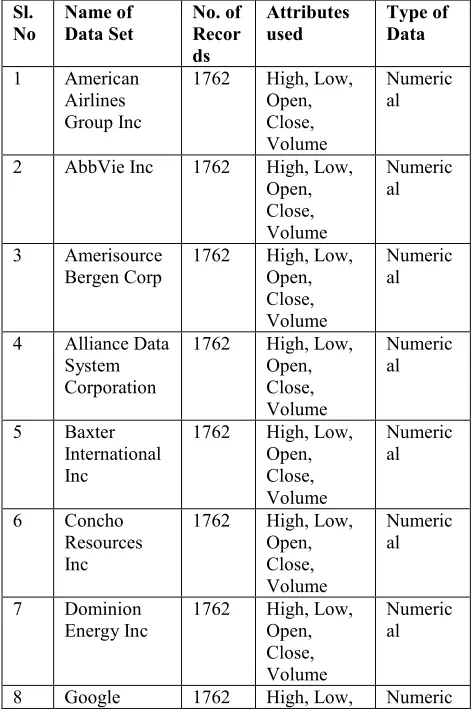
The data are widely collected from American stock market of different companies from different sector like IT, Energy and Airlines to get high range of share data. In our work we have consider stock shares from January 2010 to December 2016 as shown in table 1 and table 2. There are different features in data set but we have considered attributes like open, close, low and high by selecting them by help of feature extraction process. The data sets are time series numerical data. To maintain the uniformity in data set we have applied Min-Max Scaling method which keeps data in a range of positive value. So that it can be used for prediction model.
B. Cross Validation:
The cross validation is used to split the data set arbitrarily into γ number of folds. The cross validation is represented in eq(1).
Cross Validation (CV) =
1/
DT
i
(1)
Where DTi is fold quality and γ represents regular
[image:3.612.317.556.47.182.2]parameter for number of folds. The information set of stock is split for train and test purpose to get better result.
Table 1: Time series data of different stocks 1/4/2010 to 30/12/2016.
Sl. No
Name of Data Set
No. of Recor ds
Attributes used
Type of Data
1 American
Airlines Group Inc
1762 High, Low, Open, Close, Volume
Numeric al
2 AbbVie Inc 1762 High, Low,
Open, Close, Volume
Numeric al
3 Amerisource
Bergen Corp 1762 High, Low, Open, Close, Volume
Numeric al
4 Alliance Data System Corporation
1762 High, Low, Open, Close, Volume
Numeric al
5 Baxter
International Inc
1762 High, Low, Open, Close, Volume
Numeric al
6 Concho
Resources Inc
1762 High, Low, Open, Close, Volume
Numeric al
7 Dominion
Energy Inc 1762 High, Low, Open, Close, Volume
Numeric al
8 Google 1762 High, Low, Numeric
Open, Close, Volume
al
9 IBM 1762 High, Low,
Open, Close, Volume
Numeric al
10 Yahoo 1762 High, Low,
Open, Close, Volume
Numeric al
Table 2: Sample of stocks data set chosen from America stock market.
Stoc
k ID Listed Stock Name Abbreviation Sector 1 American Airlines
Group Inc AAL Airlines
2 AbbVie Inc. ABBV Pharmaceutic
al
3 AmerisourceBergen
Corp ABC Drug
4 Alliance Data
System Corporation ADS Markecting and service
5 Baxter International
Inc. BAX Healthcare
6 Concho Resources
Inc. CXO Energy
7 Dominion Energy
Inc. D Power & Energy
8 Google GOOG
L
IT
9 IBM IBM IT
10 Yahoo YHOO IT
C. Multilayered Perceptron (MLP)
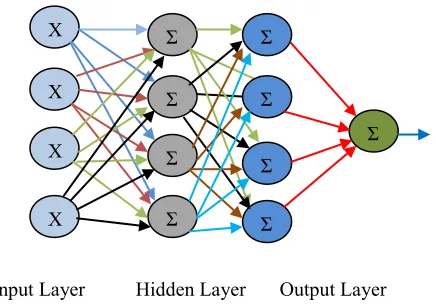
A multilayer perceptron (MLP) is the part of deep learning or deep artificial neural network consisting of more than one perceptron. The MLP is having usual input and output layers as similar to others but having user dependent hidden layers which helps in prediction of input data under certain conditions we call that deep learning. The MLPs are often applied to supervised learning problems here also we have applied to time series data for forecasting stock price. The network is trained by adjusting parameters or weights and biases of model. The MLP is widely used network for stock prediction in this model MLP gives one output for stock close index price by help of hidden
[image:3.612.53.290.387.742.2]Input Layer Hidden Layer Output Layer
Fig. 1: The regular architecture of MLP.
The hidden layer perceptron and output layer uses activation function as shown in eq (2).
1
(1
Yin)
Yout
e
(2)Where Yout represents output of neuron Yin is the input of
neuron and λ is the amplification in function. The component is a vector consisting of n variables so the number of input neuron is same n numbers. The first layer is depends on the number of input variable in the problem. The second layer or hidden layer is independent of relationships among variable. For neuron k at hidden layer the weight output Ok is
calculated by help of following equation.
1
n
k k ik i
i
O
S
W
V
(3)
Where Vi is the input vector for ith, Wik is the weight
between input and hidden neuron. The bias factor is βk and S
is the activation function sigmoid. The output Ŷ at neuron is computed by following equation.
0
ˆ
kk
Y
S
W
O
(4)
Where Wk is the weight between hidden neuron and
output neuron, β0 is the output bias. The error is computed by
comparing expected output with Ŷ as shown below.
Y
ˆ
i i i
E
Y
(5)
Where Ei is the error computed by help of Yi desired
value and Ŷi observed value for ith training pattern. From this
we can find mean square error for all patterns which propagate back to MLP model.
D. ADAM Optimizer
The given name is consequential from adaptive moment estimation. This is a stochastic gradient based optimization algorithm used in various field of science and engineering [53]. The algorithm more focus on scalar parameter objective function requirement. This method needs very less memory to compute respective accommodate acquisition rates for various parametric quantity. It is versatile algorithm can scales high dimensional machine learning problems.
IV. PROJECTED FORECASTING MODEL
A multilayered deep learning forecasting model is proposed to predict stock price. The model uses multilayered structure of artificial neural network to make it more accurate and reduce convergence rate. The hidden layer structure as shown in Fig. 1 makes it random and blind. The parametric quantity of the framework are modified by using Adam’s optimizer which gives optimal parameter so that mean square error can be reduced.
The input of the model is financial time series feature vector as represented in equation (6). The output of is also a vector of values shown in equation (7). The bias represented in equation (8).
1 2
( , ,...., )
nX
x x
x
(6)1 2
( , ,...., )
kY
y y
y
(7)1 2
( ,
,...,
n)
(8)In the process of computation for hidden layer one a weight matrix W is formed it reflects the non-linear interaction between different persuading factors. The weight matrix W can be represented using equation (9).
Weight Matrix (W) =
11 12 1
21 22 2
31 32 3
1 2
..
...
. .
n n n
k k kn
W W
W
W W
W
W W
W
W W
W
(9) X
1
X
2
X
3
X
n
Ʃ
Ʃ
Ʃ
Ʃ
Ʃ
Ʃ
Ʃ
Ʃ
International Journal of Innovative Technology and Exploring Engineering (IJITEE) ISSN: 2278-3075, Volume-8 Issue-10, August 2019
Table 3: Description of different Data sets used in proposed model.
Name of Data
set Total Reco rds
No of Records for training
No of Records for Testing American
Airlines Group Inc
1762 1180 582
AbbVie Inc 1762 1180 582
AmerisourceBer gen Corp
1762 1180 582
Alliance Data System Corporation
1762 1180 582
Baxter
International Inc 1762 1180 582
Concho Resources Inc
1762 1180 582
Dominion
Energy Inc 1762 1180 582
Google 1762 1180 582
IBM 1762 1180 582
Yahoo 1762 1180 582
The proposed model takes input of different data set of different ranges so the input vectors need to be normalized using following eq (10).
min max min
(
) / (
)
Y
Y Y
Y
Y
(10)The standardization technique shown in eq (10) is normal process of scaling values in a certain range. This process is utilized to regularize stock data famed as feature scaling technique. The data shown in Table 3 are divided into training and testing data set for all data sets. The activation function used by model is sigmoid function as shown in eq (11).
1
( )
1
xS x
e
(11)
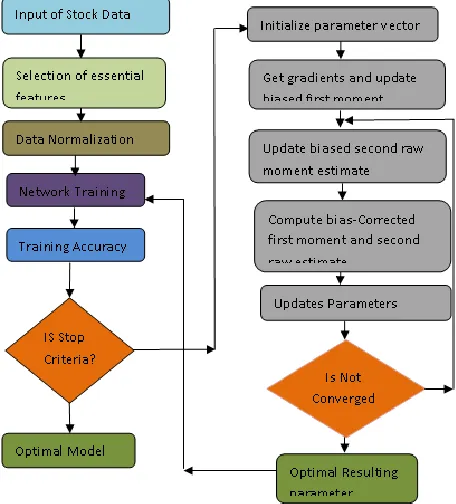
A. Working Process
Step 1 Data aggregation from share market then initialization.
Step 2 Verification and selection of data set extracted from the real data set by help of feature extraction
Step 3 Normalization of data in certain range using equation(10)
Step 4 Training of proposed Deep learning neural Network with data set.
Step 5 Training accuracy can be measured by using equation (13) and (14). Check for optimal parameters If not optimal then goto step 6.
Step 6 The parameter vector is initialize as input to adam optimizer to find optimum parameter.
Step 7 Get the gradient and update biased first moment then Update biased second raw moment estimate
[image:5.612.323.551.253.505.2]Step 8 Compute bias-Corrected first moment and second raw estimate to update the optimal parameter so that the model can give optimal result. After testing in optimal parameter the model can predict stock close value very efficiently.
Fig. 2 Represents wok flow of proposed model. V. RESULTANDDISCUSSION A. Experimental Result
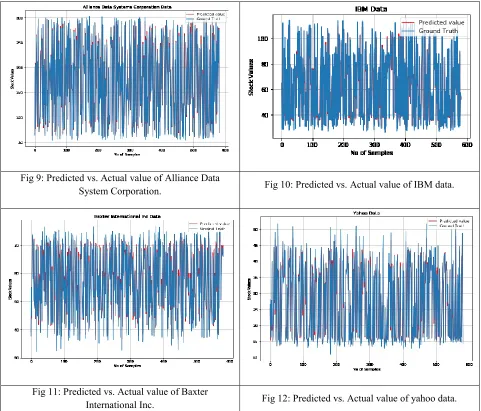
The predicted stock value is shown in red color and actual or ground truth is shown in blue color in result. The experiment is carried out in certain parameter values as shown in Table 4 depending on that value results are drawn.
The American stock data for year 2010 to 2016 of different sectors has been checked by this proposed model and the predicted vs. Actual result is shown in following figures which is very close to each other.
Fig 3: Predicted vs. Actual price American Airlines. Fig 4: Predicted vs. Actual stock price of Concho Resources Inc.
Fig 5: Predicted vs. Actual stock price of AbbVie Inc. Fig 6: Predicted vs. Actual stock price for Dominion Energy Inc.
Fig 7:Predicted vs. Actual value of Amerisource Bergen
[image:6.612.64.549.96.655.2]International Journal of Innovative Technology and Exploring Engineering (IJITEE) ISSN: 2278-3075, Volume-8 Issue-10, August 2019
Fig 9: Predicted vs. Actual value of Alliance Data
System Corporation. Fig 10: Predicted vs. Actual value of IBM data.
Fig 11: Predicted vs. Actual value of Baxter
International Inc. Fig 12: Predicted vs. Actual value of yahoo data.
B. Presentation Assessment
Average of input vector for data sets may be stated as test magnitude of n whose effort quantity for test data as given in equation (12). As per the outcome of the proposed model Y-hat is fixed of predicted amounts and Y is a set of actual amounts used for prophecy. So Mean Square error of the forecasting representation can be stated as in equation (13). The feat of projected reproduction can be evaluated by equation (14) and the parameters used are shown in table 4. The proposed illustration is estimated by subsequent equations.
1
1
ni i
Mean
X
n
(12)2
1
1
ˆ
(
)
n
i i
i
MSE
n
Y Y
(13)1
ˆ
1
(
)
ˆ
n
i i
i i
Y Y
MAPE
n
Y
(14)Table 4: Different parameters used in proposed Model. Sl.
No.
Parameter used Proposed Model
Value used in Model
[image:7.612.66.547.49.460.2]C. Comparison of Experimental Results
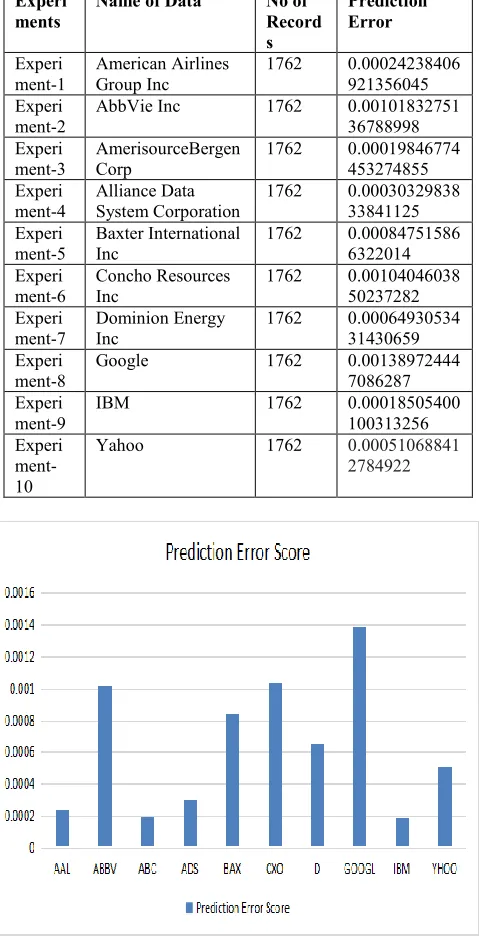
[image:8.612.319.556.82.301.2]The proposed model used to predict stock price of different data sets of different sectors under certain parameter values as shown in table 4 result of model varies slightly in terms of prediction error for different data sets. Each data is tested by the proposed model in an experiment and results are compared with different data as displayed in table 5 and figure 13. the comparison of results with other models is shown in table 6. Quality of the projected framework is much closed to actual values. So the proposed model is a good prediction model for stock price prediction as it suits any sector of stock data.
Table 5: Comparison of observations by proposed model obtained from different data.
Experi ments
Name of Data No of Record s
Prediction Error
Experi ment-1
American Airlines Group Inc
1762 0.00024238406 921356045 Experi
ment-2 AbbVie Inc 1762 0.0010183275136788998 Experi
ment-3 AmerisourceBergen Corp 1762 0.00019846774453274855 Experi
ment-4
Alliance Data System Corporation
1762 0.00030329838 33841125 Experi
ment-5
Baxter International Inc
1762 0.00084751586 6322014 Experi
ment-6 Concho Resources Inc 1762 0.0010404603850237282 Experi
ment-7 Dominion Energy Inc 1762 0.0006493053431430659 Experi
ment-8 Google 1762 0.001389724447086287 Experi
ment-9
IBM 1762 0.00018505400 100313256 Experi
ment-10
[image:8.612.321.557.86.300.2]Yahoo 1762 0.00051068841 2784922
[image:8.612.52.291.235.713.2]Fig 13: Prediction Error Scores by proposed model obtained from data sets
Table 6 : Result comparison of projected model with existing models
Sl
No. Authors Name Types of Data Prediction Accuracy
1 H.D Huynh et all [55]
Stock Market
Data 65%
2 Q.Mingyue et all [54] Market Stock Data
86.39%
3 B.Weng et all[56]
Stock Market
Data 98.13%
4 Das [Proposed]
Stock Market
Data 99.67%
VI. SUMMERYANDEMERGINGDIRECTIONS
This new multilayer deep learning approach is optimized by Adam optimizer to foresee close price of current day stock. This reproduction is a competent representation to forecast in time series data of different stock data of different sectors. From the results it is observed that prediction error is very less irrespective of data sets and sectors. The predicted value is very close to authentic value in a time series data. The parameters are best possible parameter for actual existence normalized data sets. The deep learning neural system is skilled, tested & authorized using normalized data sets. But the result is shown in actual range of stock data as listed in stock market. We accept as true that our demonstration is advanced one and ready for stock market prediction in real time. This working model can be suggested for use in any stock value prediction irrespective of sector. This experiment is carried out and tested in online Google Co lab Research lab with support of GPU and in python programming environment. This model can be extended to any field of research with modification of parameters as per requirement of proposed area. This prediction framework can be use as mobile app to predict any kind of price or value in any sector. But the integration may need some change in working model. The limitation of proposed representation is sudden change in stock price due to any economical or political or natural calamities cannot be predicted perfectly.
REFERENCE
1. Malkiel BG A random walk down Wall Street: the time-tested strategy for successful investing. WW Norton & Company (2007).
[image:8.612.52.294.240.708.2]International Journal of Innovative Technology and Exploring Engineering (IJITEE) ISSN: 2278-3075, Volume-8 Issue-10, August 2019
3. DOI: 10.1016/j.eswa.2014.07.040
4. Patel J, Shah S, Thakkar P, Kotecha K Predicting stock market index using fusion of machine learning techniques. Expert Syst Appl 42: (2015) 2162–2172. doi>10.1016/j.eswa.2014.10.031
5. Anbalagan T and Maheswari, Classification and prediction of stock market index based on fuzzy metagraph, Procedia Computer Science, 47 (2015) 214-221. doi.org/10.1016/j.procs.2015.03.200
6. M. Y. Chen and B. T. Chen. A hybrid fuzzy time series model based on granular computing for stock price forecasting, Information Sciences, 294 (2015) 227-241.
7. S. M. Chen and P.Y. Kao. TAIEX forecasting based on fuzzy time series, particle swarm optimization technique and support vector machines, Information Sciences, 247 (2013) 62-71. doi>10.1016/j.ins.2018.02.016
8. F. M. Talarposhti, H. J. Sadaei, R. Enayatifar, F. G. Guimares, M. Mahmud, T. Eslami, Stock market forecasting using a hybrid model of exponential fuzzy time series, International Journal of Approximate Reasoning, 70 (2016) 79 –98. DOI:10.1016/j.ijar.2015.12.011 9. L. Y. Wei, C.H. Cheng and H.H. Wu. A hybrid ANFIS based on-period
moving average model to forecast TAIEX stock, Applied Soft Computing, 19 (2014) 86-92. doi.org/10.1016/j.asoc.2014.01.022 10. F. Ye, L. Zhang, D. Zhang, H. Fujita, Z. Gong, A novel forecasting
method based on multi-order fuzzy time series and technical analysis,
Information Sciences, 367-368 (2016) 41 – 57.
11. S. M. Chen and W. S. Jian, Fuzzy forecasting based on two-factor second order fuzzy-trend logical relationship groups, similarity measures and PSO techniques, Information Sciences, 391-392 (2017) 65 – 79. DOI:10.1109/TSMCB.2012.2223815
12. X. Zhong and D. Enke, A comprehensive cluster and classification mining procedure for daily stock market return forecasting,
Neorocomputing, 267 (2017) 152 – 168.
DOI10.1016/j.neucom.2017.06.010
13. Park, K., & Shin, H. Stock price prediction based on a complex interrelation network of economic factors. Engineering Applications of Artificial Intelligence, 26, (2013) 1550–1561. DOI 10.1016/j.engappai.2013.01.009
14. Shin, H., Hou, T., Park, K., Park, C.-K., & Choi, S. Prediction of movement direction in crude oil prices based on semi-supervised learning. Decision Support Systems, 55, (2013) 348–358. doi.org/10.1016/j.intele.2017.02.001
15. Kia, A. N., Haratizadeh, S., & Heshmati, Z. Analysis and prediction of fluctuations for sector price indices with cross correlation and association based networks: Tehran stock exchange case. Bonfring International Journal of Industrial Engineering and Management Science, (2016) 37-95.
16. Narayan, P. K., Sharma, S. S., & Thuraisamy, K. S. Can governance quality predict stock market returns? new global evidence. Pacific-Basin Finance Journal, 35, (2015) 367–380. DOI: 10.1016/j.pacfin.2015.02.007
17. R. Efendi, M. M. Deris and Z. Ismail, Implementation of fuzzy time series in forecasting of the non-stationary data, Int. Journal Computation Intelligence and Applications, 15 (2016) 50-60. doi.org/10.1142/S1469026816500097
18. J. Watada, Fuzzy time-series analysis and forecasting of sales volume,
Fuzzy Regression Analysis, (1992) 211 -227. DOI10.1016/j.bbe.2017.01.003
19. J. Watada, S. Wang and W. Pedrycz. Building confidence-interval based fuzzy random regression models, IEEE Trans. Fuzzy Systems, 17 (6) (2009) 1273 –1283. doi.org/10.1109/TFUZZ.2009.2028331 20. N. Arbaiy and J. Watada. Linear fractional programming for fuzzy
random based possibilistic programming problem, Int. J. Simulation Systems Science and Technology, 14 (2) (2014) 24 – 30. DOI.org/10.1007/978-3-319-13153-5_9
21. R. Efendi, N. Arbaiy and M. M. Deris, Indonesian-Malaysian stock models using fuzzy random auto-regression, Proceeding Seminar Nasional Teknologi Komunikasi dan Industri, (2017) 604-611. DOI: 10.1016/j.ins.2018.02.016
22. L. Shao, Y.-H. Tsai, J. Watada and S. Wang. Building fuzzy random autoregression model and its application, J. Watada et al., (Eds):
Intelligence Decision Technology 1 SIST, (15) (2012) 155 – 164. doi.org/10.1007/978-3-642-29977-3_16
23. H. Vata Arani and S. A. Torabi, Integrated material-financial supply chain master planning under mixed uncertainty, Information Sciences, 423 (2018) 96– 114. DOI 10.1016/j.ins.2018.02.016
24. B. Zahiri, P. Jula and R. T. Moghaddam, Design of a pharmaceutical supply chain network under uncertainty considering perishability and substitutability, Information Sciences, 423 (2018) 257 – 283. DOI 10.1016/j.ins.2017.09.046
25. Gurusen E, Kayakutlu G, Daim TU Using artificial neural network models in stock market index prediction. Expert Syst Appl 38 (2011) 10389–10397. DOI:10.1016/j.eswa.2011.02.068
26. Aboueldahab T, Fakhreldin Md , Prediction of stock market indices using hybrid genetic algorithm/particle swarm optimization with perturbation term. In: International Conference on swarm intelligence (ICSI 2011), Cergy, (2011) 14–15.
27. Göçken M, Özçalıcı M, Boru A, Dosdoğru AT Integrating metaheuristics and artificial neural networks for improved stock price prediction. Expert Syst Appl 44: (2016) 320–331. DOI 10.1016/j.eswa.2015.09.029 28. Lam AYS, Li VOK, Yu JJQ Real-coded chemical reaction optimization.
IEEE Trans Evol Comput 16(3): (2012) 339– 353.doi.org/10.1155/2018/8042689
29. Nayak J, Naik B, Behera HS A novel chemical reaction optimization based higher order neural network (CRO-HONN) for nonlinear classification. Ain Shams Eng J. (2015). https ://doi.org/10.1016/j.asej.2014.12.013
30. Nayak SC, Misra BB, Behera HS artificial chemical reaction optimization of neural networks for efficient prediction of stock market indices. Ain Shams Eng J. (2015) doi.org/10.1016/j.asej.2015.07.015
31. Nayak SC, Misra BB, Behera HS (2017a) efficient financial time series prediction with evolutionary virtual data position exploration Neural Comput App, (2017) l1–22.
32. https ://doi.org/10.1007/s00521-017-3061-1
33. Castillo, O., Melin, P.: Simulation and forecasting complex financial time series using neural networks and fuzzy logic. In: Proceedings the IEEE the International Conference on Systems, Man and Cybernetics, vol. 4, (2001) 2664–2669. doi.org/10.1007/978-3-540-24855-2_120
34. Kehagias, A., Petridis, V.: Predictive modular neural networks for time series classification. Neural Netw. 10(1), 31–49 (2000), 245–250. doi: 10.1109/TNN.2002.804288
35. Maguire, L.P., Roche, B., McGinnity, T.M., McDaid, L.J.: Predicting a chaotic time series using a fuzzy neural network. Inf. Sci. 112(1–4), (1998) 125–136. doi.org/10.1016/S0020-0255(98)10026-9
36. Melin, P., Castillo, O., Gonzalez, S., Cota, J., Trujillo, W., Osuna, P.: Design of Modular Neural Networks with Fuzzy Integration Applied to Time Series Prediction, vol. 41/2007, (2007) 265–273. Springer, Heidelberg. doi.org/10.1007/978-3-319-67946-4_6
37. Jang, J.S.R., Sun, C.T., Mizutani, E.: Neuro-Fuzzy and Soft Computing. Prentice Hall (1996)
38. Sollich, P., Krogh, A.: Learning with ensembles: how over-fitting can be useful. In: Touretzky, D.S., Mozer, M.C., Hasselmo, M.E. (eds.) Advances in Neural Information Processing Systems, Denver, CO, vol. 8, (1996) 190–196. MIT Press, Cambridge, MA.
39. Hansen, L.K., Salomon, P.: Neural network ensembles. IEEE Trans. Pattern Anal. Mach. Intell. 12 (10), (1990) 993–1001. doi.org/10.1109/34.58871
40. C.H. Aladag, U. Yolcu, E. Egrioglu, A.Z. Dalar, A new time invariant fuzzy time series forecasting method based on particle swarm optimization, Appl. Soft Comput. 12 (2012) 3291–3299. doi.org/10.1016/j.asoc.2012.05.002
41. A.-S. Chen, M.T. Leung, Regression neural network for error correction in foreign exchange forecasting and trading, Comput. Oper. Res. 31 (2004) 1049–1068.
42. N.G. Pavlidis, D.K. Tasoulis, M.N. Vrahatis, Financial forecasting through unsupervised clustering and evolutionary trained neural networks, in: Proceedings of 2003 Congress on Evolutionary Computation, CEC'03, volume 4, Canberra, Australia, 8–12 Dec,( 2003), 2314–2321.
43. M. Rout, B. Majhi, R. Majhi, G. Panda, Forecasting of currency exchange rates using an adaptive ARMA model with differential evolution based training, J. King Saud. Univ. - Comput. Inf. Sci. 26 (2014) 7–18. DOI 10.1016/j.jksuci.2013.01.002
45. B. Majhi, C.M. Anish, Multi objective optimization based adaptive models with fuzzy making for stock market forecasting. Neuro Comput. 167(2015), 502–511. https://doi.org/10.1016/j.neucom.2015.04.044
46. R. Bisoi, P.K. Dash, A hybrid evolutionary dynamic neural network for stock market trend analysis and prediction using unscented Kalman filter. Appl. Soft Comput. 19, (2014),41–56.
47. https://doi.org/10.1016/j.asoc.2014.01.039.
48. M. Senapati, S Das, S.N. Mishra, A Novel Model for Stock Price Prediction Using Hybrid Neural
49. Network, J. Inst. Eng. India Ser. B, Springer, (2018) . https://doi.org/10.1007/s40031-018-0343-7
50. C. Krauss, X.A. Do, N. Huck, Deep neural networks, gradient-boosted trees, random forests: statistical arbitrage on the s&p 500, Eur. J. Oper. Res. 259 (2) (2017) 689–702. DOI: 10.1016/j.ejor.2016.10.031 51. J.-F. Chen, W.-L. Chen, C.-P. Huang, S.-H. Huang, A.-P. Chen,
Financial time-series data analysis using deep convolution neural networks, in: 20167th International Conference on Cloud Computing and Big Data (CCBD), IEEE,(2016), 87–92.
52. T. Fischer, C. Krauß, Deep Learning with Long Short-term Memory Networks for Financial Market Predictions, Tech. Rep., FAU Discussion Papers in Economics, (2017). //EconPapers.repec.org/RePEc:zbw:iwqwdp:112017
53. Chong E, Han C, park FC, Deep learning Networks for stock market analysis and prediction: methodology, data representation and case studies, Expert System Appl 83: 187-205, (2017). DOI:10.1016/j.eswa.2017.04.030
54. Heaton JB, polson NG, witte JH, Deep learning for finance: deep portfolios, Appl stoch models Bus Ind 33(1) (2017), 3-12. https://doi.org/10.1002/asmb.2209
55. S.C. Nayak, B.B Mishra, H.S Behera, ACFLN: artificial chemical functional link network for prediction of stock market index, Evolving systems,pp (2018) . DOI: 10.1007/s12530-018-9221-4
56. [52] D.P Kingma, J.L Ba, Adam: A method for stochastic optimization, conference ICLR (2015).
57. Mingyue, Q., Cheng, L., & Yu, S. Application of the Artifical Neural Network in predicting the direction of stock market index. In 2016 10th International Conference on Complex, Intelligent, and Software Intensive Systems (CISIS), IEEE (2016) (pp. 219–223).
58. H. D. Huynh, L. M. Dang, and D. Duong, “A new model for stock price movements prediction using deep neural network,” in Proceedings of the Eighth International Symposium on Information and Communication Technology. ACM, (2017) , pp. 57–62.
59. Weng, B. , Tsai, Y.-T. , Li, C. , Barth, J. R. , Martinez, W. , & Megahed, F. M. (2017). An ensemble based approach for major U.S. stock and sector indices prediction. Ap- plied Soft Computing . Under Review
60. Das, S.,Mishra, Senapati, M.R., (2018)A Novel Model for Stock Price Prediction Using Hybrid Neural Network ,Journal of Institute of Engineering India Series-B, Springer.
AUTHORS PROFILE
Sumanjit Das Presently working as PhD scholar under BPUT Rourkela, Odisha. He has published 10 number of papers in journals and presented papers in 4 international conference. The research area is Artificial Intelligence, Data Mining.