International Journal of Innovative Technology and Exploring Engineering (IJITEE) ISSN: 2278-3075, Volume-8 Issue-10, August 2019
Abstract: Occupancy of seats/chairs in places like cafeteria, occupancy in meeting room is a key factor in offices having thousands of employees, it is often convenient to know the number of seats occupied in cafeteria and availability of meeting room in IT companies before he/she visits. There is an IoT wave sweeping the technology arena. Internet of Things (IoT) is the amalgamation of all physical nodes using internet as medium. The nodes communicate with each other over internet and allows to control or get controlled by the click of a button. Various sensor in the market can detect occupancy of the seat and the meeting room with low cost systems. The objective of the present paper is to study number of people occupied the seats in cafeteria and displayed occupied and unoccupied seats on web browser for user information, collecting those data for some period and use the data to display seat occupancy at different points of time. The above objective is achieved using shell scripts running on linux machine used to simulate the occupancy of chairs/seats in cafeteria and occupancy of meeting rooms which is communicated to webserver via IoT.
Index Terms: Shell scripts, IoT, webserver, occupancy sensor.
I. INTRODUCTION
Effective use of workplace and public resources such as conference rooms, dining halls can be made easier with the usage of technology that harnesses the power of smart sensors and small microcontrollers with wireless connectivity. These devices are inexpensive, have low power requirements and are easy to install in an existing infrastructure without the need to have additional support in terms of rewiring. Such frameworks are also flexible and can be used in a variety of applications given the availability of a wide variety of sensors, for monitoring (and controlling) various aspects of an infrastructure. Ergonomics in Chinese university cafeteria simulated by siemens jack is explained in [1]. In [2], explains room occupancy in smart campus using WiFi soft sensors by using metadata in WiFi activity integrated with intelligent machine learning techniques to address the challenges in WiFi connectivity data to estimate the occupancy in classrooms with large number of occupants in a university campus. In [3], explains the development of customizable crowd sensing system for public spaces such as a study area of a library with limited seating or a pool area.
In [4], explains the IoT based smart meeting space with real-time room occupancy using zigbee technology. In [5],
Revised Manuscript Received on August 03, 2019.
Dr. U B Mahadevaswamy, Professor, Department of Electronics and communication, Sri Jayachamarajendra College of Engineering, Mysuru, Karnataka, India.
Gurudutt M S, M.Tech in VLSI Design and Embedded systems, Sri Jayachamarajendra College of Engineering, Mysuru, Karnataka, India.
estimation of occupancy in a multi-room office building based on CO2 concentration using Bayesian MCMC method. Detection of seat occupancy using wireless inductive sensor with improved version is described in [6]. A IoT based Real Time smart parking system in street with street parking algorithm is described in [7]. In [8], deconvolution method is used to estimating room occupancies in a medium-sized room instrumented using standard HVAC measurement. In [9], presents the IoT-based platform deployed in the CEI Moncloa campus, putting special emphasis on the main technological challenges that were faced and on the solutions that were adopted, as well as on the functionality, services and potential that the platform offers. In [10], presents the combined inductive-capacitive sensor and its application to seat occupancy sensing achieved by a suitable signal conditioning unit based on carrier frequency principle. In this work, we are collecting the information of occupied and unoccupied seats in cafeteria, availability of meeting rooms in a building or workspace and displaying on web browser so that, based on the availability one can decide their visit over there. The work also covers statistical data collected and stored for some period and collected data would be useful to analyze the magnitude of crowd versus time, food supplied versus food waste, the time each seat was occupied at different point of time. This paper in future can be extended to guide the user towards the empty seat in big cafeteria or hall which is very much user friendly.
II. PROBLEM STATEMENT
In mostly crowded places like MNC companies, there is a challenge to get a seat/chair in cafeteria at peak hours, people use to stand with a food plate on their hands before the chair expecting to get free and in big dining hall it hard to make out chairs/seats which is free. Also, meeting rooms which were booked in advanced sometime wouldn’t be used efficiently, when people booked the meeting room, but none of them had a meeting in that room. The objective of this work is to simulate occupancy of chairs/seats in cafeteria and occupancy of meeting rooms in multi storied building having 10 floors, 12 meeting rooms in each floor and a cafeteria in ground floor.
III. METHODOLOGY
A. MQTT Protocol
MQTT is a simple lightweight UDP based protocol that is used as a standard protocol for IoT.
IoT Based Occupancy Detection using Wireless
Controller in a Building/Workspace
The protocol follows a publish/subscribe model where nodes participating can publish events called ‘topics’ and subscribe to the topics that they are interested in. The topics are simple UTF-8 strings with multiple sub-strings separated by a ‘/’ separator and the substrings can be arranged to denote the location, identification and type of the topic.
There are two roles in MQTT protocol:
1. Client – which publishes their topics, subscribe to the broker for topics of interest to them and listens to the topics
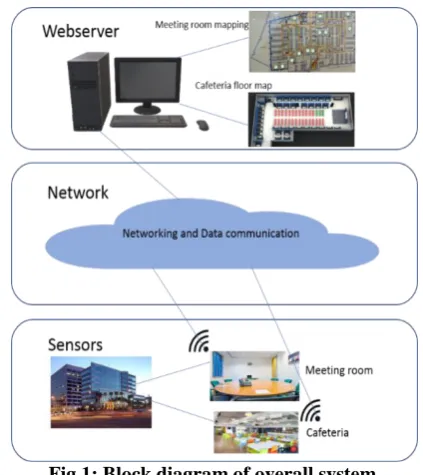
[image:2.595.62.274.210.448.2]2. Broker – which listen to topics from all clients and relay them to the clients that have subscribed to the topics.
Fig 1: Block diagram of overall system B. Webserver
Webserver is a piece of software to satisfy the incoming request from world wide web client. The web server processes incoming network request over HTTP and other protocols. These is usually delivered as HTML documents, which includes images, style sheets and scripts. For the demo purpose, “node js” is used as the server and “web browser” as a client. The server here has two parts one runs and listens to user events triggered on frontend communicated via rest APIs. Another named as thin UI server, listens for the external events to serve the web application. All the UI related code are done in visual studio code IDE. AngularJS is used to extend HTML view which is quick to develop and relatively faster. As depicted in above block diagram the webserver listens to the events in specific port, stored current status of UI into the data base and sends this information whenever client request and displays the UI. For the project, the occupancy of chairs/seats in cafeteria and occupancy of
meeting rooms are displayed in RED/GREEN
(occupied/free) color on the floor map of that particular floor in the building.
C. Sensors simulated in shell scripts
A shell script is a computer program designed to be run by the Unix shell, a command-line interpreter. The various dialects of shell scripts are considered to be scripting languages. Typical operations performed by shell scripts include file manipulation, program execution, and printing
text. Unix/Linux system invariably also include the C shell (csh), Bash (bash), a Remote shell (rsh), a secure shell (ssh)for ssl connection. The oldest shell and still in common use is the Borne shell (sh), which is used for the sensors simulation. The Unix/Linux system installed with MQTT client to publish the simulated data to webserver. The shell script is coded for in such a way that, the sensors data are published at different point of time based on the objective of this paper.
IV. SIMULATION AND TEST RESULTS There would be lot many seats/chairs in the cafeteria and many meeting rooms are available in a building, for our demo
purpose, the paper shows simulation of
International Journal of Innovative Technology and Exploring Engineering (IJITEE) ISSN: 2278-3075, Volume-8 Issue-10, August 2019
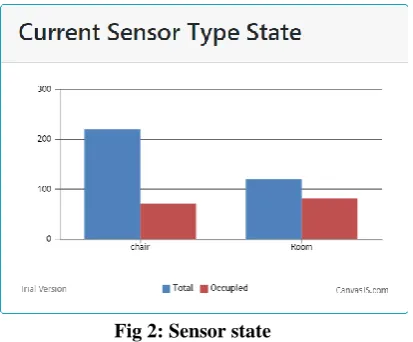
Fig 2: Sensor state
[image:3.595.72.279.50.221.2]Once the user got to know some meetings rooms are free, user can check availability of meeting rooms in specific floor from the “Floor sensor details” as shown in Fig 3. In Fig 3, the 2nd column shows total number of meeting rooms and 3rd column shows number of free meeting rooms. For instance, from the Fig 3, “floor7” has 2 meeting rooms are free out of 12. On clicking the hyperlink “floor7”, it navigates to floor map of floor 7. Which is shown in Fig 4.
Fig 3: Floor sensor details
[image:3.595.317.523.269.419.2]Fig 4 shows floor map of particular floor with indication of meeting rooms availability. “RED” colour shows occupied meeting rooms and “GREEN” colour shows free meeting rooms. Also, this floor map becomes a guide for the user to access the meeting rooms easily.
Fig 4: Floor map of a floor to point meeting rooms Also, from the history data, one could see when all the meeting rooms were occupied at different points of time, as depicted in Fig 5, mostly this would be useful for admins or facility teams.
Fig 5: Seat occupancy at different points of time The results are simulated for occupancy of chairs/seats in cafeteria at different scenarios are depicted and discussed below. In the morning, there is around 40% of seat occupied as shown in Fig 6, as shown in Fig 8, the seat occupancy starts increasing linearly and approximately at 8.50AM to 9.00AM it reaches to peak above 80, seats were gradually freed up as the time goes.
[image:3.595.324.540.539.707.2]Fig 7: Sensor state
[image:4.595.74.277.54.383.2]Fig 8: Seat occupancy at different points of time At afternoon, the inflow of the people starts increasing, as shown in Fig 11, approximately between 12.30PM and1.05PM the seats were fully occupied, and people would have to wait to get a seat. Also, between 1.15PM to 1.35PM the seats were getting freed and occupied again, hence, in the graph there is a drop from peak to below 200, raises again and reached to 100% peak level. And seats kept gradually freeing after 1.35PM, meaning amount of people were reduced. The seat occupied at peak level is shown in Fig 9 in a floor map.
Fig 9: Floor map of cafeteria at peak level
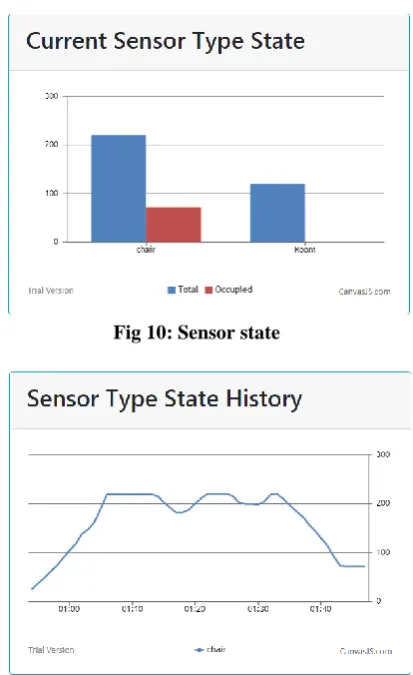
Fig 10: Sensor state
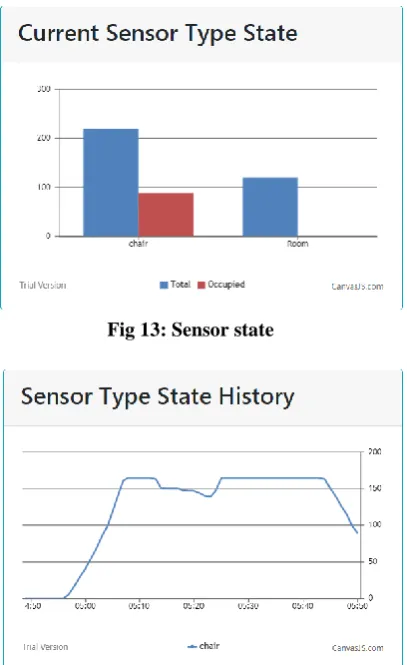
[image:4.595.327.537.501.673.2]Fig 11: Seat occupancy at different points of time At evening, it’s a snacks time where there is not fully crowded as shown in Fig 12, the seat occupancy is about 60-70%. As shown in Fig 14, approximately at 4.55PM the people inflow increases and reached to peak above 150 numbers and there was a drop at 5.10PM, then raises again, at 5.45PM number of people starts decreasing and become less crowded.
[image:4.595.68.279.532.694.2]International Journal of Innovative Technology and Exploring Engineering (IJITEE) ISSN: 2278-3075, Volume-8 Issue-10, August 2019
Fig 13: Sensor state
[image:5.595.42.284.471.728.2]Fig 14: Seat occupancy at different points of time Table I shows the comparison of existing system with that of proposed system
Table I: Comparison between Existing and Proposed system
Parameters Existing system Proposed system Technologies Soft Wi-Fi
sensors [2] Camera [3] Zigbee [4]
Wi-Fi Access point/hotspot
Network IoT [3][4] IoT
Meeting room occupancy
CO2 distribution [5]
Meta data smart phone [2] Data are simulated using shell script considering PIR sensor Specific chair occupancy in cafeteria Not implemented Implemented User friendly GUI with history data and graphs
Not
implemented
Implemented
V. CONCLUSION AND FUTURE SCOPE As explained in this paper, the system uses simple low-cost occupancy sensor connected to low cost controller which senses a seat or chair occupied or not and sends the information via IoT through MQTT protocol. Finally, the seat status (occupied or not) on the GUI will get displayed after receiving and parsing the MQTT message from the controller. With this solution, people can schedule their breakfast/lunch/snack time before going to cafeteria. Similar solution holds good for meeting rooms as well, where motion sensor is used to sense the occupancy of the room.
In the future work, the above solution would become a framework where with little modification it could be expanded to various application, following are some of them: 1. Additional value adds such as guidance towards an available seat through light indicators or through a navigation map in a smart phone making user friendly. 2. Monitoring health, safety and operating conditions of lab
equipment can be done using multitude of sensors such as vibration, smoke, temperature and humidity. The framework can also have control mechanisms such as relays that can be used to remotely control parameters such as fans/air conditioning and turn on/off equipment. 3. Access control using RFiD readers. The use of RFiD
readers to control access to infrastructure is well known. However, they need to be wired to the network. With this framework, it can be easily integrate the RFiD readers without the need for cabling for network access.
REFERENCES
1. J.W. NIU1,_*, X.H. ZHENG2,3, L. ZHANG1, S. Y. XU1, X. LI1, S. S. GUO1, S.T. DING2, Investigation of Ergonomics in Chinese University Cafeterias’ Working Situation at Peak Hours Using Jack, Department of Logistics Engineering, University of Science and Technology Beijing, Beijing, China, Institute of Chemical Defense of CPLA, Beijing, China and School of Biological Science and Medical Engineering, Beijing University of Aeronautics and Astronautics, 2011 IEEE.
2. Iresha Pasquel Mohottige and Tim Moors, “Estimating Room Occupancy in a Smart Campus using WiFi Soft Sensors”, Sydney, Australia, 2018 IEEE 43rd Conference on Local Computer Networks 3. Ryutaro Kobayashi and Pauline N, Kawamoto, “On the Development of
Customizable Crowd Sensing System for Public Spaces using IoT Cloud Services”, Shinshu university, Japan 2018 IEEE
4. Jaimin Patel and Gaurang Panchal, “An IoT-Based Portable Smart Meeting Space with Real-Time Room Occupancy”, Institute of Technology, Changa, India, Springer Nature Singapore Pte. Ltd. 2018 5. Haolia Rahman, Hwataik Han, “Bayesian estimation of occupancy
distribution in a multi-room office building based on CO2 concentrations”, Kookmin University, 77 Jeongneung-ro, Seongbuk-gu, Seoul. 136-702, R.O. Korea, Tsinghua University Press and Springer-Verlag GmbH Germany 2017
6. Milica G. Kisic, Nelu V. Blaz, Kalman B. Babkovic, Ljiljana D. Zivanov, and Mirjana S. Damnjanovic “Detection of Seat Occupancy Using a Wireless Inductive Sensor”, Faculty of Technical Sciences, University of Novi Sad, 21000 Novi Sad, Serbia, April 2017, VOL. 53, NO. 4
7. Pradeep Tomar, Gurjit Kaur and Prabhjot Singh, , “A Prototype of IoT-Based Real Time Smart Street Parking System for Smart Cities”, Springer International Publishing AG 2018
9. Manuel Alvarez-Campana, Gregorio López, Enrique Vázquez, Víctor A. Villagrá and Julio Berrocal, “Smart CEI Moncloa: An IoT-based Platform for People Flow and Environmental Monitoring on a Smart University Campus”, Madrid, Spain, December 2017
10. Boby George, Member, IEEE, Hubert Zangl, Member, IEEE, Thomas Bretterklieber, Member, IEEE, and Georg Brasseur, Fellow, IEEE, “A Combined Inductive–Capacitive Proximity Sensor for Seat Occupancy Detection”, IEEE May 2010
11. Wireless access point, Nokia
https://www.nokia.com/networks/solutions/smart-wi-fi/ 12. Related to MQTT protocols information, mqtt.org
13. Mosquitto, an open source MQTT broker https://mosquitto.org/ 14. Related to shell script reference link is
https://www.tutorialspoint.com/unix/shell_scripting.htm
AUTHORS PROFILE
Dr. U B Mahadevaswamy has completed his B.E Degree in Electronics and communication in the year 1988 from the university of Mysore, M.Tech in industrial Electronics in the year 1995 from Mangalore University, and obtained PhD in Electronics from University of Mysore in the year 2013. He is presently working as Professor in the Department of Electronics and Communication at Sri Jayachamarajendra College of Engineering Mysuru, Karnataka, India. He has authored several textbooks and published many technical and research papers in international Journals and Conferences. His research interest includes the topics: Wireless Sensors Networks, VLSI Design, Embedded Systems, and Digital Signal Processing.