Abstract: Throughout the world breast cancer has become a common disease among the women and it is also a life threatening diseases. Machine learning(ML) approach has been widely used for the diagnosis of benign and malignant masses in the mammogram. In this manuscript, I have represented the theoretical research and practical advances on various machine learning techniques the diagnosis of benign and malignant masses in the mammogram. The objective of this manuscript is to analyze the performance of distinct machine learning techniques used in the diagnosis of the Digital Mammography Image Analysis Society (MIAS) database. In this work I have compared performance of four machine learning approaches i.e. Support Vector, Naive Bayes, K-Nearest Neighbours and Multilayer Perceptron. The above four types of machine learning algorithm are used to categorize mammograms image. The achievements of these four techniques were recognized to discover the most acceptable classifier. On the end of the examine, derived outcomes indicates that support vector is a successful approach compares to other approach.
Keywords: Breast Cancer, K-Nearest Neighbours (KNN), Multi Layer Perceptron(MLP), Malignant, Naive Bayes(NB),Support Vector Machine (SVM).
I. INTRODUCTION
The rate of breast cancer is moderate in India, but its rate is increasing day by day. It is the usual form of cancer among urban women in India. Scarcity of awareness of this cancer and the unavailability of screening approach, almost all the cases of cancer in the breast are not recognized at an incredibly improved step [1].
Breast cancer is the common cause of cancer among women. The chance of survival is more in the case of premature diagnosis of breast cancer [4]. Till now, mammogram has been proven as a fruitful screening approach used in the identification of masses in the breast [5]. The main difficulty in the analysis of mammograms is of poor contradiction between usual tissues and lesions, which creates it unsuitable to differentiate malignant from benign masses [6]. Therefore, an intelligent computer-aided diagnosis (CAD) approach is essential for helping radiologists to identify masses in mammographic pictures in a better way [7], [8].
The medical image is one of the pertinent sources of information that is used in the diagnosis and treatment of cancer. As medical data are not easily interpretable, it needs the use of a CAD system. The CAD system aims to provide accurate, objective and reproducible mammogram
Revised Manuscript Received on August 05, 2019.
Sushreeta Tripathy, Department of Computer Science & Information Technology, S ’O’ A Deemed to be University, Bhubaneswar, India.
.
interpretation procedures [9]. Divergent approaches have already been initiated to enhance the accuracy of the automatic classification of mammograms. The common CAD system includes image acquisition, pre-processing of the acquired image, segmentation, followed by removing descriptors of ROI and lastly classify into abnormal (benign and malign) or normal mammogram [10]
Various manuscripts suggest learning methods to resolve the masses identification problem. Edwards, et. al. [11] develop the MC diagnosis as a oversaw complication and employed a Bayesian grid to recognize accurate MC among diverse candidates obtained by a introductory review of the mammogram. Other learning methods suggested by Yang, et. al. [12], who evaluated the possibility to apply support vector to improve the identification of masses in mammogram. Tripathy, S. et. al. apply existing four divergent filters i.e MF, WF, MF, LF for removing noise in mammogram at the preprocessing stage to achieve high accuracy [13]. Brijesh et.. al. [14] used a cluster neural network. The highest category accuracy achieved by this method becomes 93% on mammograms choose from DDSM. Novel load improved multi-stage perceptron based classifier with a genetic rule is suggested for the identification of masses in the breast picture. Classification accuracy is claimed to have significantly enhanced by 10.53% as compared to the traditional multi-layer network [15].
The rest of the manuscript is organized as section II which represents different methods used in breast image classification along with its framework. In Section III I have analysis the performance of different classifier models on breast image which is stored in MIAS dataset, and section IV concludes the observation.
II. MATERIALANDMETHODS
Currently, digital mammography has been used as an alternative of film mammography, to diagnosis breast cancer. It allows for the radiologist to captures and manipulates the mammograms, such that abnormal masses are easily visible [16], [17], [18], [19].
The mammogram is used for the investigation of breast symptoms as well as for screening asymptomatic women.
Performance Evaluation of Several Machine
Learning Techniques Used in the Diagnosis of
Mammograms
Fig. 1 CAD system used for identification of masses in the breast.
Fig. 1 shows general breast image classification steps. First input mammograms from a specific database and apply different pre-processing techniques, after that applied different statistical feature extraction techniques to extract relevant and non-redundant features[20]. Most of the authors have used shape & texture features to extract knowledge from the pictures and based on this relevant information the classifier achieves maximum accuracy. Now I have used a different classifier to classify the masses either in benign or malignant groups [21].
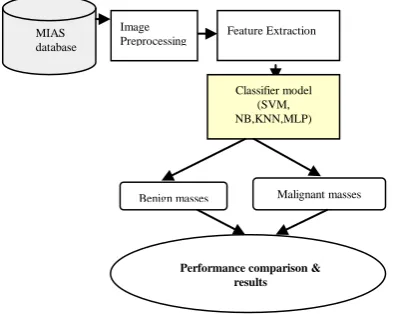
In this observation, a mini-MIAS dataset has been used [22]. During this study it is observed that most of the authors have followed some basic steps to diagnosis benign and malignant masses in mammogram images. The overall procedure represents in Fig.2.
Fig. 2 Framework of the proposed diagnosis scheme used for breast cancer identification
Fig.2 represents detailed steps for the diagnosis of cancerous tissues in a mammogram. Though the original image in mini-MIAS is large in size I have resized the mammogram for easy computation. Then I have used different filtering for noise removal and used global thresholding techniques to extract the affected area in mammograms. To avoid redundancy, most of the authors have used statistical features extraction techniques to extract features of the affected area. Finally, these features are introduced to different classifier to identify affected and non affected cancer in a mammogram.
A. Data set Used
Doctors and physicians are reliant on X-ray, MRI and ultrasound to find the present status of breast cancer. However, to ease the doctors’ task, some researchers have investigated how to use computers more reliably for identification of malignant masses. To make a genuine judgement about the malignant outcome, researchers have always focused on their investigations on some well-established picture databank. Different institutions have introduced image databanks which are accessible by experimenters for more advanced exploration [23].
Table 1 Accessible image databases, with some description
Databank No. of pictur es
Size (GB)
Techniques used for capturing image
Picture type
Overall sufferer s
MIAS 322 2.3 mammogram 161
DDSM mammogram 2620
CBISDDS M
10239 163.6 Mg (modalities)
DICOM 6671
BCDR Mammogram 1734
INbreast 410 Mammogram 115
[image:2.595.85.282.435.592.2]Image appearance of divergent databases are dissimilar from each other. Few of the images are in JPEG format and few others hold DICOM. The MIAS, DDSM, and In-breast carry mammogram pictures. Out of these databases, I have mainly focused on mini-MIAS database. Dissimilar cases accessible in MIAS database are appeared in Table 2. In this dataset total 322 left and right breast images of 161 patients have been taken.
Table 2. Represents different pictures stored in MIAS data bank
Cases total
mammogram
benign Malignant
microcalcification 25 12 13
circumscribed 23 19 4
speculated 19 11 8
ill-defined 14 7 7
architectural distoration 19 9 10
asymmetry lession 15 6 9
normal 207 - -
overall 322 64 51
Out of the 322 mammograms, 64 benign, 51 malignant and 207 normal pictures are considered for performance assessment.
B. SVM Classifier
One of the well built and advanced supervised learning technique is SVM which is based on statistical learning approach. It become first off recommended through Vapnik, et.al.[24] from his unique effort on decreasing structural hazard. Basic principles of SVM are shown in Fig. 3. In case of nonlinearly separable data, the algorithm runs by means of mapping the input area to
high rise attribute area, Feature Extraction
MIAS database
Image Preprocessing
Classifier model (SVM, NB,KNN,MLP)
Benign masses Malignant masses
Fig. 3 linear support vector hyper plane formation SVM initiate the idea of ‘margin’ on both support of a hyper aircraft that partitions the two classes. Expanding the margins and hence construct the most important feasible gap among the isolating hyper plane and the samples on both side is verified to minimize a higher bound at the anticipated generalization errors.
C. NB Classifier
This is a common technique used in supervised learning. Naive bayes (NB) is a fast technique for the formation of a statistical predictive prototype. This type approach analyses the relationship among every characteristic and the category for every instance to derive a conditional hazard chance for the relationships between the features utility and the class. At the training stage, the possibility of all magnificence is evaluated by counting how frequently it happens inside the databank which is already trained [25].
NB is speedy, easy to put into effect with the easy shape and fruitful. It's also useful for excessive dimensional facts because the possibility of every characteristic is envisioned separately [26].
Let A signify the class of an observation O. To estimate the class of the observation O through the usage of Bayes rule, the highest posterior probability is:
) (
) ( ) ( ) (
O P
A O P A P B A
[image:3.595.63.272.54.210.2]P (1)
Fig.4 Naive Bayes.
In Fig. 4 Bayes classifier, belief that
attributes are conditionally self-supporting of each other of a specific class.
D. K-Nearest Neighbours
K-Nearest Neighbours is a technique for grouping entity primarily based on nearest training samples in the attribute area. In this approach an item is categorized by means of a bulk of vote of its surroundings, with an item being assigned to the class not unusual among its k- nearest friends. The
closest neighbour is formulated to classify the picture. The category is executed via minimal distance measure [27], [28]. It allow s to take into account p=(a1, b1) and q=(a2, b2) are two points. Now calculate distance using Euclidean formula:
1/22 1 2 2
1
)
(
)
(
)
,
(
p
q
a
a
b
b
d
(2)E. Multilayer Perception Classifier
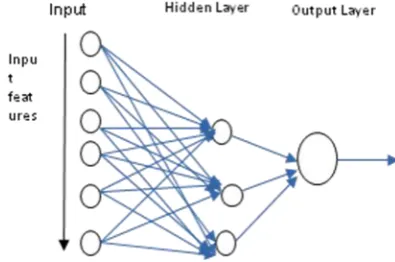
Multilayer perceptrons (MLP) based on feed-forward networks skilled with the standard propagation rules. They are supervised networks so that they require a favoured reaction to be trained. They learn how to remodel entering data right into the desired feedback, so they are extensively used for Pattern Classification. With one or more unseen layers, they can approximate truly any input-output map. They've been proven to approximate the performance of most desirable statistical classifiers in tough issues. Maximum neural network approach contains MLP [29].
[image:3.595.324.522.274.405.2]Fig. 5 Multilayer Perceptron Architecture Fig. 5 shows input , output and one hidden layer. To achieve the network output it need to compute the output of each unit in every layer.
III. PERFORMANCEMEASUREANDDISCUSSION The performance of the advanced model is estimated by the use of accomplishment metrics i.e. tp, fp, tn, fn, accuracy, sensitivity, specificity and illusion of a classifier. These accomplishment metrics are estimated with the use of confusion matrix [30]. In Table 3 represents number of correct and incorrect pictures are classified using perplexity matrix.
Table 3 represents different condition of perplexity matrix
Actual class Predicted class
True False
true class tp fn
false class fp tn
Correctly classified cancer image i.e True Positive(tp) Correctly classified not_cancer image i.e True Negative(tn) Incorrectly classified as cancer images i.e. False Positive(fp) Incorrectly classified as not_cancer images i.e False Negative(fn)
Sensitivity = tp / (tp+fn)
Accuracy of a classifier = (tp+tn)/(tp+fp+tn+fn), false positive = fp/(fp+tn),
[image:3.595.51.271.538.676.2]Table 4 classification accuracy shows for noncancerous/cancer cases
SVM NB MLP KNN
Images are accurately classified
166 124 124 140
Images are incorrectly classified
24 66 66 50
[image:4.595.50.287.221.523.2]Accuracy of classifier(%) 87.3 65.2 65.2 73.6
Table 4 represent different model classifier accuracy for normal/abnormal states .
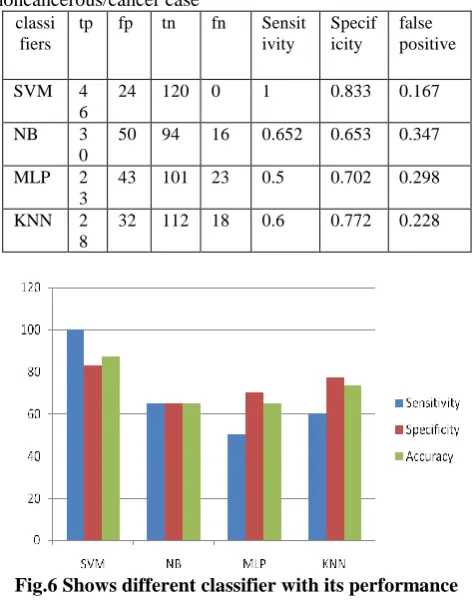
Table.5 Different machine learning performance for noncancerous/cancer case
classi fiers
tp fp tn fn Sensit ivity
Specif icity
false positive SVM 4
6
24 120 0 1 0.833 0.167
NB 3
0
50 94 16 0.652 0.653 0.347 MLP 2
3
43 101 23 0.5 0.702 0.298 KNN 2
8
32 112 18 0.6 0.772 0.228
[image:4.595.53.281.526.753.2]Fig.6 Shows different classifier with its performance Table.6 Various classifier error rate
rate of error SVM NB MLP KNN
noncancerou s/cancer images
0.12 0.34 0.34 0.26
Fig.7 Shows different classifier errors
Error is minute in case of SVM compared to the other classifiers as shown in Table 6 and Fig.7.
In this manuscript a comparative study has been conducted to observe effective breast cancer diagnosis model and classification accuracy through several machine learning methods. This approach is specially based on classification of pictures as benign or malignant. The experiment is conducted on mammogram images which are stored in MIAS database. At last it is found that better classification accuracy of 87.3 has been achieved on normal and abnormal classification using SVM.
IV. CONCLUSION
From the experiment, it is observed that SVM generates better accuracy in both instance when compared with the outcome of different classifiers. It's also viewed that the accuracy of the KNN classifier is higher than MLP and NB in both normal/abnormal instances. Moreover, it is transparent that the accuracy rate of NB and MLP are equal but less than the accuracy rate of SVM. Although it is recognized that the accuracy rate of KNN is higher than MLP and NB but less than SVM in both noncancerous/cancer cases. It’s concludes that SVM is recognized as the superlative classifier for diagnosis of cancer in the breast.
REFERENCES
1. http://www.breastcancerindia.net/statistics/trends 2. https://www.google.com/breastcancerinIndia
3. G. Agarwal, and P. Ramakant. (2008). Breast cancer care in India: the current scenario and the challenges for the future. Breast care, 3(1), 21-27.
4. C. H. Lee, D. D. Dershaw, D. Kopans, P. Evans, B. Monsees, D. Monticciolo, and E. Hendrick. (2010). Breast cancer screening with imaging: recommendations from the Society of Breast Imaging and the ACR on the use of mammography, breast MRI, breast ultrasound, and other technologies for the detection of clinically occult breast cancer. Journal of the American college of radiology, 7(1), 18-27. 5. A. Jemal, F. Bray, M. M. Center, J. Ferlay, E.Ward, and D. Forman,
(2011). Global cancer statistics. CA: a cancer journal for clinicians, 61(2), 69-90.
6. C. DeSantis, J. Ma, L. Bryan, and A. Jemal. (2014). Breast cancer statistics, 2013. CA: a cancer journal for clinicians, 64(1), 52-62. 7. T. C. André, and R. M . Rangayyan. (2006). Classification of breast
masses in mammograms using neural networks with shape, edge sharpness, and texture features. Journal of Electronic Imaging, 15(1), 013019.
8. Y. Wang, J. Li, and X. Gao. (2014). Latent feature mining of spatial and marginal characteristics for mammographic mass classification. Neurocomputing, 144, 107-118.
9. J. A. Baker, P. J. Kornguth, J. Y. Lo, M. E. Williford, and C. E. Floyd Jr. (1995). Breast cancer: prediction with artificial neural network based on BI-RADS standardized lexicon.
10. 10.M. P. Sampat, M. K. Markey, and A. C. Bovik. (2005). Computer-aided detection and diagnosis in mammography. Handbook of image and video processing, 2(1), 1195-1217.
11. D. C. Edwards, M. A. Kupinski, R. Nagel, R. M. Nishikawa, and J. Papaioannou. (2000). Using a Bayesian neural network to optimally eliminate false-positive microcalcification detections in a CAD scheme. Digital Mammography, Medical Physics Publishing, Madison, 168-173.
13. S. Tripathy, T. Swarnkar. “A Comparative Analysis on Filtering Techniques Used in Pre- processing of Mammogram Image (Accepted for publication),” Springer, to be published.
14. B. Verma, and P. Zhang. (2007). A novel neural-genetic algorithm to find the most significant combination of features in digital mammograms. Applied soft computing, 7(2), 612-625
15. . P. Valarmathi, and S. Robinson. (2016). An improved neural network for mammogram classification using genetic optimization. Journal of Medical Imaging and Health Informatics, 6(7), 1631-1635. 16. 16. H. D. Cheng, X. Cai, X. Chen, L. Hu, and X. Lou. (2003). Computer-aided detection and classification of microcalcifications in mammograms: a survey. Pattern recognition, 36(12), 2967-2991 17. J. Tang, R. M. Rangayyan, J. Xu, I. El Naqa, and Y. Yang. (2009).
Computer-aided detection and diagnosis of breast cancer with mammography: recent advances. IEEE Transactions on Information Technology in Biomedicine, 13(2), 236-251.
18. 18. A. N. Tosteson, N. K. Stout, D. G. Fryback, S. Acharyya, B. A. Herman, L. G. Hannah, and E. D. Pisano. (2008). Cost-Effectiveness of Digital Mammography Breast Cancer Effectiveness of Digital Mammography. Annals of internal medicine, 148(1), 1-10.
19. A. M. Khuzi, R. Besar, and W. W. Zaki. (2008). Texture features selection for masses in mammogram. In 4th Kuala Lumpur International Conference on Biomedical Engineering 2008 (pp. 629-632). Springer, Berlin, Heidelberg
20. S. Tripathy, T. Swarnkar, “ Unified Preprocessing and EnhancementTechnique for Mammogram Images,” unpublished.Y. B. Youssef, E. Abdelmounim, J. Zbitou, M. Elharoussi, and M. N. Boujida. (2017). Comparison Machine Learning Algorithms i Abnormal Mammograms Classification. IJCSNS, 17(5), 19.
21. J. P. Suckling. (1994). The mammographic image analysis society digital mammogram database. Digital Mammo, 375-386.
22. A. A. Nahid, and Y. Kong. (2017). Involvement of Machine Learning for Breast Cancer Image Classification: A Survey. Computational and Mathematical Methods in Medicine, 2017.
23. Y. Rejani, and S. T. Selvi. (2009). Early detection of breast cancer using SVM classifier technique. arXiv preprint arXiv:0912.2314. 24. S. Taheri, and M. Mammadov. (2013). Learning the naive Bayes
classifier with optimization models. International Journal of Applied Mathematics and Computer Science, 23(4), 787-795.
25. S. Taheri, M. Mammadov, and S. Seifollahi. (2015). Globally convergent algorithms for solving unconstrained optimization problems. Optimization, 64(2), 249-263.
26. S. Zhang, D. Cheng, Z. Deng, M. Zong, and X. Deng. (2018). A novel kNN algorithm with data-driven k parameter computation. Pattern Recognition Letters, 109, 44-54.
27. S. Tripathy, and S. Hota. (2012). A survey on partitioning and parallel
partitioning clustering algorithms. In International Conference on
Computing and Control Engineering (Vol. 40).
28. G. Panchal, A. Ganatra, Y. P. Kosta, and D. Panchal. (2011). Behaviour analysis of perceptrons with multiple hidden neurons and hidden layers. International Journal of Computer Theory and Engineering, 3(2), 332-337.
29. M. Kanchanamani, and V. Perumal. (2016). Performance evaluation and comparative analysis of various machine learning techniques for diagnosis of breast cancer. Biomedical Research, 27(3).
AUTHORSPROFILE
Mrs. Sushreeta Tripathy is working as an Assistant Professor in the Department of Computer Science & Information Technology, S'O'A Deemed to be University, India. She has 12 years of experience in teaching. In 2012, she received the M.Tech degree in Information Technology from S'O'A Deemed to be University, ITER, India. She is currently pursuing Ph.D. in S 'O'A Deemed to be University, ITER, India. Her areas of interest are Image Processing, Big
data health analytics, Machine learning, Bioinformatics, and Data mining.