R E S E A R C H
Open Access
The Global Consortium for Drug-resistant
Tuberculosis Diagnostics (GCDD): design of a
multi-site, head-to-head study of three rapid tests
to detect extensively drug-resistant tuberculosis
Naomi Hillery
1*, Erik J Groessl
1, Andre Trollip
2, Donald Catanzaro
3, Lynn Jackson
4, Timothy C Rodwell
4,
Richard S Garfein
4, S-Y Grace Lin
5, Kathleen Eisenach
6, Theodore G Ganiats
1, Daniel Park
4, Faramarz Valafar
3,
Camilla Rodrigues
7, Valeriu Crudu
8, Thomas C Victor
2and Antonino Catanzaro
4Abstract
Background:Drug-resistant tuberculosis (DR-TB) remains a threat to global public health, owing to the complexity and delay of diagnosis and treatment. The Global Consortium for Drug-resistant Tuberculosis Diagnostics (GCDD) was formed to develop and evaluate assays designed to rapidly detect DR-TB, so that appropriate treatment might begin more quickly. This paper describes the methodology employed in a prospective cohort study for head-to-head assessment of three different rapid diagnostic tools.
Methods:Subjects at risk of DR-TB were enrolled from three countries. Data were gathered from a combination of patient interviews, chart reviews, and laboratory testing from each site’s reference laboratory. The primary outcome of interest was reduction in time from specimen arrival in the laboratory to results of rapid drug susceptibility tests, as compared with current standard mycobacterial growth indicator tube (MGIT) drug susceptibility tests.
Results:Successful implementation of the trial in diverse multinational populations is explained, in addition to challenges encountered and recommendations for future studies with similar aims or populations.
Conclusions:The GCDD study was a head-to-head study of multiple rapid diagnostic assays aimed at improving accuracy and precision of diagnostics and reducing overall time to detection of DR-TB. By conducting a large prospective study, which captured epidemiological, clinical, and biological data, we have produced a high-quality unique dataset, which will be beneficial for analyzing study aims as well as answering future DR-TB research questions. Reduction in detection time for XDR-TB would be a major public health success as it would allow for improved treatment and more successful patient outcomes. Executing successful trials is critical in assessment of these reductions in highly variable populations.
Trial registration:ClinicalTrials.gov NCT02170441.
Keywords:drug resistance, international, multi-site, rapid diagnostic tools, tuberculosis, XDR-TB
* Correspondence:[email protected]
1
Department of Family & Preventive Medicine, University of California, San Diego, CA, USA
Full list of author information is available at the end of the article
Background
Tuberculosis (TB) is among the top threats to global public health, ranked second only to HIV as the most deadly infectious disease worldwide by the World Health Organization (WHO) [1]. Achievements in TB control over the last decade have led to a slow decline in TB incidence of 2% per year [1]; however, drug-resistant TB (DR-TB) remains a serious public health concern globally. The WHO estimated that in 2012 there were 450,000 new multidrug-resistant TB (MDR-TB) cases; that is, cases of TB resistant to first-line drugs isoniazid and rifampin. Additionally, an estimated 9.6% of MDR-TB cases were also extensively drug-resistant (XDR-MDR-TB), having additional resistance to fluoroquinolones, such as ofloxacin and moxifloxacin, and at least one of the injectable anti-TB drugs (capreomycin, kanamycin, and amikacin), making treatment virtually impossible in countries without access to alternative drugs.
Critically, the WHO reported that fewer than 25% of the 450,000 estimated MDR-TB cases in 2012 were actually detected [1]. Drug-resistant TB can be managed success-fully only if it is diagnosed rapidly using drug susceptibility testing, allowing for prompt and appropriate treatment. Standard, culture-based phenotypic drug susceptibility tests take weeks to months for results, which delays treat-ment and can significantly impact TB treattreat-ment outcomes [2]. Delayed patient management decisions contribute to amplification of resistance, transmission of DR-TB to unin-fected individuals, and higher mortality rates. Studies have shown that if TB is correctly diagnosed and promptly treated, transmission to uninfected individuals is quickly reduced; however, if diagnosis and treatment are delayed or if TB is not detected, spread of DR-TB is likely [3,4].
In 2008, the United States National Institutes of Health placed the development and testing of technologies for rapid drug resistance detection at the top of their list of TB research priorities [5]. The Global Consortium for Drug-resistant Tuberculosis Diagnostics (GCDD) was established in 2008 to characterize the genetic basis of drug resistance and evaluate molecular and microbiological methods of detecting DR-TB quickly and efficiently. This international collaboration to improve current DR-TB diagnostics gath-ered data from three unique regions in an effort to improve accuracy and precision of novel diagnostics and reduce DR-TB detection time. Here we explain the methods employed by GCDD investigators to conduct a multi-national longitudinal cohort study that addresses these objectives.
Aims and hypotheses
Study aims were defined as follows in the approved protocol of the National Institute of Allergy and Infectious Diseases Division of Microbiology and Infectious Diseases (text edited for clarity and brevity):
Aim 1: To reduce the average XDR-TB detection time from months to a week. We will compare the performance of one existing line probe assay (Hain
GenoType®MTBDR-plus and Hain GenoType®MTBDRsl) with a newly
de-veloped sequence-based assay (pyrosequencing) and an expanded Microscopic Observation Drug Susceptibility (MODS) phenotypic assay, to detect resistance to isoniazid and rifampin, ofloxacin, moxifloxacin, kanamycin, amika-cin, and capreomycin.
Aim 2: To determine agreement between rapid tests and standard drug susceptibility test results. Results of rapid tests based on smear-positive sputum will be com-pared with those from the current gold-standard drug susceptibility test method, which is based on subculture ofMycobacterium tuberculosis growth in the MGIT 960 liquid culture system.
Aim 3: To identify the genetic basis of discordant results from Aim 2. Strains identified as drug resistant by the drug susceptibility test, but not by the gene-based molecular tests, will be further examined through sequencing target genes, neighboring genes, or the entire genomes of unique strain families.
Aim 4: To characterize XDR-TB strains globally. Genotypic, phenotypic, and epidemiological features, as well as geographical relationships of XDR-TB strains, will be characterized and compared with other drug-resistant and susceptible strains. We will explore the re-lationships between drug resistance, including XDR-TB,
and patient risk factors and strain families of M.
tuberculosis.
Secondary aims
Secondary Aim 1: Cost-effectiveness study. The costs associated with performing each rapid test will be compared with improvements in time and accuracy for detecting drug resistance and XDR-TB over standard drug susceptibility testing methods.
Secondary Aim 2: To determine the predictive value of resistance-associated mutations in determining sputum culture conversion.
Methods
spoligotyping, and Sanger sequencing. Drug susceptibil-ity tests were also performed using MGIT 960 according to the manufacturer’s instructions. Additional methods and results of this study have been described elsewhere [6]. Data from this repository were used to inform the design of diagnostic tests that were evaluated in the second phase.
Phase II, which is the focus of this paper, consisted of a prospective cohort study designed to evaluate a number of rapid drug susceptibility tests compared with the stand-ard MGIT 960 assay among patients with suspected, but not confirmed, XDR-TB in existing clinical laboratories in three of the countries included in Phase I. Participants were screened for eligibility and provided written informed consent prior to enrollment. Biological specimens and patient interview data were collected at baseline and 52-week follow-up visits. In addition, medical record reviews were conducted at baseline, 30 days post-enrollment and 52 weeks post-enrollment. Sputum specimens collected were tested using MGIT drug susceptibility tests, line probe assay, pyrosequencing, and MODS assay. In addition to the results of a rigorously standardized, direct compari-son of the performance of these assays, this study produced a well-characterized repository of M. tuberculosis isolates to address many other clinical, laboratory and epidemio-logic questions. This paper describes the methodology used for the prospective cohort study.
Study sites
Participants were enrolled from three diverse regions with a high prevalence of XDR-TB: Mumbai, India; Chisinau, Moldova; and Port Elizabeth, South Africa. These sites were carefully considered when planning the study and were selected because of a high documented risk of DR-TB and the ethnic diversity of these regions.
India
The PD Hinduja National Hospital and Medical Research Centre is a tertiary care center in central Mumbai, India that provides medical care in all specialties of Medicine and Surgery. The Pulmonary Department at the PD Hinduja National Hospital is the busiest in Mumbai and is the refer-ral center for MDR and XDR-TB cases of the city and the state of Maharashtra. Therefore, the TB patient population is more likely to contain those who have previously been treated and were either unresponsive or relapsed [7]. In a consecutive sampling of 150 patients in the Mumbai area, 80% of samples obtained were found to be resistant to one or more standard TB medications, while 51% were resistant to more than one drug [7].
Moldova
The Phthisiopneumology Institute in Chisinau, Moldova, the central unit of the Moldovan National TB Control
Programme, is a scientific research, medical consult-ation, and training center, which leads all TB and unspe-cific upper respiratory tract diseases services for patients across Moldova. Disintegration of the Soviet Union in the early 1990s resulted in a sudden and sharp deterior-ation of socioeconomic conditions in Moldova, leading to an upsurge in TB from increased infection and increased risk of breakdown from infection to disease. A financial crisis led to drug shortages and inadequate and interrupted treatment. As a result, drug resistance increased with the eventual emergence and transmission of MDR strains. The prevalence of MDR-TB in Moldova has been documented as 24% of new and 62% of previ-ously treated patients, according to national TB surveil-lance data between 2007 and 2010 [8].
South Africa
South Africa is one of the five countries with the largest number of incident TB cases in 2011, estimated to be between 0.4 million and 0.6 million, according to the WHO. Co-infection with HIV is of particular concern in this region, with 65% of patients with TB known to be HIV-positive [9]. In Port Elizabeth, patients were enrolled at six Primary Health Care facilities and one regional hospital. Decentralized enrollment resulted in a different prevalence of drug resistance at this site.
Eligibility
GCDD study eligibility criteria
Participants were included in the study if they
– Were at least 5 years of age
– Were acid-fast bacilli sputum smear-positive , 1+ or greater (within previous 14 days), positive on GeneXpert, or present clinically with high suspicion of active TBand:
– Previously received >1 month of treatment for a prior TB episodeor
– Were failing TB treatment with positive sputum smear or culture after≥3 months of a standard TB treatmentor
– Had close contact with a known drug-resistant TB caseor
– Were newly diagnosed with MDR-TB within the last 30 daysor
– Were previously diagnosed with MDR-TB and failed TB treatment with positive sputum smear or culture after≥3 months of a standard MDR-TB treatment regimen
– Provided informed consent or subject or legal guardian or representative able and willing to provide informed consent
Participants were excluded from the study if they
– Were institutionalized
– Were unable to provide at least 7.5 ml sputum (1st and 2nd samples combined)
– Had results from Second-line drug susceptibility test performed within the last 3 months
The eligibility criteria for this study were designed to identify patients at increased risk of DR-TB. Potential study subjects gave oral consent to be screened for study eligibility. The screening was performed by a trained clinical staff member using a computerized algorithm during a single study visit. Written consent, or assent if the patient was younger than 18 years old, was collected if eligibility was confirmed. Children between the ages of 5 and 17 were eligible for the study at sites where the participation of minors was approved by the local insti-tutional review board or independent ethics committee. Subjects were not compensated for participation; how-ever, in India and South Africa where patients traveled an hour or more from their residence for study visits not related to routine care, travel costs were reimbursed.
Participant withdrawal
Enrolled subjects were withdrawn from the study if they could not provide adequate sputum for testing. Partici-pants could also request to be withdrawn from the study. If this occurred, the reasons were documented. Once
participants were withdrawn, their study data were excluded from all analyses. Failure to return for follow-up or learning of a participant’s death were not considered reasons for withdrawal from this study.
Training
Prior to study initiation, all personnel gathered in San Diego, California, USA for training in good clinical prac-tices and the GCDD protocol. The training in good clinical practices was conducted by Family Health International, contracted by the National Institutes of Health and the National Institute of Allergy and Infectious Diseases, so that scientists were certified in ethical considerations with human subjects and international clinical trial protocols. All domestic and international collaborators also com-pleted certification in the Collaborative Institutional Training Initiative.
Clinical and laboratory personnel from each site were also trained in the use of case report forms and study laptops, used for clinical data collection. Laboratory technicians specializing in the pyrosequencing assay were given detailed training at the California Department of Public Health in Richmond, California, while those re-ceiving detailed training in the MODS assay were trained in Lima, Peru. Site personnel were generally more experi-enced in the use of line probe assays, so study procedures were reviewed at the meeting in San Diego. As procedures for the study were refined or new elements added, follow-up training was conducted via webinar. These were run by the staff most knowledgeable in the procedures and were targeted to certain collaborators at each site. For example, updates to the clinical case report forms were presented by the data manager to the enrolling clinicians. Principal investigators were invited to attend but were not required.
Enrollment procedures
Study procedures were complex and several clinical and laboratory processes needed to be standardized across the distinctive sites. Therefore, we included a series of validation procedures, which utilized enrolled subjects’ samples to validate all data systems and to allow laborator-ies time to become proficient in all assays and procedures. Completion of validation procedures was a requirement to initiate the study.
30, and week 52 to provide supplementary information to that obtained during patient interviews and to docu-ment detailed treatdocu-ment history for the TB illness diagnosed at the time of study enrollment. Sputum speci-mens collected at each visit were sent to the central site laboratories to be processed for testing. Upon completion, culture isolates were shipped to the University of California, San Diego, for storage.
Case report forms
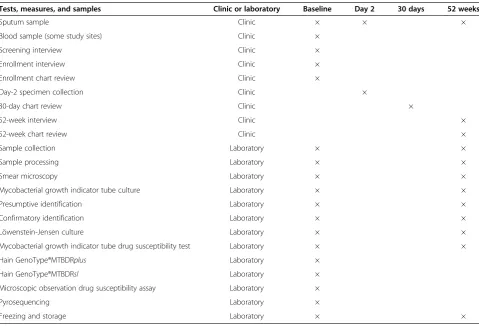
Sources for the data collected for the study included pa-tient interviews, chart reviews, and laboratory processing information. Standardized case report forms developed by researchers at the University of California, San Diego, gathered all clinical and laboratory processing informa-tion. Table 1 lists all study case report forms and samples, and the times at which each were collected.
Interviews
The baseline interview gathered demographic measures such as age, race, ethnicity, and sex. Known TB risk factors were assessed at baseline and for the previous three months. Maps were given to each enrolling clinician so that detailed geographical history could be assessed; this was used for spatial analyses. A clinical history was
obtained at this visit, including current symptoms, co-occurring conditions, HIV or AIDS status, height, and weight. The follow-up interview was less detailed and assessed subject’s treatment status, current symptoms, height, and weight.
Chart reviews
The baseline chart review included measures of the subject’s current TB category (new or previously treated), TB drug history beginning from diagnosis of the current illness, history of chest X-ray and results, and HIV status. If HIV-positive, CD4 counts and viral loads were requested. The 30-day chart review documented the subject’s current status, TB drug history beginning from diagnosis of the current illness and, if unavailable at baseline, HIV status. The 52-week chart review assessed the subject’s current status, TB drug history beginning from diagnosis of the current illness, history of smear and culture performed since study entry, and results of the most recent chest X-ray, if performed.
Laboratory data collection
[image:5.595.58.538.409.735.2]Using the standard laboratory case report form, labora-tories recorded the date and time of the collection and receipt of the sputum samples. Information on the
Table 1 Data collection schedule
Tests, measures, and samples Clinic or laboratory Baseline Day 2 30 days 52 weeks
Sputum sample Clinic × × ×
Blood sample (some study sites) Clinic ×
Screening interview Clinic ×
Enrollment interview Clinic ×
Enrollment chart review Clinic ×
Day-2 specimen collection Clinic ×
30-day chart review Clinic ×
52-week interview Clinic ×
52-week chart review Clinic ×
Sample collection Laboratory × ×
Sample processing Laboratory × ×
Smear microscopy Laboratory × ×
Mycobacterial growth indicator tube culture Laboratory × ×
Presumptive identification Laboratory × ×
Confirmatory identification Laboratory × ×
Löwenstein-Jensen culture Laboratory × ×
Mycobacterial growth indicator tube drug susceptibility test Laboratory × ×
Hain GenoType®MTBDRplus Laboratory ×
Hain GenoType®MTBDRsl Laboratory ×
Microscopic observation drug susceptibility assay Laboratory ×
Pyrosequencing Laboratory ×
quality and quantity of the sputum was also recorded. Sputum processing was performed using the standard N-acetyl-L-cysteine sodium hydroxide method [10]. The date and time that cultures were started and completed were recorded, and later used to calculate the culture time to detection. Culture and MGIT drug susceptibility test results were transcribed from the MGIT 960 instru-ment, while standardized worksheets were used to record observed data from the MODS assay. Line probe assay results were recorded directly onto laboratory case report forms. The line probe assay strips were scanned for later verification. Pyrosequencing data were tran-scribed onto the laboratory case report form from the Pyromark Q96 instrument after comparison with the Pyrosequencing Library [11]. Pyrograms were saved as. pdf and uploaded to the website for further analysis. Owing to standard batching procedures, results for several patients could appear in test results. This transfer of information allowed data for a subject coming from several sources to be gathered in one location.
Reference standard and rapid tests
The reference standard for phenotypic observation of drug susceptibility test used in this study was the MGIT 960 TB system. The study drugs described in Aim 1, as well as isoniazid and rifampin, were tested using a MGIT drug susceptibility test when the culture tested positive, while sputa from each subject were tested with the three rapid tests regardless of culture status. Proce-dures were as follows.
Mycobacterial growth indicator tube drug susceptibility test
In MGIT drug susceptibility testing, the drug suscepti-bility of TB is based on the modified proportion method (Food and Drug Administration approved for first-line anti-TB drugs). The critical proportion for resistance is taken as 1% for all anti-TB drugs, meaning that if 1% or more of the test mycobacterial population is resistant, the culture is considered resistant. We determined re-sistance by comparing growth in MGIT tubes with and without drugs; this was accomplished in an instrument with the capacity to monitor growth of 960 MGIT cul-ture tubes simultaneously. Although the first-line drugs were available from Becton Dickinson, the second-line drugs were not. Thus, testing of second-line drugs was performed using validated critical concentrations of in-house (locally prepared by each site) drug solutions compatible with the WHO recommendations: 2.0μg/ml for ofloxacin, 0.25μg/ml for moxifloxacin, 1.0 μg/ml for amikacin, and 2.0 μg/ml for capreomycin [12]. As there were no published WHO recommended critical concen-trations for kanamycin drug susceptibility testing by MGIT 960 at the time of the study, we used 2.5 μg/ml, based concentrations reported in the literature [13,14].
Line probe assays
Commercial line probe assays, such as the GenoTy-pe®MTBDRplus (Hain Lifesciences, Nehren, Germany), have been well validated for the detection of isoniazid and rifampin resistance indirectly using TB culture iso-lates and directly on smear-positive clinical specimens. Barnard et al. conducted a large study using
GenoTy-pe®MTBDRplus on smear-positive sputum specimens
from 536 patients at a high risk of MDR-TB [15]. They found a sensitivity and specificity of 98.9% and 99.4%, respectively, for detection of rifampin resistance; sensi-tivity was 94.2% with specificity of 99.7% for detection of isoniazid resistance. Results were interpretable for 97% of the specimens within 1 or 2 days. Overall, these stud-ies demonstrate that the strip assay is rapid and accurate for the detection of mutations found in MDR-TB strains, providing an excellent platform for development to de-tect XDR-TB strains. The GenoType®MTBDRsl strip is marketed as an indirect test but is often used to test specimens directly for resistance to second-line drugs. Few studies have been published that evaluate the performance of the GenoType®MTBDRsl test to detect
resistance to second-line drugs in M. tuberculosis
isolates and sputum specimens. Brossier et al. reported sensitivities and specificities of the MTBDRsl test in a study of 49 clinical isolates (41 MDR-TB and 8 XDR-TB) as follows: fluoroquinolones 87%, 96%; amikacin 100%, 100%; kanamycin 77%, 100%; and capreomycin 80%, 98% [16]. Kiet et al., in a study of 41 fluoroquinolone resist-ance isolates and 21 MDR-TB but fluoroquinolone-sensitive isolates, reported sensitivities and specificities of the MTBDRsltest as follows: fluoroquinolones 75.6%, 100%; kanamycin 100%, 100% [17]. These studies dem-onstrate that, because of mutations not included in the test (such as gyrB), or unknown resistance mechanisms, the GenoType®MTBDRsl tests lacks the sensitivity to exclude the possibility of second-line drug resistance
reliably. Both GenoType®MTBDRplus and
GenoTy-pe®MTBDRsl were evaluated in the clinical observation testing phase.
cycler suitable for the amplification step. Banding pattern results were interpreted using the template provided with the kit.
Pyrosequencing
Pyrosequencing is a sequence-based molecular method to detect mutations associated with drug resistance. The method requires DNA extraction, amplification by PCR, and real-time sequencing, using pyrosequencing technol-ogy and the PyroMarkQ96 platform, as described previ-ously [11,18]. The GCDD methods for pyrosequencing were guided by a study conducted by Bravoet al., in which 102 clinical M. tuberculosis isolates were evaluated for susceptibility to rifampin, isoniazid, and ofloxacin with a pyrosequencing assay. The sensitivities and specificities of the assay were 96.7% and 97.3%; 63.8% and 100%; and 70.0% and 100% for the detection of resistance to rifampin, isoniazid, and ofloxacin, respectively [19]. In this study, we included eight molecular targets: IS6110, for identification ofM. tuberculosis,katG, theinhApromoter, andahpCfor isoniazid, rpoB for rifampin, gyrAfor quinolones, and rrs for injectable drugs.
Pyrosequencing was used to rapidly characterize muta-tions within specific genes associated with resistance to isoniazid, rifampin, the fluoroquinolones, and the inject-able drugs. Pyrosequencing was performed according to the manufacturer’s instructions using the sequence analysis mode of the Pyromark 96 ID system (Qiagen, Valencia, CA, USA) and the standard Pyromark Gold Q96 reagent kit, containing enzyme, substrate, and nucleotides (Qiagen, Valencia, CA, USA). Briefly, bio tin-labeled PCR products were immobilized on strep tavidin-coated sepharose beads and denatured to serve as single-stranded DNA templates. These beads were subse-quently transferred to a 96-well plate containing annealing solution and sequencing primer. The reaction cascade pri-marily consists of the incorporation of nucleotides into the growing DNA chain, culminating in the production of light. The pattern of emitted light in relation to the nucleotide dispensation order and number of nucleotides incorporated was subsequently illustrated on a pyrogram. The data were analyzed using IdentiFire software, supplied by the manufacturer. Susceptibility results based on geno-typic testing were compared using a phenogeno-typic drug susceptibility test.
Microscopic observation drug susceptibility assay
The MODS assay is a well-described microbiological technique that has shown to be reliable, cheap, and easy to implement in low-volume, low-resource settings for drug susceptibility testing. The performance of the MODS assay in identification of MDR-TB is excellent, with a sensitivity of 97.8% and a specificity of 99.6%, compared with standard drug susceptibility testing
methods [20]. The rapidity, simplicity, and low cost of the MODS assay made it a promising candidate for use as a methodology for second-line drug resistance testing and XDR-TB detection. Although the MODS assay has been validated for detection of resistance to first-line drugs, a reliable methodology for detection of resistance to ofloxacin, amikacin, kanamycin, and capreomycin has not yet been established. The development of the MODS assay for the detection of second-line drug resistance has recently been described [21].
The MODS assay is a microscope-based assay that exploits the fact thatM. tuberculosisgrows more rapidly in liquid broth than solid medium and forms specific
‘cord’ formations that can be seen through the micro-scope long before colonies on solid media are visible to the naked eye. The MODS assay method uses a 24-well culture plate format. Patient sputum samples were digested and decontaminated according to a standard-ized procedure and inoculated into culture broth with and without the study drugs. The broth was then placed in the culture plates. If the sample of M. tuberculosis grew in broth alone, but not in drug-containing wells, if was drug-sensitive. If M. tuberculosisalso grew in drug-containing wells, DR-TB was present. An advantage of the MODS assay is its flexibility to test multiple drugs at different concentrations at once. When used directly to detectM. tuberculosis in sputum, results are available in as early as seven days instead of two to three weeks following positive culture [20].
Sample size and power analysis
power analysis focused on XDR-TB, the group with the smallest and most restrictive sample size.
The goal of Aim 2 was to examine the agreement of the new tests with MGIT drug susceptibility tests for detecting the resistance of samples to first- and second-line medications. Here, the size of the confidence intervals around the sensitivity and specificity for each diagnostic test was a function of sample size and prevalence of resist-ance. The prevalence of resistance varied quite widely across the seven drugs examined, as well as across the algorithms for diagnosing MDR-TB and XDR-TB. To be conservative and align with the stated goals of the study, we used an estimated prevalence for XDR-TB, since its prevalence is much lower than MDR-TB. We estimated that the prevalence of XDR-TB would be 5% to 10% for the study. Based on preliminary study results, we esti-mated that the new tests would achieve a sensitivity of 0.90 to 0.95 and a specificity of 0.95 to 0.98. There is no standard on the ideal size of a confidence interval, simply smaller is better, but huge sample sizes may be required to accomplish this when detecting less prevalent cases. In addition, as prevalence decreases, it is easier to be confident about high specificity while harder to keep sensi-tivity high. Therefore, we estimated the sample sizes required to achieve confidence intervals of about 0.100 for sensitivity and 0.020 for specificity. It was determined that a sample size of 1,225 subjects would provide a confidence interval of 0.077 for a sensitivity of 0.95 and 0.017 for a specificity of 0.98 at an XDR-TB prevalence of 10%. If the prevalence of XDR-TB were as low as 5%, 1,225 subjects would provide a confidence interval of 0.105 for a sensitiv-ity of 0.95 and 0.016 for a specificsensitiv-ity of 0.98. This same sample size produces much tighter confidence intervals for MDR-TB, where prevalence is higher. At 35% MDR-TB prevalence, we obtain confidence intervals of 0.041 for a sensitivity of 0.95 and 0.018 for a specificity of 0.98.
Aim 3 (to identify the genetic basis of discordant results from Aim 2) was a developmental aim, and did not test specific hypotheses. Aim 4 (to characterize XDR-TB strains globally) was a descriptive analysis. It also did not test spe-cific hypotheses. We expected a sample size of 1,225 to provide more than enough data to explore discordant re-sults with genetic sequencing and characterize global strains using genotypic, phenotypic, epidemiological, and geographical variables.
The study did not randomize patients in the clinical data collection phase because it would have severely limited the statistical power of the confidence intervals for sensitivity and specificity calculations, and compro-mised our ability to complete the study. Instead, we chose to conduct all four resistance tests on every sam-ple, allowing approximately 900 to 1,000 comparisons for each test. If patients were randomized to receive only one test, the study would have had to enroll over
4,000 patients to achieve the same confidence in our calculations.
Study management
Organization
The study operated under a centralized study manage-ment group of administrators and laboratory technicians at the University of California, San Diego, under the supervision of the principal investigator, Dr. Antonino Catanzaro. Several committees existed within the study framework so that co-investigators could provide key advice as the study progressed. Working groups who met regularly were an operations and data committee, a microbiology core unit, a leadership committee, and a publications committee; the first two groups addressed specific operational and technical laboratory issues to move the study forward, respectively, and freed the leadership committee to discuss larger-scale topics related to study progress. The publications committee, which comprised of two co-investigators and one external expert in TB research, steered efforts for the publication of key findings. Additionally, each international study site had a local team, which included principal investigators, a study coordinator, clinicians, and laboratory technicians. Site teams were responsible for recruitment, data collec-tion and transmission, sample processing, and participant follow-up.
Website
To share critical information and study documents, a GCDD website was established and utilized regularly throughout the study [22]. This website housed protocols, standard operating procedures, case report forms, meeting agendas and minutes, presentations, publications, contact lists, and reports for the central study management or sites to view, and in some cases, download to provide responses. Users at the sites could upload requested source docu-ments via the website directly to the data coordinating center and were able to access electronic data capture ystems for data entry. Moreover, the website allowed for access levels to be specified so that confidential informa-tion was protected from unauthorized users. The GCDD website was managed by the data coordinating center, and will continue to be maintained after the study funding period, allowing for public requests to access to study data.
Site visits
strengthening practices to meet good clinical practice re-quirements. The principal investigator and co-investigators also visited the sites to verify compliance with standard op-erating procedures and respond to questions or difficulties encountered in executing the study protocol. These pre-paratory visits occurred before or during the validation
phase. During the clinical observation phase,
co-investigators visited India and Moldova to monitor study progress.
Data management
The University of California, San Diego, Health Services Research Center, a multidisciplinary team of researchers, database managers, and programmers, acted as the data coordinating center, collecting and managing study data. The study also employed a quality assurance manager who worked in collaboration with the data coordinating center to ensure high-quality data throughout the study. All data were stored and managed in a secure SQL data-base using SQL Server Management Studio, version 2012.
A top priority of this study was to protect subject con-fidentiality. All data entry systems were password pro-tected and only the clinician enrolling subjects had access to personally identifying information, such as name, date of birth, or contact information. These were used only for follow-up purposes. Clinicians were instructed how to password protect the document con-taining personally identifying information so that the data managers and programmers were blinded to this in-formation when accessing the laptop. Study personnel were instructed never to document the participants’ names and study identification numbers in the same lo-cation on any study document.
Data capture systems
Data were gathered by two independent electronic data capture systems: clinical case report forms were entered directly into a password-protected study laptop as clini-cians interviewed subjects or gathered medical record information via software designed specifically for this study. This application allowed the user to collect data off-line (a function critical for enrollment in more rural locations where internet connection was not reliable) and then allowed upload of data to the database when a connection became available. This software also enabled users to save their progress until a later time if needed and assigned the unique identifier that the participant and associated samples carried throughout the study.
The second was a web form system designed by the Health Services Research Center for the collection of la-boratory case report forms. Study data were gathered from original laboratory result sheets upon test comple-tion and documented on study case report forms. The
laboratory technicians then entered this information into web forms and uploaded the data directly to the data-base, as all central laboratories had reliable internet con-nections. The system was comprised of 13 individual web forms. Each sent an automated confirmation email to the site coordinator and the data manager whenever forms were uploaded, as verification of database receipt.
Remote access
Owing to the physical distance between the data coord-inating center and the study sites, provisions were put into place to troubleshoot technical difficulties remotely. The study utilized the web tool Log Me In [23]. This enabled database managers and programmers to access study laptops when they were connected to the internet, allowing identified problems to be resolved promptly, so that enrollment could progress normally.
Data quality assurance and control measures
We utilized several front-end quality assurance measures in the electronic data entry form fields to prevent incorrect data from being included in the database. For instance, electronic forms would not accept a duplicate case and date fields would accept only a response in date format (and only current or past dates, local time). Although these types of front-end quality assurance measures existed on almost every field in each form, some data points still re-quired internal validity checks to verify that information between case report forms was consistent. For these, back-end quality control measures were employed, such as date checks of when laboratory procedures were performed; if a date of test completion for a drug susceptibility test was entered as earlier than the sample processing date, the site would be queried, as this was an illogical process of events. Similarly, if a medication stop date was earlier than the start date, the site would be asked to verify and correct the information.
As a final level of quality control, the microbiology core unit reviewed all laboratory data from 100% of enrolled subjects to ensure that results were logical in the context of the patient. This routine also helped to identify trends that would potentially affect study outcomes, such as the need to repeat drug susceptibility tests or the detection of a high rate of smear negative samples. The sites were gen-erally able to execute successfully the protocol. A review by microbiologists vetted the scientific quality of the com-plex data and allowed data managers to focus on more routine data queries, such as ranges and basic internal validity.
Data correction procedures
erroneous data, sites were sent a standard report and asked to respond specifically within the same report or to fill out an electronic data correction form housed on the GCDD website. If a site identified an error in its own data, the same mechanism could be used to report it. As data corrections were sent to the data coordinating center, the data manager reviewed the changes, and an ongoing SQL database query was updated. This query updated the values of a specific case in accordance with the documented error in a new copy of the data table, so that raw data would be preserved. Only these updated tables were used for analysis. While every effort was made to prevent erroneous data before receipt in the database, this could not always prevent inaccuracies. Establishing a procedure early in the study kept the requests manageable.
Data monitoring and reporting
The high volume of information collected made it import-ant to monitor study data in real time. We developed progress reports to ensure that sites regularly transmitted data and to keep collaborators informed of study progress. Many of these reports were run weekly, while others were run monthly. Weekly reports included counts of enroll-ment, defined by the receipt of the first expected post-screening measure (the enrollment interview case report form); counts of laboratory processing forms by subject; and date of last upload for each measure. Further, the length of time between expected upload and actual upload for each case report form were monitored. It was import-ant to assess clinics and laboratories separately as the processes for each type of data collection were expected to take differing lengths of time. Further, timeliness of re-sponses was affected in part by number of staff members available to assist at each site. A standard protocol was utilized for inquiring about overdue data and reports: first, the data manager reported to the clinical manager follo-wing two unresponsive requests to the staff member responsible. If still unresponsive, the clinical manager escalated to the principal investigator, who contacted the site principal investigator directly. It was rare for any request to progress this far, but allowing for this possibility ensured that data monitoring issues were handled consist-ently and in a timely fashion.
In addition to monitoring the time for receipt of case re-port forms, we developed detailed rere-ports called reconcili-ation reports. These site-specific reports included a list of all study IDs and which forms were received, overdue, or not yet due. For outstanding forms, it was requested that sites respond monthly with the status of each. Problems observed in timely data collection were followed up by the data manager, quality assurance manager, and clinical manager. Generally, these reports served as a reminder of what follow-up forms were upcoming or overdue, but at
times they also informed managers of more serious in-ternal issues, such as a lack of study supplies to complete a test, and therefore, a case report form.
As data were needed for interim analyses, such as sensitivity and specificity, or the time to result of each rapid test, the database was queried and output was provided in a Microsoft Excel spreadsheet and either emailed to the requestor or posted on the GCDD website. Accompanying documentation was supplied on the website throughout the study. A final data table query was written to compute study outcomes that considered multiple fields. This assisted with generating datasets for analysis much more quickly than on an as-needed basis.
Study subjects’ drug susceptibility test results were made available to the treating physicians at each site. Clinicians were carefully informed of the research nature of the test results and that treatment decisions should not be based solely on the results of study tests. All TB treatment that the subjects received was determined and administered by the local TB clinicians. Treatment or treatment recommendations were not provided through the study. It was emphasized that the results obtained were for research purposes only.
Results and discussion
Detection time to XDR-TB diagnosis remains a challenge. This study design was intended to advance the develop-ment and validation of molecular-based technologies (line probe assay and pyrosequencing) and one microbiological method (MODS assay), which have proven success for the rapid detection of MDR-TB in low-resource settings. Geographic and TB strain differences were expected to affect the genetic mutations associated with drug resistance that were observed, making it important to study the mo-lecular basis for drug resistance and evaluate the perform-ance of rapid diagnostic tests for XDR-TB across different clinical settings. This paper discussed the methodologies used to produce data pertinent to these aims and issues encountered were described.
the retention rate for participants: the withdrawal rates due to a lack of 5 ml sputum on the first visit and 7.5 pooled were 0.8% and 3.1%, respectively. Despite the increased withdrawal rate, all subjects who were retained in the study had adequate samples to meet testing require-ments, so that resources could be directed appropriately. In a study of this size, working efficiently and evaluating the outcome of all decisions was incredibly important.
In addition, the ability to monitor enrollment and data entry targets in real time was an important feature of the study design. This allowed any problems with achieving enrollment goals to be addressed quickly and kept researchers well informed of sample size as the study pro-gressed. As data were received in the database, multiple levels of data quality checks were put into use throughout the study. These validations and queries at times revealed both systematic and random errors. While these inaccur-acies pointed to improvements that could be made in training data collection staff or to data capture systems, it was the job of the operations and data committee to deter-mine which situations required retraining and which would necessitate improvement of systems or quality con-trol measures. Although careful planning went into each of the case report forms, it is recommended that case report forms and electronic data capture field validations be thoroughly examined by clinical and laboratory personnel prior to enrollment so that internally valid data can be captured with minimum burden on data entry staff. Further, changes to data points being collected might occur but should be tested thoroughly, so as to avoid introduction of new errors within the database. All data should be traceable to a source document, so that infor-mation can be followed up. The ability to monitor data quality in real time was significant to identification and resolution of problems that could have severely affected the quality of the final data.
Direct communication with enrollment sites and labora-tories were also critical to the study’s success. Monthly site-specific teleconferences were implemented with the central leadership committee and all staff at each of the study sites, so that issues specific to the study site could be the primary focus of conversation. These calls allowed the opportunity to discuss details of requests made in either direction and specific data issues needing reso-lution, and to provide assistance with troubleshooting equipment problems. This teleconference format was highly productive for this study, as it kept all parties accountable for necessary actions and was more efficient than email communications, which had inherent delays due to time zone differences. It also allowed input from all collaborators, giving confidence that all departments involved were considered when decisions were needed. Further, annual webinars included presentations of data to date, site collaboration, and feedback to the central
leadership. These regular communications played a vital role in detecting issues and solutions that were not picked up through routine queries and gave sites the opportunity to share experiences with one another.
The diversity of study locations where recruitment took place was crucial for comparative analyses but was not without challenges. Although many circumstances were planned for, such as implementing provisions for physical distance between the coordinating center and study sites, challenges arose that required consideration and decision-making by the central leadership. For instance, India was the only study site where patients routinely carried their own medical records, as opposed to them being stored at the clinic. This affected follow-up, as subjects were initially only expected to return at day 2 and week 52 for follow-up visits. While this remained the case in Moldova and South Africa, subjects from the India site were asked to return to the clinic 30 days after enrollment to supply chart review information, causing difficulty in obtaining this follow-up measure as quickly as the other two sites, where medical records were stored at the clinic. To improve the success rates of follow-up, it was deter-mined that this site could collect the 30-day data by telephone, by having the subjects read the information from the record. Additionally, the Moldova and South Africa study sites did not have the same patient vol-umes as the India site, so recruitment was at a slower pace. These needed to be accounted for in recruitment targets. Each site also observed unique holidays and clinic closures, which affected the pace of recruitment. It is recommended that access to medical records, patient volume, and local schedules be carefully con-sidered prior to study launch so that they can be accommodated.
Conclusions
Abbreviations
DR-TB:drug-resistant tuberculosis; GCDD: Global Consortium for Drug-resistant Tuberculosis Diagnostics; MDR-TB: multidrug-resistant tuberculosis;
MGIT: mycobacterial growth indicator tube; MODS: microscopic observation drug susceptibility; PCR: polymerase chain reaction; TB: tuberculosis; WHO: World Health Organization; XDR-TB: extensively drug-resistant tuberculosis.
Competing interests
The authors declare that they have no competing interests.
Authors’contributions
NH managed the study data and drafted the manuscript content. EJG conducted power analyses, collected cost-effectiveness data, and helped to draft the manuscript. AT managed study operations, participated in subject enrollment, carried out laboratory processes, and helped to draft the manuscript. DC managed quality assurance for the study and participated in study operations. LJ managed laboratory processes, participated in drug susceptibility testing, and participated in study operations. TCR, RSG, and TGG participated in study design and coordination and helped to draft the manuscript. SYGL wrote the pyrosequencing protocol and provided support for pyrosequencing activities. KE advised collaborators on the microbiology of TB and conducted site visits to evaluate laboratory facilities. DP participated in study design and coordination. FV conducted, and advised collaborators on, whole genome sequencing activities. CR supervised study activities in the study site in Mumbai, India. VC supervised study activities in the study site in Chisinau, Moldova. TCV supervised study activities in the study site in Port Elizabeth, South Africa. AC conceived the study and participated in its design and coordination. All authors read and approved the final manuscript.
Acknowledgements
The specimens, data, and funding for this project were provided by the Global Consortium for Drug-resistant Tuberculosis Diagnostics (see http://gcdd.ucsd. edu), funded by National Institute of Allergy and Infectious Diseases grant U01-AI082229. TCR was supported by National Institute of Allergy and Infectious Diseases grant K01-AI083784. The authors would like to acknowledge the clinical and laboratory staff in each of the study sites for their assistance in acquiring and testing patient specimens. The authors would also like to recognize the support of all consenting contributors to the project.
Hinduja National Hospital, Mumbai, India Dr. Zarir Udwadia, MD, FRCP, FCCP, Clinical Investigator Dr. Kanchan Ajbani, PhD, Project Coordinator
Microbiology and Morphology Laboratory, Institute of Phthisiopneumology, Chisinau, Moldova
Ecaterina Stratan, MD, Microbiologist Cristina Celan, MBA, Administrative Assistant Raisa Barbuta, MD, Clinical Investigator Alexandru Buga, MD, Researcher
Viorel Soltan, MPH, MBA, PhD, Administrative and Scientific Liaison
Department of Biomedical Sciences, Stellenbosch University, Cape Town, South Africa
Naniwe Mkosana, BA, Research Nurse
Cindy Hayes, MTech Biomedical Technology, Laboratory Manager Sabine Klages, Medical Technologist, Laboratory Technician LV Paul, PhD, Investigator
Tropical Disease Foundation, Inc., Makati City, Philippines Henry B Evasco II, RN, Study Laboratory Coordinator
Department of Medicine, University of California, San Diego, CA, USA Marva Seifert, MPH, Graduate Student
Sophia Georghiou, MS, Pyrosequencing Laboratory Technician and Methods Consultant
Janice Kaping, MS, CLS, Staff Research Associate Jessica Channick, Research Assistant
Department of Family & Preventive Medicine, University of California, San Diego, CA, USA
Helen Chong, MPH, Research Assistant Priya Bhat, MPH, Graduate Research Assistant Zhun Xu, PhD, Database Administrator Jennifer Kempster, MS, Data Analyst
Division of Bioinformatics and Medical Informatics, San Diego State University, San Diego, CA, USA
Dennis Didulo, MS, Research Assistant Victoria Zadorozhny, MS, Research Assistant
California Department of Public Health, Richmond, CA, USA Edward Desmond, PhD, Research Scientist
Translational Genomics Research Institute (T-Gen), Phoenix, AZ, USA David M Engelthaler, Genome Sequencing and Data Analysis
London School of Hygiene & Tropical Medicine TB Centre David AJ Moore, MD, Professor of Infectious Diseases, MODS Consultant
Universidad Peruana Cayetano Heredia, Lima, Perú Jorge Coronel, MS, MODS Collaborator
Author details
1Department of Family & Preventive Medicine, University of California,
San Diego, CA, USA.2Department of Biomedical Sciences, Stellenbosch
University, Cape Town, South Africa.3Division of Bioinformatics and Medical
Informatics, San Diego State University, San Diego, CA, USA.4Department of
Medicine, University of California, San Diego, CA, USA.5California Department
of Public Health, Richmond, CA, USA.6Department of Pathology, University
of Arkansas for Medical Sciences, Little Rock, AR, USA.7Hinduja National
Hospital, Mumbai, India.8Microbiology and Morphology Laboratory, Institute
of Phthisiopneumology, Chisinau, Moldova.
Received: 6 May 2014 Accepted: 24 October 2014 Published: 6 November 2014
References
1. World Health Organization:Global Tuberculosis Report 2013.Geneva; 2013. [http://apps.who.int/iris/bitstream/10665/91355/1/9789241564656_ eng.pdf]
2. Dye C, Williams BG:The population dynamics and control of tuberculosis.
Science2010,328:856–861.
3. Dharmadhikari AS, Basaraba RJ, Van Der Walt ML, Weyer K, Mphahlele M, Venter K, Jensen PA, First MW, Parsons S, McMurray DN, Orme IM, Nardel EA:Natural infection of guinea pigs exposed to patients with highly drug-resistant tuberculosis.Tuberculosis2011,91:329–338.
4. Escombe AR, Moore DAJ, Gilman RH, Pan W, Navincopa M, Ticona E, Martinez C, Caviedes L, Sheen P, Gonzalez A, Noakes CJ, Friedland JS, Evans CA:The infectiousness of tuberculosis patients coinfected with HIV.PLoS Med2008,5:1387–1397.
5. Fauci AS:Multidrug-resistant and extensively drug-resistant tuberculosis: the National Institute of Allergy and Infectious Diseases Research agenda and recommendations for priority research.J Infect Dis2008,
197:1493–1498.
6. Rodwell TC, Valafar F, Douglas J, Qian L, Garfein RS, Chawla A, Torres J, Zadorozhny V, Kim MS, Hoshide M, Catanzaro D, Jackson L, Lin G, Desmond E, Rodrigues C, Eisenach K, Victor TC, Ismail N, Crudu V, Gler MT, Catanzaro A:Predicting extensively drug-resistantMycobacterium tuberculosis phenotypes with genetic mutations.J Clin Microbiol2014,52:781–789. 7. Almeida D, Rodrigues C, Udwadia ZF, Lalvani A, Gothi GD, Mehta P, Mehta
A:Incidence of multidrug-resistant tuberculosis in urban and rural India and implications for prevention.Clin Infect Dis2003,36:152–154. 8. Jenkins HE, Plesca V, Ciobanu A, Crudu V, Galusca I, Soltan V, Serbulenco A,
Zignol M, Dadu A, Dara M, Cohen T:Assessing spatial heterogeneity of multidrug-resistant tuberculosis in a high-burden country.Eur Respir J
2013,42:1291–1301.
10. World Health Organization:Laboratory Services in Tuberculosis Control, Part III: Culture.Geneva; 1998. [http://whqlibdoc.who.int/hq/1998/ WHO_TB_98.258_(part3).pdf].
11. Lin SYG, Rodwell TC, Victor TC, Rider EC, Pham L, Catanzaro A, Desmond EP: Pyrosequencing for rapid detection of extensively drug-resistant Mycobacterium tuberculosisin clinical isolates and clinical specimens.
J Clin Microbiol2014,52:475–482.
12. World Health Organization:Policy Guidance on Drug-Susceptibility Testing (DST) of Second-Line Antituberculosis Drugs.Geneva; 2008.
[http://whqlibdoc.who.int/hq/2008/WHO_HTM_TB_2008.392_eng.pdf?ua=1] 13. Rodrigues C, Jani J, Shenai S, Thakkar P, Siddiqi S, Mehta A:Drug
susceptibility testing ofMycobacterium tuberculosisagainst second-line drugs using the Bactec MGIT 960 system.Int J Tuberc Lung Dis2008, 12:1449–1455.
14. Lin SYG, Desmond E, Bonato D, Gross W, Siddiqi S:Multicenter evaluation of Bactec MGIT 960 system for second-line drug susceptibility testing of Mycobacterium tuberculosiscomplex.J Clin Microbiol2009,47:3630–3634. 15. Barnard M, Albert H, Coetzee G, O’Brien R, Bosman ME:Rapid molecular
screening for multidrug-resistant tuberculosis in a high-volume public health laboratory in South Africa.Am J Respir Crit Care Med2008, 177:787–792.
16. Brossier F, Veziris N, Aubry A, Jarlier V, Soudakoff W:Detection by GenoType MTBDRsltest of complex mechanisms of resistance to second-line drugs and ethambutol in multidrug-resistant Mycobacterium tuberculosis complex isolates.J Clin Microbiol2010,48:1683–1689. 17. Kiet VS, Lan NT, An DD, Dung NH, Hoa DV, van Vinh CN:Evaluation of the
MTBDRsltest for detection of second-line-drug resistance in Mycobacterium tuberculosis.J Clin Microbiol2010,48:2934–2939. 18. Diggle MA, Clarke SC:PyrosequencingTM.Mol Biotechnol2004,28:129–137. 19. Bravo LTC, Tuohy MJ, Ang C, Destura RV, Mendoza M, Procop GW, Gordon
SM, Hall GS, Shrestha NK:Pyrosequencing for rapid detection of Mycobacterium tuberculosisresistance to rifampin, isoniazid, and fluoroquinolones.J Clin Microbiol2009,47:3985–3990.
20. Moore DAJ, Evans CAW, Gilman RH, Caviedes L, Coronel J, Vivar A, Sanchez E, Piñedo Y, Saravia JC, Salazar C, Oberhelman R, Hollm-Delgado MG, LaChira D, Escombe R, Friedland JS:Microscopic-observation drug-susceptibility assay for the diagnosis of TB.N Engl J Med2006, 355:1539–1550.
21. Trollip AP, Moore D, Coronel J, Caviedez L, Klages S, Victor T, Romancenco E, Crudu V, Ajbani K, Vineet VP, Rodrigues C, Jackson RL, Eisenach K, Garfein RS, Rodwell TC, Desmond E, Groessl EJ, Ganiats TG, Catanzaro A: Second-line drug susceptibility breakpoints forMycobacterium tuberculosisusing the MODS assay.Int J Tuberc Lung Dis2014, 18:227–232.
22. Global Consortium for Drug-resistant Tuberculosis Diagnostics. [http://gcdd.ucsd.edu]
23. LogMeIn.[https://secure.logmein.com/]
doi:10.1186/1745-6215-15-434
Cite this article as:Hilleryet al.:The Global Consortium for Drug-resistant Tuberculosis Diagnostics (GCDD): design of a multi-site, head-to-head study of three rapid tests to detect extensively drug-resistant tuberculosis.
Trials201415:434.
Submit your next manuscript to BioMed Central and take full advantage of:
• Convenient online submission
• Thorough peer review
• No space constraints or color figure charges
• Immediate publication on acceptance
• Inclusion in PubMed, CAS, Scopus and Google Scholar
• Research which is freely available for redistribution