Abstract: Content based image retrieval (CBIR) models become popular for retrieving images connected to the query image (QI) from massive dataset. Feature extraction process in CBIR plays a vital role as it affects the system’s performance. This paper is focused on the design of deep learning (DL) model for feature extraction based CBIR model. The presented model utilizes a ResNet50 with co-occurrence matrix (RCM) model for CBIR. Here, the ResNet50 model is applied for feature extraction of the QI. Then, the extracted features are placed in the feature repository as a feature vector. The RCM model computes the feature vector for every input image and compares it with the features present in the repository. Then, the images with maximum resemblance will be retrieved from the dataset. In addition, the resemblance between the feature vectors is determined by the use of co-occurrence matrix subtraction process. Besides, structural similarity (SSIM) measure is applied for the validation of the similarity among the images. A comprehensive results analysis takes place by the use of Corel 10K dataset. The experimental outcome indicated the superiority of the RCM model with respect to precision, recall and SSIM.
Index Terms: Deep learning; CBIR; Feature extraction; ResNet.
I. INTRODUCTION
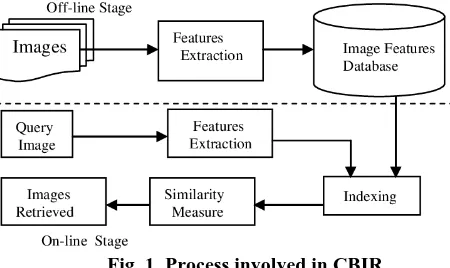
[image:1.595.309.534.192.326.2]Image retrieval task becomes essential due to the massive requirement of multimedia processing for the investigation of data being generated in real time. Hence, it is needed to design and improvise the image retrieval approaches for searching and browsing images on the internet in an easier and effective way. The classical and general image retrieval process utilizing the keyword searching model faces several limitations. It requires huge manual process and is dependent on the individual perspective that leads to improper retrieval performance. For resolving these issues, content based image retrieval (CBIR) is introduced. It comprises a collection of models and techniques which focuses on the low level image features, for instance, texture measurement, color as well as shape signatures for retrieving images from the dataset of images based on the query image (QI) provided by the user [1]. The processes involved in the CBIR system are shown in Fig. 1.
Revised Manuscript Received on October 05, 2019.
P. Anandababu, Research Scholar, Department of Computer and
Information Science, Annamalai University, [email protected].
M. Kamarasan, Assistant professor, Department of Computer and
Information Science, Annamalai University [email protected].
.
Fig. 1. Process involved in CBIR
The current CBIR models results are quite unacceptable for users of high level concepts since it mainly focuses on the images with low level visual features and high level features are not included in the retrieval procedure. So, a set of two models are enhanced namely Region based image retrieval (RBIR) based on image representation to segmented region features depending upon the image view of the user. The latter one is the Relevance feedback (RF) that ensures the user inclination. A major intention of the CBIR model exists in the image retrieval process which is relevant to the QI from the image dataset. CBIR make use of model of ‘‘query by example” that performs the identical image retrieval process to the provided image using a description of the QI provided by the user. It operates on the way of feature extraction from query images and then finds for the extracted features. A feature vector is determined for the filtered feature of the QI. The CBIR defines every image in the dataset using a vector. Once the QI is provided, a comparison is made between the feature vectors of the QI and the vectors saved for each image present in the dataset. Finally, the images which have maximum resemblance with the high features will be retrieved.
For enhancing the retrieval results of the Region-based visual signatures, [1, 2] is based on the concept of segmenting images. Depending upon the interpretation of the optical system of the human, the images can be differentiation into the characteristics of region features using the image similarity. These approaches determined the segmented region features at object level and resemblance comparison is made at the region granularity where previous classical models perform retrieval and representation of the images by the use of global features. [3] carry out an image segmentation process for incorporating the local details to the image representation.
An Novel Framework For Content Based Image
Retrieval With Quality Assessment System using
Optimal Deep Convolution Neural Network
An Novel Framework For Content Based Image Retrieval With Quality Assessment System using
Optimal Deep Convolution Neural Network
A big false-image is developed [4] using the collection of whole regions of the alike images. For fastening the retrieval procedure, the portions of the false-images are grouped in an incremental way to compressed representation. [5] altered the low-level features of input regions for creating a collection of images and determined the weights of the features from the synthetic images in each query portion. Next, the feature weights are accumulated by the system based on the images which are manipulated in a heuristic way. [6] utilized an adjacency matrix for the representation of the regions connectivity in the images, and presented a graph based model for updating the model query using the adjacency matrix. The portions of the feedback images are grouped for attaining the proper query. Next, using the QI, the important regions are learnt and region and feature weights are determined based on the clustered output by the optimization model. The main aim of utilizing region based methods is to improve the capability of capturing and understanding the user perspective.
Few works employ deep learning (DL) concepts to design CBIR models. It is because of the characteristic of processing ability and affordability. Deep Convolutional Neural Networks (CNN) is an effective DL model used to analyze the visual details. The CNN contains a number of convolution and subsampling layers with non-linear neural activation followed with the fully connected layers. It implies that the QI is provided to the neural network (NN) model as a 3-dimensional tensor. The 3-dimensional filters are learned and employed to every layer where convolution takes place and the outcome is given to the neurons of the subsequent layer for non-linear transformation by the use of proper activation functions. Subsequent to many conv layers and subsampling, the DL model modifies to FC layers and a 1-dimensional signals. The activations are generally employed as deep representations to classify, cluster and retrieve images.
In the recent days, deep CNN us developed as an important platform in the computer vision field because of classification, clustering or retrieval. It is also depicted that the filtered features from the CNN activation which undergo training in a completely supervised fashion on a large, predefined collection of object recognition process could be purposed for effective recognition processes [7]. Inspired from the effective performance of the deep CNN, it is employed in the area of CBIR. The basic way of employing deep CNN in the retrieval field lies in the extraction of feature representation from a pretrained model through feeding images in the input layer of the model and deriving activation values from FC layers that is defined capturing of high-level semantic details, or from the convolutional layers make use of the spatial details of the layers utilizing sumpooling or max-pooling models.
A validation of CNN features takes place in different identification process comprising the image retrieval process which improves the fundamental results utilizing the spatial details. In [8], an image retrieval model where a CNN pretrained model undergo retraining on diverse dataset with related image statistics and classes to the dataset assumed at the test time and attains maximum results. In another aspect, the CNN activation at multi-scale levels is integrated to the
VLAD representation. In [9], a feature aggregation pipeline is introduced by the use of sum pooling. In [10], a cross-dimensional weighting and aggregation of deep CNN layer outcome is presented. A method which generates the compact feature vectors produced from the convolutional layer activations which encodes diverse image portions are presented in [11]. In [12], a 3-level Siamense network is presented for weight optimization known as R-MAC representation to retrieve images by the use of triplet ranking loss. The features of CNN and the bag of words aggregation model is presented in [13] whereas the complementary benefits of the CNN features of diverse layers are introduced in [14] and outperforms the integration of many layers. In [15], a bilinear CNN-based architecture is developed in CBIR field where a bilinear root pooling is presented for projecting the features filtered from two parallel CNN models to a low dimension and the resultant model undergo training on the image retrieval dataset by the use of unsupervised training.
In [16], a new distance metric learning technique called weakly-supervised deep metric learning is introduced for retrieving social images through the exploitation of the knowledge from the community contributed images linked to the user defined labels. The learned measure saves the semantic arrangement in the textual space and the visual organization in the novel visual space concurrently that enables learning of the semantic-aware distance measure. In [17], a weakly supervised Deep Matrix Factorization model is introduced which uncover the latent image as well as tag representations. A deep CNN undergo retraining with similarity learning objective function assuming the triplet of related and unrelated instances attained from FC layers of the pretrained model, in [18]. A relevant model is presented in the face identification process by the use of triplet-based loss function.
This paper is focused on the design of deep learning (DL) model for feature extraction based CBIR model. The presented model utilizes a ResNet50 with co-occurrence matrix (RCM) model for CBIR. Here, the ResNet50 model is applied for feature extraction of the QI. Then, the extracted features are placed in the feature repository as a feature vector. The RCM model computes the feature vector for every input image and compares it with the features present in the repository. Then, the images with maximum resemblance will be retrieved from the dataset. In addition, the resemblance between the feature vectors is determined by the use of co-occurrence matrix subtraction process. Besides, structural similarity (SSIM) measure is applied for the validation of the similarity among the images. A comprehensive results analysis takes place by the use of Corel 10K dataset. The experimental outcome indicated the superiority of the RCM model with respect to precision, recall and SSIM.
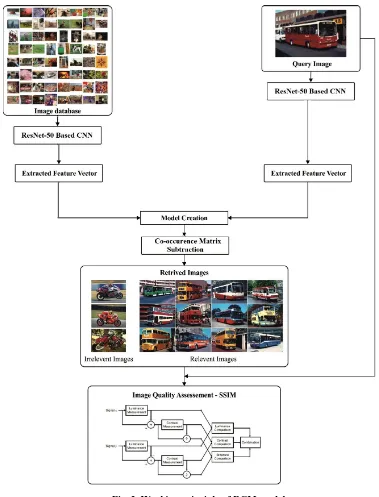
Fig. 2. Working principle of RCM model
II. RCM MODEL FOR CBIR
The working process of the presented RCM model is shown in Fig. 2. Initially, ResNet50 based CNN is applied to every image present in the database for feature extraction. Then, the extracted features are saved as a feature vector and stored in a repository. On applying the QI, the same ResNet50 based CNN model is applied and features are extracted. Next, the CM subtraction process takes place which identifies the actual difference between two feature vectors. Then, the image which acquires minimum value from the subtraction process is considered as a relevant image and is retrieved from the dataset. A total of 90 images will be retrieved for every QI given to the RCM model. Besides, SSIM measure is applied to compare the visual similarity between the QI and the retrieved images. The RestNet50
based CNN model and CM subtraction are explained in the following subsections.
A. ResNet50 based feature extraction
Resnet50 also known as Residual identifies the mapping utilizing the shortcuts. The ResNet comprises many succeeding residual modules which is the fundamental unit of ResNet. The training process becomes hard since the network goes deep. In general, the input feature map will be followed by convolutional filter, non-linear activation and pooling operations. At the end, the output layer is also present. In this case, back propagation algorithm is developed.
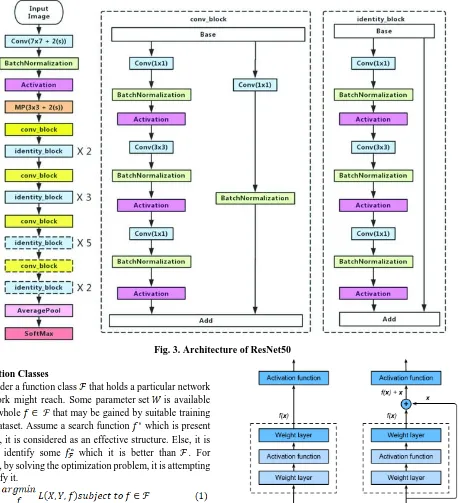
The convergence becomes difficult in case of deeper networks. The overall architectural model of RestNet50 is shown in Fig. 3. Here, the residual learning is provided as input straightaway to the outcome of the convolution output, and then appended together and transmit it to the non-linear activation (Relu) and pooling. For retaining the identical output sizes, the input
An Novel Framework For Content Based Image Retrieval With Quality Assessment System using
Optimal Deep Convolution Neural Network
Fig. 3. Architecture of ResNet50 Function Classes
Consider a function class that holds a particular network framework might reach. Some parameter set is available for the whole that may be gained by suitable training of the dataset. Assume a search function which is present in the , it is considered as an effective structure. Else, it is tried to identify some which it is better than . For instance, by solving the optimization problem, it is attempting to identify it.
It is desired that the is effective over the . However, it is unsure to appear that , might get worse. It is a case that we regularly discover the design that embedding layers will not generate the network as highly expressive, it gets altered in some ways. When a huge function class comprises the small ones, it is ensured that it can be enhanced by the network expressive power. Every extra layer comprising an identity function that acts as a heart of the ResNet. Upon training the included layer for identifying the mapping , the presented model will be effective. For dataset fitting into the training model, superior solutions are derived and are employed to reduce errors in the training procedure. In a layer, the identity function could be
null and tends to an easier solution known as residual block.
Fig. 4. Difference between regular block (left) and residual block (right)
Residual Blocks
The difference between the regular and residual blocks is shown in Fig. 4. In this case, the input can be represented as . It is considered that the optimal mapping is done for deriving f(x) learning to be applied as an activation function input. The portions which are fitted into the dotted-line box should be mapped into f(x) indirectly. While the definite layers are not required, it is hard instead it retrain the input x. The portion in the dotted line box in the right image needs to deviate the parameters from the identity, as it is returns to x+f(x). The residual mapping is easy to optimize in a possible way and is needed to assume the value
model of 3×3 convolutional layer. With comparable output channel count, the residual block has a pair of convolutional layers with the 3x3 sizes. Using a ReLU activation function and batch normalization layer, each convolutional layer is followed. Earlier to the final ReLU activation function, the input layers are appended and 2 conv operations are missed. ResNet Model
The basic two ResNet layers are identical to GoogLeNet as represented here: with 64 output channels, 7 × 7 convolutional layers and 2 strides succeeding to 3×3 maximum pooling layer with 2 strides are employed. The difference is layering of batch normalization consequent to each ResNet convolutional layer. A set of 4 blocks are employed by GoogLeNet which is composed of Inception blocks. However, 4 modules are utilized by ResNet in which each one applies diverse residual blocks with identical output channel count. The channel count in early module is comparable to the input channel count. So, using a set of 2 strides, maximum pooling layer is applied earlier and it not required reducing the width as well as height. The number of channels is increased twice on comparing with the earlier module in the initial residual block where each module and width and height is reduced to half. In ResNet, two whole residual blocks are included. In each module, a set of two
residual blocks are applied. Comparable to GoogLeNet, global average pooling layer with FC layer is applied. With the initial and final convolutional and connected layer, a total of 50 layers are present. Hence, it is named as ResNet50.
Pre-Trained Resnet50 as a Feature Extractor
In Resnet50, the total number of layers is 50. In this pre-trained Resnet50 network, the final FC layer undergoes extraction and is utilized as a feature vector. Though Resnet50 is utilized on diverse dataset, it operates in an accurate way by offering optimal performance on the applied images. Here, a total of 1,00,352 features are attained from Resnet50 and is utilized in the further processes.
B. Co-occurrence Matrix (CM) comparison
Let consider the input image has Nr and Nc pixels in the vertical and horizontal directions correspondingly. Consider a horizontal space domain Zc = {1, 2, . . . , Nc} and is a vertical space domain. Once the direction θ and distance d are provided, the matrix component can be expressed by determining the pixel logarithm of co-occurrence grey level and . Consider the
distance is 1, equals correspondingly,
and is calculated as:
where, a, b, c and d indicate the variations in the chosen determining windows and # represents the pixel logarithm that establish the brackets.
A set of five processes involved in the extraction of the features and is listed below.
Step 1: Color conversion
Initially, the transformation of the images from color to grayscale takes place using the following formula
where GS indicates the grayscale, indicates the red, green and blue values correspondingly.
Step 2. Quantification of grayscale
Due to the fact that the grayscale involves 256 values, the respective CM is also present in the form of 256 × 256. Based on the human visual features, the resemblance of many images is mostly differentiated by the relevant coarse texture features. Step 3. Determination of Feature values
A set of four CM is generated based on above Eqs. (2)-(5) in four directions. The four texture features are capacity, entropy, moment of inertia and relevance is determined. At the end, the mean and standard deviation of every feature is considered as every component of the texture features.
Step 4. Internal normalization
For an image and the respective feature vector , it is considered that the feature component value fulfills the Gaussian distribution. The Gaussian normalization model is applied for the implementation of the internal normalization to ensure every feature of identical weight as given in Eq. (6):
where, represents the mean and standard
deviation. will be unitized on range [−1,1]. Step 5. Feature comparison
An Novel Framework For Content Based Image Retrieval With Quality Assessment System using
Optimal Deep Convolution Neural Network
III. PERFORMANCE VALIDATION A.Dataset used
[image:6.595.72.281.218.331.2]The highlights of the presented RCM model are tested against the benchmark Corel10K dataset. The applied dataset comprises a set of 10,908 distinct images where every image occupies a size of 256x384 or 384x256 [19]. A set of 100 classes exist in the applied dataset and around 100 images are presented under every class. This study make use of a set of 10 classes with each one consists of 100 images. The images come undergo diverse groups from animals, sports, food and so on. Some of the sample images from every set are shown in Fig. 5.
Fig. 5. Sample Test Image B. Measures
A set of three measures are applied in this study to analyze the performance of the RCM model namely precision, recall and SSIM. The formulas derived for these measures are given below. To verify the consistent retrieval result, two additional measures namely average precision and average recall are utilized.
C. Qualitative analysis
A detailed qualitative analysis is initially made to verify the betterment of the applied RCM model. Fig. 6 shows the sample retrieval results of the applied query image. From the figure, it is evident that the query image ‘bus’ is applied to the presented model. Then, the presented model effectively retrieves around a set of 90 related images and is shown in Fig. 6. The figure clearly states that the RCM model effectively retrieves almost identical images in most of the cases. The maximum number of bus images is retrieved by the presented RCM model.
D. Results analysis
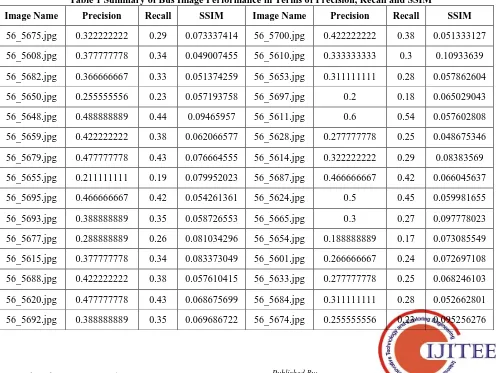
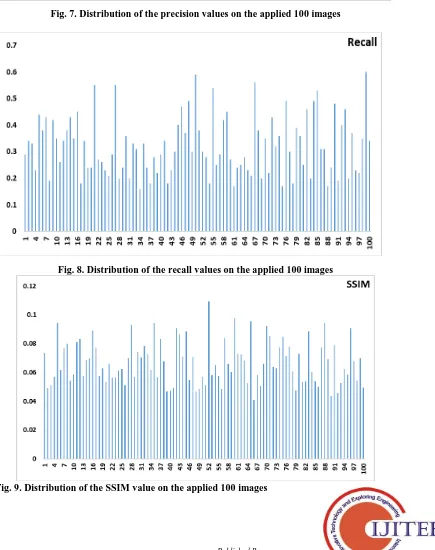
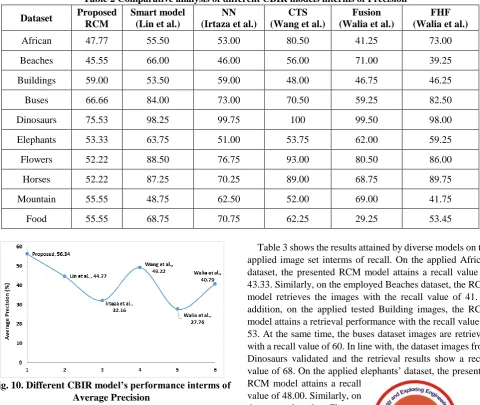
[image:6.595.52.550.436.809.2]Table 1 shows the results attained by the RCM model on the retrieval of bus image. At each round, the query image and the retrieved results performance are determined by the calculation of precision, recall and SSIM. The table offered the average values of the measures on the applied 100 images and corresponding results. For instance, on the applied query image of Image 56_5675, the retrieval performance is attained by the precision value of 0.3222, recall value of 0.29 and SSIM value of 0.0733. Similarly, on all the applied query images, the corresponding measures are determined. Figs. 7-9 show the distribution of the precision, recall and SSIM values for the applied 100 images.
Table 1 Summary of Bus Image Performance in Terms of Precision, Recall and SSIM
Image Name Precision Recall SSIM Image Name Precision Recall SSIM
56_5675.jpg 0.322222222 0.29 0.073337414 56_5700.jpg 0.422222222 0.38 0.051333127
56_5608.jpg 0.377777778 0.34 0.049007455 56_5610.jpg 0.333333333 0.3 0.10933639
56_5682.jpg 0.366666667 0.33 0.051374259 56_5653.jpg 0.311111111 0.28 0.057862604
56_5650.jpg 0.255555556 0.23 0.057193758 56_5697.jpg 0.2 0.18 0.065029043
56_5648.jpg 0.488888889 0.44 0.09465957 56_5611.jpg 0.6 0.54 0.057602808
56_5659.jpg 0.422222222 0.38 0.062066577 56_5628.jpg 0.277777778 0.25 0.048675346
56_5679.jpg 0.477777778 0.43 0.076664555 56_5614.jpg 0.322222222 0.29 0.08383569
56_5655.jpg 0.211111111 0.19 0.079952023 56_5687.jpg 0.466666667 0.42 0.066045637
56_5695.jpg 0.466666667 0.42 0.054261361 56_5624.jpg 0.5 0.45 0.059981655
56_5693.jpg 0.388888889 0.35 0.058726553 56_5665.jpg 0.3 0.27 0.097778023
56_5677.jpg 0.288888889 0.26 0.081034296 56_5654.jpg 0.188888889 0.17 0.073085549
56_5615.jpg 0.377777778 0.34 0.083373049 56_5601.jpg 0.266666667 0.24 0.072697108
56_5688.jpg 0.422222222 0.38 0.057610415 56_5633.jpg 0.277777778 0.25 0.068246103
56_5620.jpg 0.477777778 0.43 0.068675699 56_5684.jpg 0.311111111 0.28 0.052662801
56_5669.jpg 0.5 0.45 0.089222546 56_5666.jpg 0.233333333 0.21 0.040880307
56_5617.jpg 0.2 0.18 0.077189973 56_5668.jpg 0.622222222 0.56 0.057881212
56_5622.jpg 0.377777778 0.34 0.057685923 56_5652.jpg 0.422222222 0.38 0.050703948
56_5607.jpg 0.266666667 0.24 0.062746195 56_5625.jpg 0.222222222 0.2 0.065861863
56_5656.jpg 0.266666667 0.24 0.05329652 56_5612.jpg 0.388888889 0.35 0.092044378
56_5672.jpg 0.611111111 0.55 0.066302892 56_5639.jpg 0.244444444 0.22 0.085449893
56_5663.jpg 0.3 0.27 0.056494301 56_5606.jpg 0.477777778 0.43 0.064178647
56_5634.jpg 0.288888889 0.26 0.056398573 56_5660.jpg 0.355555556 0.32 0.062884919
56_5644.jpg 0.255555556 0.23 0.061196068 56_5683.jpg 0.4 0.36 0.077502645
56_5629.jpg 0.233333333 0.21 0.062233883 56_5647.jpg 0.188888889 0.17 0.08470033
56_5603.jpg 0.322222222 0.29 0.051004262 56_5681.jpg 0.544444444 0.49 0.071487435
56_5685.jpg 0.611111111 0.55 0.069882835 56_5661.jpg 0.333333333 0.3 0.078081841
56_5602.jpg 0.222222222 0.2 0.093074451 56_5619.jpg 0.2 0.18 0.06087288
56_5627.jpg 0.266666667 0.24 0.056765441 56_5609.jpg 0.433333333 0.39 0.047598644
56_5646.jpg 0.4 0.36 0.074099032 56_5640.jpg 0.4 0.36 0.073301355
56_5676.jpg 0.222222222 0.2 0.07050971 56_5618.jpg 0.277777778 0.25 0.053261322
56_5689.jpg 0.366666667 0.33 0.078628644 56_5643.jpg 0.511111111 0.46 0.053624031
56_5657.jpg 0.344444444 0.31 0.073150882 56_5632.jpg 0.222222222 0.2 0.088585303
56_5671.jpg 0.177777778 0.16 0.061983633 56_5691.jpg 0.544444444 0.49 0.060303571
56_5686.jpg 0.366666667 0.33 0.094308811 56_5623.jpg 0.588888889 0.53 0.054015263
56_5696.jpg 0.266666667 0.24 0.05650062 56_5637.jpg 0.344444444 0.31 0.049945021
56_5645.jpg 0.2 0.18 0.083089476 56_5642.jpg 0.344444444 0.31 0.077251175
56_5651.jpg 0.311111111 0.28 0.067508308 56_5605.jpg 0.188888889 0.17 0.094396497
56_5621.jpg 0.244444444 0.22 0.046607806 56_5690.jpg 0.266666667 0.24 0.069523974
56_5649.jpg 0.322222222 0.29 0.047495335 56_5630.jpg 0.533333333 0.48 0.043828979
56_5641.jpg 0.377777778 0.34 0.049066454 56_5635.jpg 0.211111111 0.19 0.078701323
56_5638.jpg 0.2 0.18 0.090613977 56_5670.jpg 0.444444444 0.4 0.045645553
56_5658.jpg 0.255555556 0.23 0.086475881 56_5699.jpg 0.511111111 0.46 0.052717191
56_5616.jpg 0.333333333 0.3 0.070641252 56_5613.jpg 0.222222222 0.2 0.062162075
56_5664.jpg 0.444444444 0.4 0.088483191 56_5678.jpg 0.411111111 0.37 0.058425749
56_5604.jpg 0.522222222 0.47 0.055038803 56_5662.jpg 0.255555556 0.23 0.090696689
56_5631.jpg 0.411111111 0.37 0.071021431 56_5667.jpg 0.244444444 0.22 0.067896904
56_5694.jpg 0.544444444 0.49 0.046796591 56_5680.jpg 0.388888889 0.35 0.054256744
56_5698.jpg 0.333333333 0.3 0.048175182 56_5636.jpg 0.666666667 0.6 0.069875509
An Novel Framework For Content Based Image Retrieval With Quality Assessment System using
Optimal Deep Convolution Neural Network
Fig. 7. Distribution of the precision values on the applied 100 images
Fig. 8. Distribution of the recall values on the applied 100 images
[image:8.595.107.542.258.808.2]To verify the superior retrieval performance of the applied RCM model, an extensive comparative analysis is made between the presented RCM and existing models under three measures. Table 2 shows the results attained by diverse models on the applied image set interms of precision. For comparing purposes, a smart retrieval model [20], NN based model [21], color, texture and shape (CTS) retrieval [22] model, fusion based model [23] and fast hybrid framework (FHF) [24] is employed.
On the applied African dataset, the presented RCM model attains a precision value of 47.77. Similarly, on the employed Beaches dataset, the RCM model retrieves the images with the precision value of 45.55. In addition, on the applied tested Building images, the RCM model attains a retrieval performance with the precision value of 59. At the same time, the buses dataset images are retrieved with a precision value of 66.66. In line with, the dataset images from Dinosaurs validated and the retrieval results show a precision value of 75.53. On the applied elephants dataset, the presented RCM model attains a precision value of 53.33. Similarly, on the employed Flowers dataset, the RCM model retrieves the images with the precision value of 52.22. In addition, on the applied tested Horses images, the RCM model attains a retrieval performance with the precision value of 52.22. At
the same time, the mountain dataset images are retrieved with a precision value of 55.55. In line with, the dataset images from food validated and the retrieval results show a precision value of 55.55.
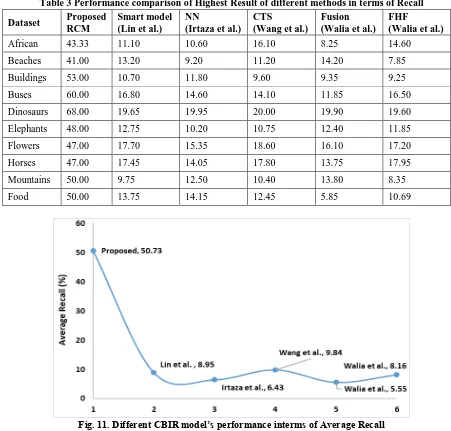
[image:9.595.57.538.367.772.2] [image:9.595.55.535.370.773.2]To verify the consistent performance on the applied test images, an average precision value is determined for all the employed models. Fig. 10 shows the analysis of the retrieval performance of diverse models interms of average precision. The figure clearly depicted that the presented RCM model shows maximum retrieval results with the average precision value of 56.34. At the same time, the CTS method tries to show competitive results by obtaining the high average precision value of 49.22. On continuing with, the existing smart model approaches to an average precision value of 44.77 and the FHF model shows slightly degraded results with the average precision value of 40.79. Likewise, the existing NN based model shows poor retrieval performance by attaining the low average precision value of 32.16. However, worse retrieval results are generated by the applied fusion based model by obtaining lowest average precision value of 27.76. The maximum average precision value of 56.34 by the presented RCM model shows its consistent retrieval results on the applied images.
Table 2 Comparative analysis of different CBIR models interms of Precision Dataset Proposed
RCM
Smart model (Lin et al.)
NN (Irtaza et al.)
CTS (Wang et al.)
Fusion (Walia et al.)
FHF (Walia et al.)
African 47.77 55.50 53.00 80.50 41.25 73.00
Beaches 45.55 66.00 46.00 56.00 71.00 39.25
Buildings 59.00 53.50 59.00 48.00 46.75 46.25
Buses 66.66 84.00 73.00 70.50 59.25 82.50
Dinosaurs 75.53 98.25 99.75 100 99.50 98.00
Elephants 53.33 63.75 51.00 53.75 62.00 59.25
Flowers 52.22 88.50 76.75 93.00 80.50 86.00
Horses 52.22 87.25 70.25 89.00 68.75 89.75
Mountain 55.55 48.75 62.50 52.00 69.00 41.75
Food 55.55 68.75 70.75 62.25 29.25 53.45
Fig. 10. Different CBIR model’s performance interms of Average Precision
Table 3 shows the results attained by diverse models on the applied image set interms of recall. On the applied African dataset, the presented RCM model attains a recall value of 43.33. Similarly, on the employed Beaches dataset, the RCM model retrieves the images with the recall value of 41. In addition, on the applied tested Building images, the RCM model attains a retrieval performance with the recall value of 53. At the same time, the buses dataset images are retrieved with a recall value of 60. In line with, the dataset images from Dinosaurs validated and the retrieval results show a recall value of 68. On the applied elephants’ dataset, the presented RCM model attains a recall
value of 48.00. Similarly, on
An Novel Framework For Content Based Image Retrieval With Quality Assessment System using
Optimal Deep Convolution Neural Network
dataset, the RCM model retrieves the images with the recall value of 47.00. In addition, on the applied tested Horses images, the RCM model attains a retrieval performance with the recall value of 47.00. At the same time, the mountain dataset images are retrieved with a recall value of 50. In line with, the dataset images from food validated and the retrieval results show a recall value of 50.
For ensuring the uniform retrieval performance on the applied test images, an average recall value is determined for all the employed models. Fig. 11 shows the analysis of the retrieval performance of diverse models interms of average recall. The figure clearly depicted that the presented RCM model shows maximum retrieval results with the average
[image:10.595.71.522.214.645.2]recall value of 50.73. At the same time, the CTS method tries to show slightly manageable outcome over the compared methods with the average recall value of 9.84. On continuing with, the existing smart model approaches to an average recall value of 8.95 and the FHF model shows slightly degraded results with the average recall value of 8.16. Likewise, the existing NN based model shows poor retrieval performance by attaining the low average recall value of 6.43. However, worse retrieval results are generated by the applied fusion based model by obtaining lowest average recall value of 5.55. The maximum average recall value of 50.73 by the presented RCM model shows its consistent retrieval results on the applied images.
Table 3 Performance comparison of Highest Result of different methods in terms of Recall Dataset Proposed
RCM
Smart model (Lin et al.)
NN
(Irtaza et al.) CTS
(Wang et al.)
Fusion (Walia et al.)
FHF
(Walia et al.)
African 43.33 11.10 10.60 16.10 8.25 14.60
Beaches 41.00 13.20 9.20 11.20 14.20 7.85
Buildings 53.00 10.70 11.80 9.60 9.35 9.25
Buses 60.00 16.80 14.60 14.10 11.85 16.50
Dinosaurs 68.00 19.65 19.95 20.00 19.90 19.60
Elephants 48.00 12.75 10.20 10.75 12.40 11.85
Flowers 47.00 17.70 15.35 18.60 16.10 17.20
Horses 47.00 17.45 14.05 17.80 13.75 17.95
Mountains 50.00 9.75 12.50 10.40 13.80 8.35
Food 50.00 13.75 14.15 12.45 5.85 10.69
Fig. 11. Different CBIR model’s performance interms of Average Recall By looking into the above tables and figures, it is obviously
shown that the presented RCM model attains the maximum retrieval performance with the highest average precision of 56.34 and recall of 50.73. These values confirmed the effective retrieval performance of the presented model under several performance measures.
IV. CONCLUSION
In this paper, a new DL model for feature extraction based CBIR is presented. Here, ResNet50 model determines the
features of every image and a CM subtraction takes place between the QI and retrieved images. When the outcome is zero, it implies that the retrieved and QI are identical. By the use of subtraction outcome, a set of 90 resemblance images are retrieved for every QI. In addition, the SSIM value is also determined to assess the resemblance between the QI and retrieved images. The highlights of the presented RCM model are tested against the benchmark Corel10K dataset. The
presented RCM model
attains the maximum
the highest average precision of 56.34 and recall of 50.73
REFERENCES
1. Kanimozhi, T., Latha, K., 2013. A Meta-heuristic optimization
approach for content based image retrieval using relevance feedback method. In: Proceedings of the World Congress on Engineering 2013 London, U.K
2. Yuvaraj, D., Hariharan, S., 2016. Content-based image retrieval based
on integrating region segmentation and colour histogram. Learning 2, 12
3. Yang, X.-S., 2010. Firefly algorithm, stochastic test functions and
design optimisation. Int. J. Bio-Inspired Comput. 2, 78–84.
4. Feng, L., Wu, J., Liu, S., Zhang, H., 2015. Global correlation
descriptor: a novel image representation for image retrieval. J. Vis. Commun. Image Represent. 33, 104– 114
5. Aggarwal, G., Ashwin, T.V., Ghosal, S., 2002. An image retrieval
system with automatic query modification. IEEE Trans. Multimedia 4, 201–214
6. Chuech-Yu, L., Ming-Chou, S., Chiou-Ting, H. Image retrieval with
relevance feedback based on graph-theoretic region correspondence estimation. In: Proceedings of the 17th International Conference on Pattern Recognition, 2004. ICPR 2004, vol. 3, 2004, pp. 842–845. 7. J. Donahue, Y. Jia, O. Vinyals, J. Hoffman, N. Zhang, E. Tzeng, T.
Darrell, DeCAF: a deep convolutional activation feature for generic visual recognition, in: Proceedings of the 31st International Conference on Machine Learning, ICML, 2014, pp. 647–655.
8. A. Babenko, A. Slesarev, A. Chigorin, V. Lempitsky, Neural codes for
image retrieval, in: Proceedings of the European Conference on Computer Vision (ECCV), Springer, 2014, pp. 584–599
9. A. Babenko, V. Lempitsky, Aggregating local deep features for image
retrieval, in: Proceedings of the IEEE International Conference on Computer Vision, 2015, pp. 1269–1277.
10. Y. Kalantidis, C. Mellina, S. Osindero, Cross-dimensional weighting
for aggregated deep convolutional features, in: Proceedings of the European Conference on Computer Vision (ECCV) Workshops, Springer, 2015, pp. 685–701.
11. G. Tolias, R. Sicre, H. Jégou, Particular object retrieval with integral
max-pooling of CNN activations, in: Proceeding of the 4th International Conference on Learning Representations (ICLR), 2016. 12. A. Gordo, J. Almazán, J. Revaud, D. Larlus, Deep image retrieval:
learning global representations for image search, in: Proceedings of the European Conference on Computer Vision, Springer, 2016, pp. 241–257.
13. E. Mohedano, K. McGuinness, N.E. O’Connor, A. Salvador, F.
Marques, X. Giro-i Nieto, Bags of local convolutional features for scalable instance search, in: Proceedings of the 2016 ACM on International Conference on Multimedia Retrieval, ACM, 2016, pp. 327–331.
14. W. Yu, K. Yang, H. Yao, X. Sun, P. Xu, Exploiting the complementary
strengths of multi-layer CNN features for image retrieval, Neurocomputing 237 (2017) 235–241.
15. A. Alzu’bi, A. Amira, N. Ramzan, Content-based image retrieval with
compact deep convolutional features, Neurocomputing 249 (2017) 95–105.
16. T.-Y. Lin, A. RoyChowdhury, S. Maji, Bilinear CNN models for
fine-grained visual recognition, in: Proceedings of the IEEE International Conference on Computer Vision, 2015, pp. 1449–1457.
17. Z. Li, J. Tang, Weakly supervised deep matrix factorization for social
image understanding, IEEE Trans. Image Process. 26 (1) (2017) 276–288.
18. J. Wan, D. Wang, S.C.H. Hoi, P. Wu, J. Zhu, Y. Zhang, J. Li, Deep
learning for content-based image retrieval: a comprehensive study, in: Proceedings of the ACM International Conference on Multimedia, ACM, 2014, pp. 157–166.
19. Corel-5K and Corel-10K databases.
http://www.ci.gxnu.edu.cn/cbi/Dataset.aspx.
20. Lin CH, Chen RT, Chan YK. A smart content-based image retrieval
system based on color and texture feature. Image Vis Comput 2009;27:658–65.
21. Irtaza A, Arfan Jaffar M, Aleisa E, Choi TS. Embedding neural
networks for semantic association in content based image retrieval. Multimedia Tools Appl 2014;72:1911–31.
22. Wang XY, Yu YJ, Yang HY. An effective image retrieval scheme
using color, texture and shape feature. Comput Stand Interfaces 2011;33:59–68.
23. Walia E, Pal A. Fusion framework for effective color image retrieval. J
Vis Commun Image Represent 2014;25:1335–48.
24. Walia E, Vesal S, Pal A. An effective and fast hybrid framework for