The Development and Evaluation of
Supracolloidal Monolithic Structures for
Applications in Separation Science
By
Christopher Desire
A thesis submitted in fulfillment of the requirements for
the degree of
Doctor of Philosophy
School of Physical Sciences
University of Tasmania
This thesis contains no material which has been accepted for a degree or diploma by the University or any other institution, except by way of background information and duly acknowledged in the thesis, and to the best of my knowledge and belief no material previously published or written by another person except where due acknowledgement is made in the text of the thesis, nor does the thesis contain any material that infringes copyright.
The publishers of the papers comprising Chapters 1 and 3 to 7 hold the copyright for that content, and access to the material should be sought from the respective journals. The remaining non published content of the thesis may be made available for loan and limited copying and communication in accordance with the Copyright Act 1968.
This thesis also consists of my own work, with the following exceptions:
• Chapter 3 - Mechanical testing was performed at the Department of Materials Engineering, Monash University (Clayton, Victoria, Australia) by Tara L. Schiller with the assistance of Mr Silvio Mattievich.
• Chapter 5 - Elemental analysis was performed by Thomas Rodemann from the Central Science Laboratory (CSL) at the University of Tasmania (Hobart, Tasmania, Australia).
• Chapter 6 - Crystal structures were obtained by Guy Clarkson (Department of Chemistry, University of Warwick, United Kingdom).
Christopher Desire August 2017
iii
Acknowledgements
Firstly, I would like to acknowledge my supervisors Prof. Emily Hilder and Dr Dario Arrua. I am extremely grateful for their support and the opportunities they enabled me to pursue during my PhD candidature. I would also like to acknowledge Prof. Stefan Bon who provided me with the opportunity to spend part of my PhD under his supervision and be an active member of his research team. His kindness and support is much appreciated. In addition I would like to thank Dr Tara Schiller for her support during my early candidature and when I spent time overseas.
I would also like to take the opportunity to thank Dr Peter Smith for his ongoing support and interest in my endeavours during both my undergraduate degree and PhD candidature. His passion for chemistry and supporting the next generation of students is one of the reasons this thesis exists.
To all the wonderful people I have had the privilege to work with over the past four years, including Andrea Loiterzo, Brooke Longbottom, Ross Jaggers, Samuel Wilson-Whitford, Matt Donald, Adam Sutton, Farhan Cecil, Umme Kalsoom, Amin
Khodabandeh, Fotouh Rasheed, Daniel Gstöttenmayr, Sara Thomas, Neeraj Verma, James Hsian-Meng Chan, Mohammad Talebi, Laura Tedone, Anton Peristyy, Eli Fornells Vernet, Joan Marc Cabot, Niall Macdonald, Sinéad Currivan, Disha
Choudhury and Esme Candish, you made the lab and office fun to be in. In particular I would like to thank all the members of ACROSS and the Discipline of Chemistry for their support during this time.
I would also like to thank the staff (past and present) from the Discipline of Chemistry for their support over my candidature, including Brendon Schollum, Graham Meridith, Andrew Grosse, and Murray Frith. In addition I would like to acknowledge the support and guidance I received from the Central Science
iv It has been an eventful past four years and I would like to thank my friends who have supported me during this time, including Lewis Russell and James Howard. In
particular I would like to thank the friends I spent many evenings with on the PS4, including Brendon Schollum, Tristan Davies, Reyne Pullen, Daniel Chaffelson, Daniel Bukofzer, and Andrew Herron. Hopefully there will be many more evenings like this to come and I thank you for my sanity, I think.
In addition, I would like to thank Bungie who created and maintained an immersive online world that I have spent much of the past three years in with those mentioned above. My immersion in the world of Destiny helped me to maintain my creativity and focus in order to overcome the challenges of PhD. I would also like to thank the members of the Destiny Community Podcast who provided a much-needed
distraction during the last six months of candidature.
v
Statement of Co-Authorship
The following people and institutions contributed to the publication of the work undertaken as part of this thesis:
Christopher Desire, School of Physical Sciences, UTAS = Candidate
Aminreza Khodabandeh, School of Physical Sciences, UTAS = Author 1
Tara L. Schiller, WMG, The University of Warwick = Author 2
Russell Wilson, School of Physical Sciences, UTAS = Author 3
R. Dario Arrua, Future Industries Institute, University of South Australia = Author 4
Stefan A. F. Bon, Department of Chemistry, The University of Warwick = Author 5
Emily F. Hilder, Future Industries Institute, University of South Australia = Author 6
Fotouh R. Mansour, Department of Pharmaceutical Analytical Chemistry, Tanta University = Author 7
Andrea Lotierzo, Department of Chemistry, The University of Warwick = Author 8
Author details and their roles:
Paper 1, <Monolithic High-performance Liquid Chromatography Columns> Located in chapter 1
Candidate was the primary author (50%) with author 4 (40 %). Author 6 (10%) assisted with refinement and presentation.
Paper 2, <Preparation of highly interconnected hydrophilic polymers from emulsion templates with improved mechanical properties>
Located in chapter 3 & 2
Paper 3, <Effect of shearing stress on the radial heterogeneity and
chromatographic performance of styrene-based polymerised high internal phase. emulsions prepared in capillary format>
Located in chapter 4, 1 & 2
Candidate was the primary author {60%) with author 4 (10%). Author 5, 6 and 7 (10% respectively) contributed to the idea, and its formalisation and development. Author 1 and 3 assisted with refinement and presentation.
Paper 4, <The preparation of styrene-based polymerised high internal phase emulsions functionalised with monomers from the internal phase for liquid chromatography>
Located in chapter 5, 1 & 2
Candidate was the primary author (60%) with author 4 (10%). Author 5, 6 and 7 (10% respectively) contributed to the idea, and its formalisation and development. Author 1 and 3 assisted with refinement and presentation.
Paper 5, <The preparation of polymer monoliths using latexes prepared from the soap-free emulsion polymerisation of styrene>
Located in chapter 6 & 1
Candidate was the primary author (60%} with author 5 {10%}. Author 4, 6 and 8 (10% respectively) contributed to the idea, and its formalisation and development.
We the undersigned agree with the above stated "proportion of work undertaken" for each of the above published (or submitted) peer-reviewed manuscripts
contributing to this thesis:
Signed:
Emily Hilder
School of Physical Sciences
University of Tasmania
School of Physical Sciences
University of Tasmania
Date:
O<o
IO
fbI
IT
w[{(q
vii
List of Publications and Presentations
Papers in peer-reviewed journals:
1. Desire, C.T., Arrua, R.D. & Hilder, E.F. Monolithic High-performance Liquid Chromatography Columns. Encyclopedia of Analytical Chemistry.
DOI: 10.1002/9780470027318.a9386. (Chapter 1).
2. Desire, C.T., Khodabandeh, A., Schiller, T.L., Wilson, R., Arrua, R.D., Bon, S.A.F. & Hilder, E.F. Preparation of highly interconnected hydrophilic polymers from emulsion templates with improved mechanical properties. EuropeanPolymer Journal. Accepted. (Chapter 3).
3. Desire, C.T., Arrua, R.D., Mansour, F.R., Bon, S.A.F. & Hilder, E.F. Effect of shearing stress on the radial heterogeneity and chromatographic
performance of styrene-based polymerised high internal phase emulsions prepared in capillary format. RSC. Advances. In Preparation. (Chapter 4).
4. Desire, C.T., Arrua, R.D., Mansour, F.R., Bon, S.A.F. & Hilder, E.F. The preparation of styrene-based polymerised high internal phase emulsions functionalised with monomers from the internal phase for liquid
chromatography. RSC. Advances. In Preparation. (Chapter 5).
5. Desire, C.T., Lotierzo, A., Arrua, R.D., Hilder, E.F. & Bon, S.A.F. The
preparation of polymer monoliths using latexes prepared from the soap-free emulsion polymerisation of styrene. Green Chem. In Preparation. (Chapter 6).
Conferences:
1. Desire, C.T., Lotierzo, A., Hilder, E.F. & Bon, S.A.F. Preparation of Polymer Monoliths using Crosslinked Colloidal Gels (oral presentation). RACI Centenary Congress, 23 - 28 July 2017. Melbourne. Australia.
2. Desire, C.T., Lotierzo, A., Bon, S.A.F. & Hilder, E.F. Crosslinked colloidal gels as potential analytical devices (poster presentation). ASSAS 2 – ACROSS
International Symposium on Separation Science, Nov 30 - Dec 2 2016. Hobart. Australia.
3. Desire, C.T., Khodabandeh, A., Arrua, R.D., Bon, S.A.F. & Hilder, E.F.
viii 4. Desire, C.T., Khodabandeh, A., Arrua, R.D. & Hilder, E.F. The Development of
Porous Polymers from Emulsion Templates for Separation Science (poster presentation). 23rd Annual Research and Development Conference in Analytical and Environmental Chemistry, 6 - 9 Dec 2015. University of Melbourne, Parkville, Victoria, Australia.
5. Desire, C.T., Khodabandeh, A., Arrua, R.D. & Hilder, E.F. Preparation of Porous Polymers from Emulsion Templates for Applications in Separation Science (poster presentation). 22nd Annual Research and Development Conference in Analytical and Environmental Chemistry, 13 - 15 Dec 2014. Flinders University, Adelaide, Australia.
6. Desire, C.T., Khodabandeh, A., Arrua, R.D., Bon, S.A.F. & Hilder, E.F. Preparation of Hydrophilic Porous Polymers from Reduced Internal Phase Emulsions (oral presentation). RACI National Congress, 7 - 12 Dec 2014. Adelaide, Australia.
7. Hilder, E.F., Arrua, R.D., Desire, C.T., Khodabandeh, A. & Wilson, R.
Preparation and characterisation of ordered porous polymer monoliths (oral presentation). 248th ACS National Meeting & Exposition, 10 - 14 Aug 2014. San Francisco, CA, USA.
8. Hilder, E.F., Arrua, R.D., Khodabandeh, A., Desire, C.T. & Bon, S.A.F.
Preparation and Characterization of Ordered Porous Polymer Monoliths for Chromatography (oral presentation). 41st International Symposium on High Performance Liquid Phase Separations and Related Techniques, 11 - 15 May 2014. New Orleans, Louisiana, USA.
ix
Abstract
This thesis focuses on the development of polymer monoliths from emulsions for applications in liquid chromatography, in particular the use of high internal phase emulsions to produce monoliths with controlled morphology.
An initial study focused on the preparation of hydrophilic polymer monoliths using oil-in-water emulsions. Here, the internal phase volume of the emulsion was varied to produce monoliths with improved mechanical properties under compression. A systematic study was then employed focusing on the influence of the internal phase volume, surfactant concentration and the emulsification energy on the
interconnectivity of the resulting monolith. It was found that monoliths with significantly improved mechanical properties that maintained a high level of interconnectivity could be obtained by selecting an appropriate combination of these parameters. The monoliths obtained were found to be responsive to different solvent environments, with significant changes in their volume. This suggested their applicability for use as absorbents or for controlled release but made them
unsuitable for liquid chromatography involving a solvent gradient. In addition, when prepared in capillary format, these monoliths were observed to detach from the capillary wall during purification as a result of shrinkage.
As such, the preparation of hydrophobic polymer monoliths from water-in-oil emulsions, in capillary format, for chromatographic applications was explored, as these exhibited minimal change in volume when exposed to different solvent environments. Particular attention was paid to the effect that the preparation in capillary format had on the morphology of the resulting monoliths. It was found that when these materials were prepared in capillaries of internal diameter less than 540 μm using low shear emulsification, significant alterations in their porous morphology were observed. In addition, all columns prepared possessed significant radial
x significant radial heterogeneity was observed. As a result these monoliths exhibited significantly improved chromatographic performance for the separation of a
standard mixture of proteins using reversed-phase liquid chromatography with a solvent gradient.
Given these monoliths exhibited a rigid backbone, which did not appear to be compromised by a solvent gradient, they were surface modified by simply incorporating monomers into the internal phase of the emulsion. Initial work focused on the incorporation of the hydrophilic monomer acrylamide in order to increase the hydrophilicity of the monolithic surface. The influence of the inclusion of monomer in the internal phase and choice of initiator on the resulting
morphology of these monoliths was investigated. It was found that increases in the monomer content coupled with the use of either a water-soluble or oil-soluble initiator resulted in monoliths with varied morphology and surface chemistry. The increase in hydrophilicity of this scaffold was observed through the separation of some components of a peptide mixture using hydrophilic interaction liquid chromatography, which was not possible using the unmodified scaffold. Finally, a weakly hydrophilic monomer poly(ethylene glycol) diacrylate (Mw 258) was
incorporated into the internal phase where it was observed to act as an efficient co-stabiliser resulting in an increase in the homogeneity of the column, and this
material was found to be capable of separating a more complex protein mixture by reversed phase liquid chromatography.
xii
Table of Contents
Declarations ii
Acknowledgements iii
Statement of Co-Authorship v
List of Publications and Presentations vii
Abstract ix
Table of Contents xii
List of Abbreviations xvi
Chapter 1: Literature Review 1
1.1 The Development of Monoliths for Liquid Chromatography 1
1.2 Comparison between Polymer and Silica Monoliths 3
1.3 Preparation of Polymer Monoliths 5
1.4 Convective Flow through Monolithic Columns 6
1.5 Application of Polymer Monoliths for LC 7
1.5.1 Application of Polymer Monoliths in RPLC 8
1.5.2 Application of Polymer Monoliths in HILIC 12
1.5.3 Application of Polymer Monoliths in IC 15
1.5.4 Application of Polymer Monoliths in HIC 18
1.6 Preparation of Polymer Monoliths by templated techniques for LC 19 1.6.1 Polymerisation of High Internal Phase Emulsions to form monoliths 21
1.6.2 Application of poly(HIPE)s for LC 27
1.7 Project Aims 33
1.8 References 34
Chapter 2: Experimental 41
2.1 Materials 41
2.2 Characterisation 43
2.2.1 Optical Microscopy 43
2.2.2 Dynamic Light Scattering 44
2.2.3 Scanning Electron Microscopy 44
xiii
2.2.5 Mercury Intrusion Porosimetry 45
2.2.6 Mechanical Properties 46
2.2.7 Porosity and Swelling Studies 46
2.2.8 Additional Characterisation Techniques 48
2.3 Chromatography 49
2.3.1 Capillary LC 49
2.3.2 Permeability Measurements 49
2.4 General Procedures 51
2.4.1 Surface modification of fused-silica capillaries 51
2.4.2 Purification of PEGDA 52
2.5 References 52
Chapter 3: Preparation of highly interconnected hydrophilic polymers from emulsion templates with improved mechanical properties 53
3.1 Introduction 53
3.2 Experimental 55
3.2.1 Preparation of hydrophilic porous polymers 55
3.2.2 Characterisation of Emulsions 57
3.3 Results and Discussion 57
3.3.1 Porous polymer preparation and morphology tuning 57
3.3.2 Screening the parameters which influence morphology through
experimental design 70
3.3.3 Mechanical properties of the hydrophilic porous polymers 77
3.3.4 Swelling Characteristics 84
3.4 Conclusions 87
3.5 References 88
Appendix A 90
Chapter 4: Effect of shearing stress on the radial heterogeneity and
chromatographic performance of styrene-based polymerised high internal
phase emulsions prepared in capillary format 95
4.1 Introduction 95
4.2 Experimental 96
xiv
4.3 Results and Discussion 97
4.3.1 Preparation of poly(Sty-co-DVB) poly(HIPE)s in capillary format 97
4.3.2 Chromatographic Performance 117
4.4 Conclusions 124
4.5 References 124
Appendix B 126
Chapter 5: The preparation of styrene-based polymerised high internal phase emulsions functionalised with monomers from the internal phase for liquid
chromatography 133
5.1 Introduction 133
5.2 Experimental 135
5.2.1 Preparation of poly(Sty-co-DVB) poly(HIPE)s 135
5.3 Results and Discussion 136
5.3.1 Preparation of poly(HIPE)s grafted with AAm 136
5.3.2 Preparation of poly(HIPE)s grafted with AAm in capillary format 143 5.3.3 Chromatographic performance of poly(HIPE)s grafted with AAm 150
5.3.4 Preparation of poly(HIPE)s grafted with PEGDA 153
5.3.5 Chromatographic performance of poly(HIPE)s grafted with PEGDA 160
5.3.6 Application of poly(HIPE)s grafted with AAm for HILIC 161
5.4 Conclusions 165
5.5 References 166
Appendix C 168
Chapter 6: Preparation of polymer monoliths from colloidal gels formed using latexes prepared from the soap-free emulsion polymerisation of styrene 171
6.1 Introduction 171
6.2 Experimental 174
6.2.1 Synthesis of the cationic co-monomer 174
6.2.2 General procedure for the soap-free emulsion polymerisation of
styrene 175
6.2.3 General procedure for the preparation of colloidal gels 175
6.2.4 Preparation of cross-linked colloidal gels 176
xv
6.3 Results and Discussion 177
6.3.1 The preparation of oppositely charged latexes 177
6.3.2 Formation of colloidal gels 179
6.3.3 Formation of cross-linked colloidal gels 182
6.3.4 Formation of porous materials using a single latex 184
6.3.5 Preparation of cross-linked colloidal gels with different shapes 191
6.3.6 Solvent Behaviour 193
6.4 Conclusions 195
6.5 References 196
Appendix D 199
Chapter 7: General Conclusions and Future Directions 208
xvi
List of Abbreviations
AA Acrylic acid
AAm Acrylamide
ACN Acetonitrile
AIBN 2,2ʹ-azobis(2-methylpropionitrile)
AMPS 2-acrylamido-2-methyl-1-propanesulfonic acid
APS Ammonium persulfate
BET Brunauer-Emmett-Teller
BuMA Butyl methacrylate
CEC Capillary Electrochromatography
CHDF Capillary Hydrodynamic Fractionation
COC Cycloolefin copolymer
CIM Convective Interactive Media
DEA Diethylamine
DEAE Diethylaminoethyl
DEGDA Di(ethylene glycol) diacrylate
DLS Dynamic Light Scattering
DMSO Dimethyl sulfoxide
DVB Divinylbenzene
EDMA Ethylene dimethacrylate
EHA 2-ethylhexyl acrylate
EHMA 2-ethylhexyl methacrylate
EtOH Ethanol
GMA Glycidyl methacrylate
HEMA 2-hydroxyethyl methacrylate
HIC Hydrophobic Interaction Chromatography
HILIC Hydrophilic Interaction Liquid Chromatography
HIPE High Internal Phase Emulsion
HLB Hydrophilic-Lipophilic Balance
xvii
IC Ion Chromatography
IEX Ion-Exchange Chromatography
IP Internal Phase
IUPAC International Union of Pure and Applied Chemistry
KPS Potassium persulfate
LC Liquid Chromatography
LIPE Low Internal Phase Emulsion
MBAm N,N'-methylenebisacrylamide
MIP Mercury Intrusion Porosimetry
MIPE Medium Internal Phase Emulsion
MMA Methacrylic acid
MS Mass Spectrometry
NIPAM N-isopropyl acrylamide
NMR Nuclear magnetic resonance
o.d. outer diameter
PEEK Polyether ether ketone
PEG Poly(ethylene glycol)
PEGDA Poly(ethylene glycol) diacrylate
PLGA Poly(D,L-lactic-co-glycolic acid)
RAFT Reversible Addition-Fragmentation Chain Transfer
RPLC Reversed-Phase Liquid Chromatography
SEM Scanning Electron Microscopy
Sty Styrene
TEMED N,N,Nʹ,Nʹ-tetramethylethylenediamine
TEVBAC Triethyl(4-vinylbenzyl)ammonium chloride
TLC Thin-layer chromatography
TMVBAC Trimethyl(vinylbenzyl)ammonium chloride
for
copyright or proprietary
reasons.
It has been published as:
Desire, C. T., Arrua, R. D., Hilder, E. F. Monolithic
41
Chapter 2
Experimental
This section briefly summarises the materials, instrumentation and general procedures used throughout this research, unless specified otherwise in specific chapters.
2.1
Materials
Unless otherwise specified the chemicals listed in Tables 2.1 - 2.6 were used as received. The H2O used in all experiments was first purified using a Milli-Q system
[image:19.595.78.511.439.711.2](18 MΩ cm, Millipore, USA).
Table 2.1 Chemicals used for the preparation and/or characterisation of the emulsion templated porous polymers
Chemical Purity/Conc Supplier
Acetone AR grade Chem-Supply
Acrylamide (AAm) ≥98.0% Fluka
2,2ʹ-azobis(2-methylpropionitrile) (AIBN) a MP Biomedicals Basic alumina (Brockman activity I, 60-325 mesh) Sigma-Aldrich Ammonium persulfate (APS)
≥98.0% Ajax Chemicals Calcium chloride dihydrate ≥98.0% Ajax Chemicals
Dichloromethane >99% Unilab
Divinylbenzene (DVB) b 80% Sigma-Aldrich
Methanol (MeOH) AR grade Chem-Supply
N,N'-methylenebisacrylamide (MBAm) ≥99.5% Sigma-Aldrich
Paraffin-oil Puriss Sigma-Aldrich
PEG diacrylate (PEGDA, Mn 258) c Sigma-Aldrich
Potassium persulfate (KPS) d ≥99.0% Sigma-Aldrich Sodium carbonate (anhydrous) ≥99.9% Merck Sodium sulfate (anhydrous) ≥99.0% Sigma-Aldrich
Span® 80 ≥60% Fluka
Styrene (Sty) b 99% Sigma-Aldrich
Tween® 85 ≥50% aqueous solution Sigma-Aldrich a Was re-crystalised from MeOH. b Were passed through a column of basic alumina to remove inhibitors. c Was purified according to the procedure in Section2.4.2. d Was re-crystalised from H2O.
42 Table 2.2 Chemicals used for the surface modification of fused-silica capillaries
Chemical Purity/Conc Supplier
Acetone AR grade Chem-Supply
Acetic acid ≥99.7% Sigma-Aldrich
Ethanol (EtOH) >99% Chem-Supply
Hydrochloric acid (HCl) 37% aqueous solution Merck
Sodium hydroxide (NaOH) ≥98.0% Sigma-Aldrich
3-(trimethoxysilyl)propyl methacrylate ≥98% Sigma-Aldrich
Table 2.3 Chemicals used for the preparation of mobile phases for LC
Chemical Purity Supplier
Acetonitrile (ACN) ≥99.8% VWR
Formic acid ≥98.0% Fluka
Methanol (MeOH) 99.9% Fisher Scientific
Table 2.4 Analytes used for LC
Chemical Purity Supplier
Albumin from chicken egg white (ovalbumin) (≥98%) Sigma-Aldrich α-chymotrypsinogen A from bovine pancreas Sigma-Aldrich
Cytidine ≥99% Fluka
Cytochrome c from equine heart ≥95% Sigma-Aldrich
Guanosine ≥99% Fluka
HPLC peptide standard mixture (consisting of angiotensin II,
Gly-Tyr, Leu encephalin, Met encephalin and Val-Tyr-Val) Sigma-Aldrich Lysozyme from chicken egg white ≥90% Sigma-Aldrich Myoglobin from horse heart ≥90% Sigma-Aldrich Ribonuclease A, type I-A, from bovine pancreas ≥60% Sigma-Aldrich
Thiourea ≥99.0% Ajax Chemicals
Table 2.5 Chemicals used for the preparation and/or characterisation of cross-linked colloidal gels
Chemical Purity Supplier
Acetone ≥99% Sigma-Aldrich
Ammonium persulfate (APS) 98% Sigma-Aldrich
2,2-azobis(2-methylpropanimidamide) dihydrochloride (V-50) 98% Acros Organics 2,2ʹ-azobis(2-methylpropionitrile) (AIBN) a BDH
Di(ethylene glycol) diacrylate (DEGDA) 75% Sigma-Aldrich
Dimethyl sulfoxide-d6 (DMSO) Sigma-Aldrich
Divinylbenzene (DVB) 80% Sigma-Aldrich
Methanol (MeOH) AR grade VWR
Styrene (Sty) ≥99% Sigma-Aldrich
4-styrenesulfonic acid sodium salt Sigma-Aldrich
Triethylamine ≥99% Sigma-Aldrich
N,N,Nʹ,Nʹ-tetramethylethylenediamine (TEMED) ≥99% Sigma-Aldrich
4-vinylbenzyl chloride 90% Sigma-Aldrich
43 Table 2.6 Chemicals used for the characterisation of cross-linked colloidal gels
Chemical Purity Supplier
Acetonitrile (ACN) ≥99.8% VWR
Ethanol (EtOH) >99% Chem-Supply
Hexadecane ≥98.5% Acros Organics
Methanol (MeOH) AR grade VWR
Sunflower oil Woolworths Essentials
Polyimide-coated capillaries of 150 μm i.d. (360 μm o.d.), 250 μm i.d. (360 μm o.d.) and 540 μm i.d. (670 μm o.d.) were obtained from Polymicro Technologies.
2.2
Characterisation
2.2.1 Optical Microscopy
44 2.2.2 Dynamic Light Scattering
Dynamic light scattering (DLS) was attempted for the emulsions prepared in Chapter 3 on a Malvern Nano-ZS (ATA Scientific Pty. Ltd, NSW, Australia) with diluted
emulsion in order to estimate the droplet size. The particle size and particle size distributions for the latexes prepared in Chapter 6 were also measured by DLS using a Malvern Instruments Zetasizer (Nano-ZS) instrument using dilute latex samples. Zeta potentials were also measured using this instrument with dilute latex samples.
2.2.3 Scanning Electron Microscopy
The polymer morphologies for the samples prepared in Chapters 3, 4 & 5 were investigated using a Hitachi SU-70 field emission scanning electron microscope (Hitachi, Pleasanton, CA, USA) operated in high vacuum mode with an acceleration voltage of 1.5 kV. Secondary electrons were detected using a Hitachi scintillator-type detector. The samples were platinum coated (2-3 nm thick coating) using a Bal-Tec SCD 050 Sputter Coater (Bal-Tec AG, Balzers, Liechtenstein). The average void and window sizes were obtained (where applicable) using ImageJ, where the diameter of at least 300 voids and windows were measured.
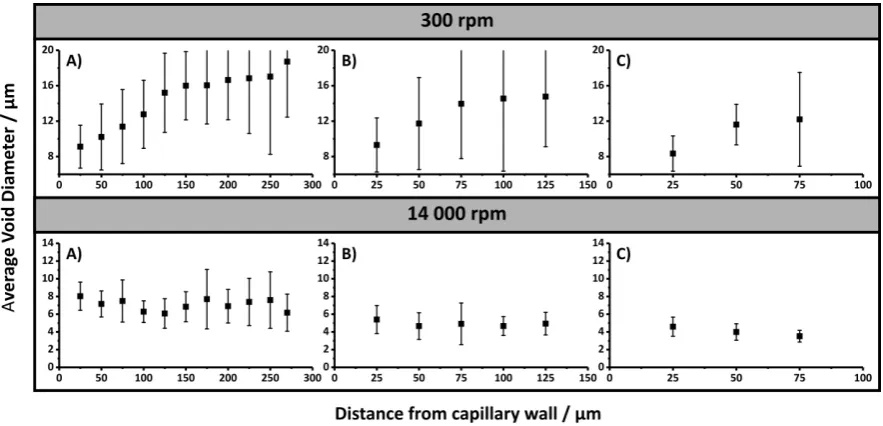
45 annulus formed from concentric circles, which differed in diameter by 25 μm for Chapter 4 and 15 μm for Chapter 5, originating from the capillary wall.
SEM micrographs were obtained for the materials prepared in Chapter 6 using a Zeiss Supra™ 55VP field emission scanning electron microscope (Carl Zeiss AG, Oberkochen, Germany), with secondary electron detection, operating in high
vacuum mode with an acceleration voltage of 15 kV. Samples were first dispersed in H2O and evaporated onto silicon wafers attached to aluminium stubs, before being
sputter-coated with carbon using an Emitech K950X sputter-coater (Quorum Technologies, Kent, United Kingdom) or gold coated using a Polaron Range sputter coater (Quorum Technologies, Kent, United Kingdom). The average pore size for some of these materials was estimated by measuring the diameter of 500 pores. Histograms were obtained from these data sets using 22 bins, where the bin width was calculated by dividing the range of values by the number of bins. Theoretical normal distributions were also obtained based on the mean and standard deviation over a range of ± 3 standard deviations using 200 points.
2.2.4 Surface Area Analysis
The specific surface area of the materials prepared in Chapters 3-6 was determined by nitrogen adsorption with the Brunauer-Emmett-Teller (BET) method [4] using a Micromeritics Tristar II 2020 automated gas sorption–desorption instrument (Micromeritics, Norcross, GA, USA). Prior to analysis, all samples were dried in a Micromeritics SmartPrep at 80 °C for 48 h. This was performed in triplicate with 100-200 mg of sample.
2.2.5 Mercury Intrusion Porosimetry
46 value of 33, 000 psi. This was also performed in triplicate. Between 100 and 200 mg of sample was used each time depending on the stem volumes obtained (more sample was required for the less porous materials). The pore size distributions obtained were redrawn using Origin® 8.5 (OriginLab Corporation, Northampton, MA, USA).
2.2.6 Mechanical Properties
An Instron 5500R Advanced Materials Testing System (Instron, Norwood, MA, USA) was used to measure the mechanical properties under compression for selected polymer disks prepared in Chapter 3. The samples were compressed at a rate of 5 mm/min. At least five cylindrical disks of ~11.5 mm in diameter and ~16 mm in height were analysed for each sample. The average Young’s modulus was
determined from the slope of the initial elastic region (strain values of 0 to 0.02) of the compressive stress-strain curves obtained. The crush strength was also
calculated, which was defined as the maximum stress at the end of the initial elastic region [5]. The stress-strain curves were plotted using Origin® 8.5 and were shifted so each curve started at the origin. Depending on the maximum load, either a 1 kN or 5 kN load cell was used. All sample ends were sanded to ensure they were tangential and allow maximum contact with the testing plates to ensure repeatability of the results when possible. All tests were conducted at room temperature.
2.2.7 Porosity and Swelling Studies
Dry polymer disks prepared in Chapters 3-5 were immersed in three different solvents; Milli-Q H2O, acetone and MeOH. At least four disks for each sample were
used for each solvent. Their mass and dimensions (diameter and height) were recorded prior to immersion in these solvents. When Milli-Q H2O was utilised as the
47 For acetone and MeOH (and H2O for the disks in Chapters 4 & 5) a method adapted
from Greig and Sherrington [6] was employed where these disks were placed in centrifuge tubes with the respective solvent for 1 h before being centrifuged at ~2600 rpm for 15 min. Their mass was re-measured and the disks were re-immersed in the solvent for 5 min before being centrifuged for a further 15 min at ~2600 rpm, after which their mass was again determined. This process was repeated until a constant mass was achieved and the dimensions of the polymer disks were re-measured. Centrifugation was employed to force the solvent into the pores of the porous polymer.
The polymer disks prepared in Chapter 6 were immersed in a variety of solvents including; Milli-Q H2O, MeOH, EtOH, ACN, hexadecane and sunflower oil. At least
three disks for each sample were immersed in each solvent for 24 h and their mass and dimensions were recorded both prior and after immersion. At least one of the disks for each sample was immersed in the solvents for only 30 min.
The dry state porosity (φd) is defined as the total pore volume (Vpd) of the dry disk
divided by the total volume of the dry polymer disk (Vd) (Equation 1).
ϕd= VVpd
d (Equation 1)
When immersed in a solvent that enters the pores, the pore volume (Vpw) of the wet
disk is equivalent to the change in the mass of the polymer disk (Δm) divided by the density of the solvent (ρ) (Equation 2).
Vpw= ∆mρ (Equation 2)
As well as entering the pores, the solvent may also swell the polymer changing the total volume of the polymer disk and this new volume is denoted as Vw. The wet
48
ϕw= ΔVm/ρ
w (Equation 3)
For the disks prepared in Chapter 3 the swelling in acetone was negligible so Vw≅ Vd,
which implies that Vpw≅ Vpd. The porosity measurements for this solvent were
therefore a good approximation for the porosity of these dry polymer disks (φd). For
the disks prepared in Chapters 4 & 5 the swelling in MeOH and acetone was negligible, while for the disks prepared in Chapter 6 the swelling or shrinkage in all solvents, except ACN, was negligible.
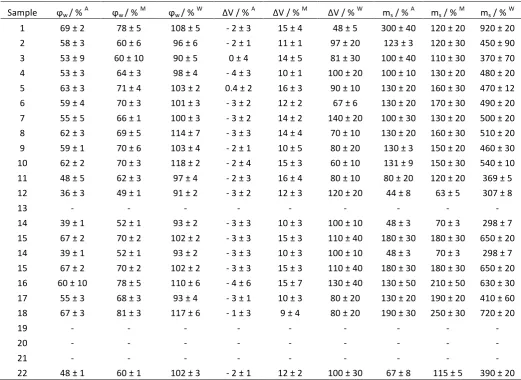
As well as the porosity, the change in volume (ΔV) as a result of any swelling in the different solvents was calculated as a percentage relative to the original disk volume (Vd). The mass of solvent taken up by the pores (ms) was also calculated and
represented as a percentage relative to the original mass of the disk. The densities used for acetone, ACN, EtOH, hexadecane, MeOH, Milli-Q H2O and sunflower oil at
25 °C were 0.791, 0.786, 0.789, 0.773, 0.792, 1.00 and 0.914 g/mL, respectively.
2.2.8 Additional Characterisation Techniques
The nitrogen and sulfur content for selected poly(HIPE)s was determined with a Thermo Finnigan EA 1112 Series Flash Elemental Analyser, while FTIR spectra were recorded using a Bruker Vertex 70 infrared spectrometer equipped with an ATR probe. Nuclear magnetic resonance (NMR) spectra were recorded in DMSO-d6 on a
Bruker Advance III HD operating at 300 MHz at room temperature. NMR and FTIR spectra were exported and redrawn using Origin® 8.5.
49
2.3
Chromatography
2.3.1 Capillary LC
Chromatographic separations were performed using a Dionex UltiMate™ 3000 RSLCnano system equipped with a NCS-3500RS capillary LC gradient pump including a membrane degasser unit and integrated column compartment, a VWD-3400RS UV detector equipped with a 45 nL flow cell and a WPS-3000TPLC RS autosampler fitted with a 1 μL sample loop. Chromeleon® software (Ver. 6.80) was used for system control and data processing (data collection rate was 2.5 Hz). Chromatograms were converted to ASCII files and redrawn using Origin® 8.5. The LC experiments were conducted under gradient conditions and 1 μL injections were performed with the aid of an autosampler. UV detection was employed at both 214 and 280 nm. For all chromatograms the baseline drift caused by the gradient was subtracted.
Comparisons were made to the original chromatograms to ensure that structures observed were not artefacts of the subtraction process.
For the RPLC separations eluent A consisted of 0.1 vol% formic acid in H2O and
eluent B consisted of 0.1 vol% formic acid in ACN and these were degassed prior to use. Samples were dissolved in and diluted with H2O to the appropriate
concentrations. For the HILIC separations eluent A was ACN and eluent B was Milli-Q H2O and these were also degassed prior to use. Here, samples were dissolved in and
diluted with ACN to the appropriate concentrations.
2.3.2 Permeability Measurements
Permeability measurements were performed for columns of various lengths by recording the column back pressure at various flow rates ranging between 0.5 and 9 μL/min in both MeOH and H2O at 25°C. Before being recorded the pressure was
50 Starting with Darcy’s law which states,
!!,! = !
∆!!!!" (Equation 4)
where ΔP is the pressure drop, L is the length of the column, kp,f is the permeability
of the monolithic column, η is the mobile phase viscosity and μ sf is the superficial
velocity. The superficial velocity is assumed in this derivation to have the same value as for a generic “empty” tube. This can therefore be rearranged to,
Δ!= !
!!,!!"!" (Equation 4a)
The superficial velocity is related to the volumetric flow rate (Fν) by the inverse of
the cross-sectional area (A) of the capillary, so the equation becomes,
Δ!= !!"
!,!!!! (Equation 4b)
In terms of units, if ΔP is expressed in MPa, the column length in m, the viscosity in MPa·s, the volumetric flow rate in m3/s and the cross-section area in m2 then the
permeability will be in m2. In order for the volumetric flow rate to be used in units of μL/min the following conversion can be utilised,
F! !"
!"# = 1.67×10
!!! ! !(!
!
! )
Equation 4b can therefore be re-written as,
Δ!= !.!" × !!"!!!!"
!,!! !! (Equation 4c)
51
m= !.!" × !!"!!!!"
!,!!
Thus allowing the permeability to be calculated as follows,
!!,! =!.!" × !"!!!!"
!" (Equation 5)
The pressure values measured actually contain contributions from the back pressure of the system [12], so this was corrected for by subtracting the slope obtained from a plot of back pressure against flow rate, over the same range of flow rates, in the absence of the column from m. The resulting value was then used to calculate the permeability. Viscosities of 0.544 mPa.s and 0.890 mPa.s for MeOH and H
2O at 25°C,
respectively, were used in the calculations [11], and this was performed for at least three columns prepared from the same batch.
2.4
General Procedures
2.4.1 Surface modification of fused-silica capillaries
The polyimide-coated capillaries were surface modified based on a procedure by Rohr et al. [13]. Briefly, capillaries were rinsed with acetone and H2O, activated by
pumping a solution of 0.2 M NaOH through the capillaries using a syringe pump at a rate of 30 μL/h for 30 min. The capillaries were then rinsed with H2O, before 0.2 M
HCl was pumped through them at the same rate for 30 min. After which these were rinsed with H2O and then EtOH at pH 5 (adjusted using acetic acid). A 20 wt%
52 2.4.2 Purification of PEGDA
PEGDA was purified according to the procedure by Liu et al. [14] to remove
impurities and inhibitor. Briefly, 25 mL of monomer and 15 mL of aqueous saturated sodium carbonate solution were added to a 100 mL separating funnel and shaken vigorously. The funnel was then placed on a ring stand and phase separation was allowed to occur before the lower layer (the carbonate solution) was removed. This washing procedure was repeated twice more, followed by rinsing with 3 × 25 mL of Milli-Q H2O to remove residual carbonate solution (the organic layer was the lower
layer this time). The monomer was then extracted from the remaining aqueous layer (the upper layer) using 3 × 25 mL aliquots of dichloromethane. The extracts were then combined and dried with anhydrous sodium sulfate. This was filtered through Whatman cellulose-based filter paper (Maidstone, Kent, UK) before the
dichloromethane was removed under reduced pressure.
2.5
References
[1] Carnachan, R. J.; Bokhari, M.; Przyborski, S. A.; Cameron, N. R. Soft Matter. 2006, 2, 608-616.
[2] Barbetta, A.; Cameron, N. R. Macromolecules. 2004, 37, 3188-3201.
[3] Kimmins, S. D.; Wyman, P.; Cameron, N. R. Reactive and Functional Polymers. 2012, 72, 947-954.
[4] Brunauer, S.; Emmett, P. H.; Teller, E. J. Am. Chem. Soc. 1938, 60, 309-319. [5] Menner, A.; Haibach, K.; Powell, R.; Bismarck, A. Polymer. 2006, 47, 7628-7635. [6] Greig, J. A.; Sherrington, D. C. Polymer. 1978, 19, 163-172.
[7] Sheldrick, G. M. Acta Cryst. 2008, A64, 112-122.
[8] Dolomanov, O. V.; Bourhis, L. J.; Gildea, R. J.; Howard, J. A. K.; Puschmann, H. J. Appl. Cryst. 2009, 42, 339-341.
[9] Sheldrick, G. M. Acta Cryst. 2015, C71, 3-8.
[10] Nischang, I.; Svec, F.; Fréchet, J. M. J. Chromatogr. A. 2009, 1216, 2355-2361. [11] Li, Y.; Tolley, H. D.; Lee, M. L. J. Chromatogr. A. 2010, 1217, 4934-4945.
[12] Geiser, L.; Eeltink, S.; Svec, F.; Fréchet, J. M. J. Chromatogr. A. 2007, 1140, 140-146.
[13] Rohr, T.; Hilder, E. F.; Donovan, J. J.; Svec, F.; Fréchet, J. M. J. Macromolecules. 2003, 36, 1677-1684.
53
Chapter 3
Preparation of highly interconnected hydrophilic polymers from
emulsion templates with improved mechanical properties
3.1 Introduction
The preparation of poly(HIPE)s for LC has so far been limited to those materials prepared from water-in-oil emulsions, which limits the hydrophilicity of the resulting materials. This therefore reduces the applicability of these poly(HIPE)s for different chromatographic modes, without further modification. Hydrophilic polymer monoliths have been found to be suitable for separations using HILIC [1], which is not possible with a hydrophobic surface. For example, acrylamide (AAm)-based monoliths have been applied as stationary phases for HILIC for the separation of pyrimidines and purines [2], and for peptides [3].
Hydrophilic poly(HIPE)s can be prepared from oil-in-water emulsions, however difficulties associated with stabilising these systems [4] and the removal of the oil phase [5], which can be problematic, has been attributed to the limited nature of these reports. However stable systems have been reported in the literature, for example Hua et al. [6] prepared (paraffin-oil)-in-water HIPEs stabilised by Tween® 85 with and without titanium dioxide nanoparticles, which resulted in open cellular poly(HIPE)s upon curing with AAm and N,N '-methylenebisacrylamide (MBAm) in the continuous phase. These hydrophilic porous polymers are not only potentially useful as chromatographic stationary phases but can also find applications as tissue engineering scaffolds [7], for cell culture [8], controlled release devices [9-10] and as absorbents [5, 11].
54 chromatographic applications [19]. While poly(HIPE)s prepared from water-in-oil
emulsions have so far exhibited rigid behavior when applied in LC under reasonable pressures [20-21], this could be an issue for their hydrophilic counterparts prepared from oil-in-water emulsions, or if higher operating pressures are required. As such it is desirable to investigate strategies that can improve the mechanical properties of these systems.
Strategies do exist to improve the mechanical properties of poly(HIPE)s, including reinforcement with inorganic particles [14, 22-23] and the utilisation of alternative monomers to influence the physical and mechanical properties of the continuous
copolymer phase [12, 18, 24-25]. The simplest approach is to increase the polymer foam density [18, 26-28], which can be achieved by reducing the internal phase volume of the emulsion.
Lissant [29] defines medium internal phase emulsions (MIPEs) as emulsions with internal phases between 30 and 70 vol% and low internal phase emulsions (LIPEs) as having an internal phase less than 30 vol%, with those above 70 vol% being (HIPEs). The
polymerisation of such emulsions has been shown to lead to an increase in the mechanical properties [16, 18, 22, 26-27, 30]. For example, Luo et al. [30] prepared poly(Sty-co-DVB) based poly(MIPE)s using a miniemulsion template where internal phases of 60, 50 and 40 vol% were employed. Under compression, the resulting materials had elastic moduli of 160 ± 10, 300 ± 10 and 410 ± 10 MPa respectively. Increases in elastic moduli were also previously observed by Williams and Wrobleski [31] for poly(Sty-co-DVB) foams when the polymer foam density was increased from 0.025 g/cm3 to 0.200 g/cm3, with values of 6 MPa and 186 MPa, respectively.
55 same the total area increases as well as the total number of emulsion droplets, when sonication was utilised, which increased the likelihood for window formation and hence promoted improved interconnectivity.
Published work to date involving a reduction in internal phase has so far been limited to hydrophobic-based systems prepared from water-in-oil emulsions. It is therefore desirable to explore the possibility to obtain highly interconnected hydrophilic polymers with
improved mechanical properties from oil-in-water emulsions using this approach. In this chapter, the possibility of preparing hydrophilic porous polymers from (paraffin-oil)-in-water emulsions with improved mechanical properties was investigated by reducing the internal phase volume. The emulsification energy was varied to establish the influence this had over the materials open cellular network. The impact of the internal phase volume and surfactant level on the materials morphology was also investigated. Additionally, the behaviour of these materials in different solvent environments was explored, as well as their preparation in capillary format with the intention to apply these materials for capillary LC.
3.2 Experimental
3.2.1 Preparation of hydrophilic porous polymers
The preparation of hydrophilic porous polymers was based on a modified procedure from Hua et al. [6]. The monomer AAm (82 wt% w.r.t. total monomers), the cross-linker MBAm (18 wt% w.r.t. total monomers) and the surfactant Tween® 85 were dissolved with stirring in Milli-Q H2O. Once dissolved the initiator Ammonium persulfate (APS) (2.31 wt% w.r.t.
total monomers) was also added. The internal paraffin-oil phase was added dropwise at a rate of approximately one drop per second with gentle stirring on a magnetic stirrer. Emulsions were then obtained by emulsification either with the Ultra Turrax T 25
56 Ultrasonics Corporation, Danbury, Connecticut, USA). When the digital sonifier® was used the beaker was immersed in an ice bath to avoid significant increases in temperature during the sonication process, which would increase the rate of polymerisation.
Once the emulsions were obtained the majority was transferred to a 25 mL glass vial, while some was transferred to a 4 mL glass vial. These vials were sealed and the 25 mL sample vial was placed in a water bath at 50 °C and polymerised for 24 h, while the 4 mL sample vial was left at room temperature to evaluate the emulsion’s stability over time. This sample is referred to as the stability sample. The polymerised sample from the water bath was removed from the vial, cut into smaller pieces and washed with acetone using a Soxhlet apparatus for 48 h to remove the internal paraffin-oil phase as well as any
additional impurities. The porous polymers were then left to dry at 25 °C in a vacuum oven for one week.
The total monomer concentration in the continuous water phase was fixed at 43 wt% (w.r.t. continuous phase), while the total volume of both the internal phase and
continuous phase was fixed at 20 mL for all experiments. The differences in the samples lies in the internal phase volumes used, surfactant level and the emulsification energy (see
Tables 3.1 &3.5 for a detailed composition of the emulsion templates utilised in this
work).
Polymer disks for compression tests were obtained by first preparing the emulsion as described above, however 10 mL disposable syringes (~1.5 cm in diameter) were filled with this mixture. These syringes were sealed and placed in the water bath at 50 °C at an angle of ~45° from the horizontal (to ensure any air bubbles migrated to the top of the syringe) and polymerised for 24 h. Once cured, the polymer was removed from the syringe and cut into 2 cm thick pieces. These were first washed in vials of MeOH at room temperature with an orbital shaker for 24 h, then with MeOH using a Soxhlet apparatus for 24 h and finally with acetone with the Soxhlet apparatus for 24 h. This modified
57 Polymer disks for porosity determination and swelling studies were also prepared using 10 mL disposable syringes with the exception that the disks were cut into ~0.5 cm thick pieces.
For the preparation in capillary format, the emulsions were passed through 20 cm of 150 μm i.d. surface-modified fused silica capillaries. These were filled multiple times to limit the number of air bubbles or voids present and the ends were sealed with rubber, before being placed horizontally in the water bath. Vertical placement was avoided as this has been observed to result in column heterogeneity due to the influence of gravity for conventional polymer monoliths [32].
3.2.2 Characterisation of Emulsions
Optical microscopy images were obtained immediately after preparation and 24 h later using the stability samples. Unfortunately, the resolution of the optical microscope was insufficient to observe the droplet size distributions of the sonicated emulsions. Dynamic light scattering was attempted for these samples with diluted emulsion to estimate the droplet size, however significant creaming resulted in unreliable results. Digital
photographs were also obtained of the stability samples immediately after preparation and 24 h later.
3.3 Results and Discussion
3.3.1 Porous polymer preparation and morphology tuning
A series of porous hydrophilic polymers were prepared using an internal phase of 60 vol%. In order to investigate the structural pore morphology obtained from the emulsion
58
Table 3.1 Composition of emulsion templates for samples 1-14
a The percentage of internal phase (IP) utilised with respect to the total volume of oil and water. b Percentage of Tween® 85
solution with respect to the continuous water phase. H Emulsification with the homogeniser, the homogenisation time is
provided. U Emulsification with the digital sonifier®, the amplitude (amp) and sonication time is provided.
Table 3.2 Morphological features of the porous polymers for samples 1-7
a Average void diameter as determined from SEM. b Average droplet diameter immediately after preparation as
determined from optical microscopy. c Average droplet diameter 24 h after preparation as determined from optical microscopy. d Average window diameter as determined from SEM. e Average specific surface area as determined from the Brunauer-Emmett-Teller (BET) method. f Average dry state porosity as determined by immersion in acetone. H
Emulsification with the homogeniser, the homogenisation time is provided. U Emulsification with the digital sonifier®, the amplitude (amp) and sonication time is provided.
Fabrication of porous monoliths with lower dispersed volume fractions is typically associated with a reduction in the interconnectivity of the material, which has an impact on their open cellular nature. Open cellular poly(HIPE) and poly(MIPE) materials possess interconnectivity due to the presence of interconnecting pores or windows in their structure [33], the formation of which is suggested to occur due to volume contraction of the thin film between adjacent droplets at the gel point [34], or from the removal of a surfactant rich phase from these thin films during the washing and drying process [15]. Regardless of the mechanism, the distance between the internal phase droplets is extremely important for the formation of windows, with increases in droplet contact reported to promote greater window formation [30]. This occurs because the continuous
Oil Phase / mL Aqueous Phase / g
No. Paraffin-oil IP a AAm MBAm Tween® 85 H2O APS Emulsification
1 16 80% 1.42 0.309 0.2 [5 wt%]b 4 0.04 [14 000 rpm, 2 minH]
2 12 60% 2.84 0.618 0.4 [5 wt%]b 8 0.08 [10 000 rpm, 2 minH]
3 12 60% 2.84 0.618 0.4 [5 wt%]b 8 0.08 [14 000 rpm, 2 minH]
4 12 60% 2.84 0.618 0.4 [5 wt%]b 8 0.08 [18 000 rpm, 2 minH]
5 12 60% 2.84 0.618 0.4 [5 wt%]b 8 0.08 [30% amp, 5 minU]
6 12 60% 2.84 0.618 0.4 [5 wt%]b 8 0.08 [30% amp, 10 minU]
7 12 60% 2.84 0.618 0.4 [5 wt%]b 8 0.08 [50% amp, 5 minU]
8 12 60% 2.84 0.618 0.8 [10 wt%]b 8 0.08 [30% amp, 5 minU]
9 12 60% 2.84 0.618 1.2 [15 wt%]b 8 0.08 [30% amp, 5 minU]
10 12 60% 2.84 0.618 1.6 [20 wt%]b 8 0.08 [30% amp, 5 minU]
11 10 50% 3.55 0.7725 0.5 [5 wt%]b 10 0.1 [30% amp, 5 minU]
12 8 40% 4.26 0.927 0.6 [5 wt%]b 12 0.12 [30% amp, 5 minU]
13 4 20% 5.68 1.236 0.8 [5 wt%]b 16 0.16 [30% amp, 5 minU]
14 4 20% 5.68 1.236 3.2 [20 wt%]b 16 0.16 [30% amp, 5 minU]
Sample V / μm a D1 / μm b D2 / μm c W / μm d BET / m2g-1e ϕd / % f Preparation
1 5 ± 2 6 ± 3 6 ± 2 1.0 ± 0.5 2.2 ± 0.3 69 ± 2 [80% IP, 14 000 rpm, 2 minH, 5 wt%]
2 15 ± 5 13 ± 6 13 ± 7 2 ± 1 1.2 ± 0.1 58 ± 3 [60% IP, 10 000 rpm, 2 minH, 5 wt%]
3 8 ± 3 7 ± 3 9 ± 4 1.0 ± 0.7 1.0 ± 0.2 53 ± 9 [60% IP, 14 000 rpm, 2 minH, 5 wt%]
4 6 ± 2 6 ± 3 6 ± 3 0.8 ± 0.5 1.3 ± 0.2 53 ± 3 [60% IP, 18 000 rpm, 2 minH, 5 wt%]
5 0.7 ± 0.4 - - 0.2 ± 0.1 7.5 ± 0.4 63 ± 3 [60% IP, 30% amp, 5 minU, 5 wt%]
6 0.5 ± 0.3 - - 0.1 ± 0.1 8.5 ± 0.1 59 ± 4 [60% IP, 30% amp, 10 minU, 5 wt%]
59 phase film becomes thinner at the point of contact as the distance between adjacent droplets decreases. This can be achieved by increasing the emulsification energy, which results in a larger number of smaller droplets, and hence increased droplet contact.
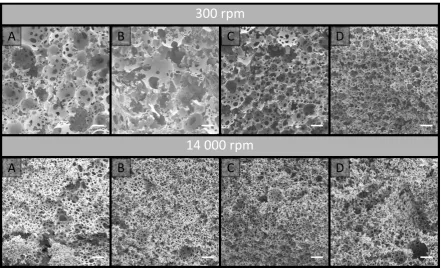
For samples 2-5 (Figure 3.1 and Table 3.2) increases in the emulsification energy
corresponded to a decrease in the average droplet and subsequent void size. For example, when the emulsion was prepared with the homogeniser at 10 000 rpm for 2 min (sample 2) the average void size obtained was 15 ± 5 μm, however this was reduced to 6 ± 2 μm when the emulsion was prepared with the homogeniser at 18 000 rpm for 2 min (sample 4). This was further reduced to 0.7 ± 0.4 μm when the digital sonifier® was utilised at 30% amplitude for 5 min (sample 5). Interestingly, the average window sizes were comparable, around 1 μm, for samples 2-4 and were only significantly reduced for sample 5, which had an average window size of 0.2 ± 0.1 μm. The surface areas obtained were consistent with the observed void and window sizes with samples 2-4 possessing similar surface areas of ~ 1 m2/g, while sample 5, which possessed considerably smaller voids and windows,
possessed a significantly larger surface area of 7.5 ± 0.4 m2/g.
60
Table 3.3 Interconnectivity of the porous polymers for samples 1-7
Sample Nw a [W/V] b [WA/VSA] c Nw × [WA/VSA] d Preparation
1 4 0.19 0.0090 0.036 [80% IP, 14 000 rpm, 2 minH, 5 wt%]
2 4 0.13 0.0042 0.017 [60% IP, 10 000 rpm, 2 minH, 5 wt%]
3 4 0.13 0.0039 0.016 [60% IP, 14 000 rpm, 2 minH, 5 wt%]
4 5 0.12 0.0035 0.018 [60% IP, 18 000 rpm, 2 minH, 5 wt%]
5 2 0.25 0.016 0.032 [60% IP, 30% amp, 5 minU, 5 wt%]
6 2 0.28 0.020 0.040 [60% IP, 30% amp, 10 minU, 5 wt%]
7 2 0.25 0.015 0.030 [60% IP, 50% amp, 5 minU, 5 wt%]
a Average number of windows per void as determined from SEM. b Average degree of interconnectivity calculated by
dividing the average window diameter by the average void diameter. c Average degree of interconnectivity calculated by dividing the average area of the windows by the average surface area of the voids (both calculated using the average window and void diameters, respectively, as determined from SEM). d The product of the average number of windows per void by the average degree of interconnectivity (relative to the surface area of the voids). Otherwise known as the openness [4]. H Emulsification with the homogeniser, the homogenisation time is provided. U Emulsification with the digital sonifier®, the amplitude (amp) and sonication time is provided.
For the homogenised samples (samples 2-4) the observed decrease in void size appeared to result in an increase in the average number of windows present per void, from 4 for samples 2 & 3 to 5 for sample 4 (Table 3.3), consistent with the increase in
interconnectivity previously reported when increased emulsification energy was
employed [30]. It is important to note that the number of windows determined from the SEM images is an underestimation of the true value, as not all the windows which were present will be visible given the cross sectioning of the sample during preparation for analysis. However, given all the samples were prepared in this way, comparisons made between samples are expected to be more reliable, even though the values being
compared are not a true reflection of the actual number of windows present in each case.
61 windows against the average surface area of the voids provides a more accurate estimate of the proportion of the voids surface that a single window occupies.
Secondly, this does not take into account the actual number of windows that are present. It is proposed that the product of the average number of windows per void with the average degree of interconnectivity (relative to the surface area of the voids) would provide a more representative interpretation of the relative open cellular nature of these materials (Table 3), and this has previously been termed the openness [4]. If the number of windows could be measured more accurately this would provide an estimate of the actual percentage of the voids surface that was open, however, as discussed above comparisons made between samples are still expected to be reliable.
The average degree of interconnectivity was similar for samples 2-4 (Table 3.3) and multiplying this by the average number of windows also resulted in similar values, however sample 4 possessed the highest value of 1.8 x 10⁻² (compared to 1.7 x 10⁻² and
1.6 x 10⁻² for samples 2 and 3 respectively), which was consistent with the increase in the number of windows observed for this sample. However, the small difference between these values makes interpreting their significance difficult, but this does suggest that increasing the emulsification energy with the homogeniser is only having a small effect on the open cellular nature of these materials. For the sonicated sample (sample 5) the decrease in the void size did not correspond to an increase in the average number of windows per void as expected, as this actually decreased from 5 windows per void to 2. This could be as a result of the increased Laplace pressure associated with smaller droplets [37-38] making droplet deformation more difficult.
An increase in Laplace pressure would also be expected as a result of the increase in the total surface area of the droplets, which requires more surfactant to stabilise the
62 will be another factor that influences window formation. In this case, the increase in Laplace pressure may have resulted in a reduction in the ability for these droplets to deform and thus reduced window formation.
Interestingly, the average degree of interconnectivity appeared larger suggesting that once a window formed it occupied a greater percentage of the voids surface, this has also been observed for other systems when the void size was decreased [41-42]. Decreases in the droplet size typically correspond to the presence of thinner films between adjacent droplets at their point of contact [28, 30], as such it is possible in this case that a larger proportion of the film between droplets has contracted (or been removed) resulting in larger windows relative to the size of the voids. This could also explain why a lower number of windows were observed, as these were actually larger in relative size. The product of the average number of windows by the average degree of interconnectivity for this sample resulted in a value of 3.2 x 10⁻², higher than that achieved when using the
homogeniser, which suggests that, overall, this material possessed voids that were more open in nature.
It should be noted that the openness values calculated are low, and do not appear to correlate to how open the voids appear from examining the SEM images, (Figure 3.1) and there are two main reasons for this. Firstly, the surface of the void (since it is curved and not two-dimensional as it appears in the SEM image) is significantly larger than the area of the windows (which is approximated as two-dimensional). Therefore the area that a window occupies is expected to be significantly less than that of the voids surface. This higher dimensionality of the voids surface, while appearing two-dimensional, is the reason why direct interpretation of the SEM images, in regards to openness, can be misleading. Secondly, the exact number of windows is not known due to the sectioning of the
samples, hence the values calculated are an underestimation of the true openness of the material. However, as discussed above, since each sample was prepared in the same way comparisons of these values are expected to be representative.
63 void diameter (Table 3.2) to that of sample 3 (prepared at the same emulsification energy but with a 60 vol% internal phase) although their window sizes were the same on average. In accordance, sample 1 possessed a higher degree of interconnectivity (Table 3.3). The average number of windows per void was the same for both samples, and the product of this with the average degree of interconnectivity therefore resulted in a higher value of 3.6 x 10⁻² for sample 1 compared to 1.6 x 10⁻² for sample 3. This suggests that sample 1
possessed voids that were more open and is consistent with previous reports where a reduction in the internal phase volume has been detrimental to the open cellular nature of emulsion templated materials [14, 26, 30].
Interestingly, this value was not too different from the value obtained of 3.2 x 10⁻² when
sonication was utilised with the lower internal phase volume (sample 5). In addition, the average specific surface area was higher for sample 1 with a value of 2.2 ± 0.3 m2/g
compared to 1.0 ± 0.2 m2/g for sample 3. This was presumably due to the presence of
larger regions of bulk polymer observed for sample 3 (Figure 3.1), or inaccuracies in the surface area measurements. This has also previously been reported for other poly(MIPE)s prepared with this internal phase volume [16, 18, 22] and is a result of the reduced packing density. Even though it appears that the reduction in internal phase volume has compromised the open cellular nature of these materials to a degree, it is clear that by increasing the emulsification energy, in particular when sonication was employed, this
64
Table 3.4 Morphological features of the porous polymers for Samples 5 & 8-14
a Average void diameter as determined from SEM. b Average median pore diameter (volume) as determined from
Mercury Intrusion Porosimetry (MIP). c Average specific surface area as determined from the BET method. d Average dry state porosity as determined by immersion in acetone. U Emulsification with the digital sonifier®, the amplitude (amp) and sonication time is provided.
effect can be reduced resulting in the obtainment of highly interconnected hydrophilic structures from emulsion templates with internal phases below 74 vol%.
Sonication for the preparation of these materials was investigated further as, in addition to providing an open cellular nature similar to that observed with the higher internal phase volume (albeit with a lower number of windows), it also resulted in surface areas that appeared larger than that of the homogenised samples. Materials with larger surface areas are important for several applications including catalysis [43], chromatography [44], sample preparation and extraction [45]. Increasing the duration of sonication (sample 6) or the sonication amplitude (sample 7) did not appear to result in significant alterations in the morphology for these materials (Tables 3.2 & 3.3 and Figure 3.2), however increases in the surfactant level with fixed emulsification energy (digital sonifier at 30% amplitude for 5 min) did appear to have a significant effect (Figure 3.3). The samples prepared with
Figure 3.3. SEM images of samples 8-10, prepared from a 60 vol% internal phase but with different surfactant levels. Scale bar is 1 μm.
Sample V / μm a P / μm b BET / m2g-1c ϕd / % d Preparation
5 0.7 ± 0.4 0.26 ± 0.01 7.5 ± 0.4 63 ± 3 [60% IP, 30% amp, 5 minU, 5 wt%]
8 0.5 ± 0.3 0.45 ± 0.01 4.5 ± 0.3 62 ± 3 [60% IP, 30% amp, 5 minU, 10 wt%]
9 - 0.61 ± 0.02 3.2 ± 0.7 59 ± 1 [60% IP, 30% amp, 5 minU, 15 wt%]
10 - 0.72 ± 0.01 6.4 ± 0.1 62 ± 2 [60% IP, 30% amp, 5 minU, 20 wt%]
11 0.4 ± 0.2 0.295 ± 0.001 6.1 ± 0.3 48 ± 5 [50% IP, 30% amp, 5 minU, 5 wt%]
12 0.7 ± 0.3 0.437 ± 0.004 3.0 ± 0.1 36 ± 3 [40% IP, 30% amp, 5 minU, 5 wt%]
13 1 ± 1 0.68 ± 0.01 0.20 ± 0.01 - [20% IP, 30% amp, 5 minU, 5 wt%]
65 10, 15 and 20 wt% Tween® 85 were denoted as samples 8-10 (Table 3.1) respectively and their morphological features are shown in Table 3.4.
An increase from 5 to 10 wt% Tween® 85 appeared to result in the loss of the
void/window structure, however open pores that appeared to be cellular in nature were still observed, consistent with a material prepared from a templated approach. Hence their size could be estimated by SEM and these voids possessed an average diameter of 0.5 ± 0.3 μm. This appeared lower than the average void diameter of 0.7 ± 0.4 μm
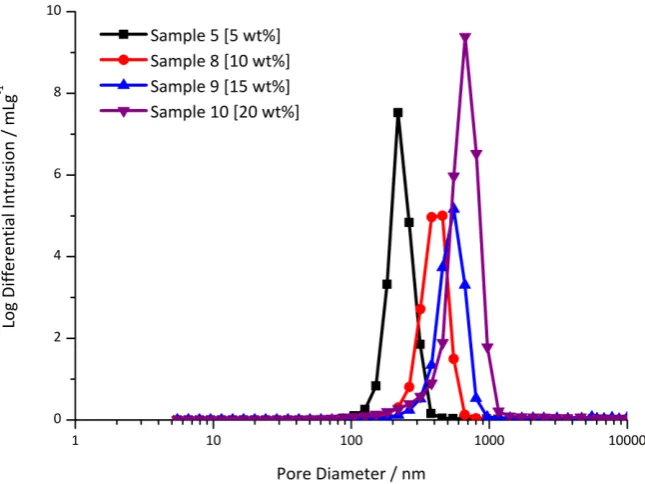
observed when 5 wt% Tween® 85 was utilised, though not statistically different. Given the cross-section of these open pores did not appear to be perfectly circular MIP was also employed (the pore size distributions for these samples can be found in Figure A4 in Appendix A) and provided a similar estimate of 0.45 ± 0.01 μm.
It is important to note that in the case of traditional poly(HIPE) morphologies possessing voids and windows the value obtained by MIP is an estimate of the window size only [46]. This is because the windows fill with mercury before the voids, and hence the intrusion volume of the voids is assigned to the windows. In accordance, the value determined from MIP for sample 5 (5 wt% Tween® 85) of 0.26 ± 0.01 μm was consistent with its window size of 0.2 ± 0.1 μm determined from SEM. In contrast, sample 8 (10 wt% Tween® 85) did not possess the void and window structure and hence the value obtained by MIP is an estimate of the open pores observed in its structure (Figure 3.3). This was also consistent with the estimate obtained by SEM. Increasing the surfactant concentration beyond 10 wt% to 15 and 20 wt% resulted in materials that better resembled the random globular structures typical for conventional AAm monoliths [47-48] prepared by phase separation from a solvent mixture, as the cellular nature appeared to have been lost. Despite the obvious alteration in structure, no macroscopic changes in the emulsions were evident for these samples (Figure A1 in Appendix A).
66 energy was increased with sonication, presumably due to the presence of thinner
continuous phase films as a result of increased droplet contact. Any further reduction in the droplet size would therefore be expected to result in windows of larger relative size and a situation could potentially arise when these voids appear to become predominately open in nature. This is consistent with the void size of sample 8 appearing to be lower than the void size of sample 5. However, the increase in the degree of interconnectivity observed was only significant over a very large variation in the droplet size (Tables 3.2 & 3.3) and the reduction in size (if any) when the surfactant level was increased from 5 wt% to 10 wt% was not statistically significant.
Williams and Wrobleski [31] have observed similar effects for poly(Sty-co-DVB) based foams when the surfactant level was increased. They suggested that the increase in surfactant level simply resulted in increased thinning of the continuous phase film between adjacent droplets, therefore enhancing droplet contact and resulting in larger relative window sizes. It was also observed in their work that this did eventually reach a point where the film disappears completely resulting in the loss of the void structure. Increases in the degree of interconnectivity with increased surfactant levels have also been observed for other systems [40], and this is the more likely explanation for sample 8 (10 wt% Tween 85) appearing to possess voids that have become predominately open in nature. Williams and Wrobleski [31] also reported that increasing the surfactant level beyond this point results in materials that no longer reflect that of the emulsions they are prepared from as they are unable to maintain their structure when dried. This appears to occur for these materials at surfactant concentrations of 15 and 20 wt%.