372
This work is made available under
a Creative Commons Attribution 4.0 International licence.
Analysing the learning pathways of students in a large flipped
engineering course
Carl Reidsema
University of Queensland
Hassan Khosravi
University of Queensland
Melanie Fleming
University of Queensland
Lydia Kavanagh
University of Queensland
Nicholas Achilles
University of Queensland
Esther Fink
University of Queensland
Recent advancements in educational technologies (learning management systems, online discussion
forums, peer-learning tools) coupled with new methods of course delivery (e.g. blended, flipped,
MOOCs) provide significant opportunities for universities to deliver challenging, high quality, yet
engaging curriculum for students. In this paper, we examine the variations and similarities of student’s
approaches to learning (learning pathways) by examining how well they performed in a large (N ~ 1000
student) first year engineering flipped classroom. The analysis focused on student’s performance in their
assessment (formative and summative) as well as their online interaction with a range of tools
purposely built to support students through peer learning and acquisition of resources and expertise.
Analysis using k-means clustering reveals that students do in fact adopt a variety of successful pathways
through the course. The unique aspects of this work lie in the use of analytics algorithms that whilst
perhaps routinely utilised in data mining, are not as well utilised in better understanding patterns
(successful or otherwise) of student interactions within a technology enhanced active learning
environment that integrates theory with engineering practice.
Introduction
There is a growing body of research about how students interact with online and blended learning pedagogies. These began with early understandings of the potential of distance education (Moore, 1989, 1990), to how online learning could foster a community of inquiry (Anderson & Garrison 1997; Garrison, Anderson & Archer 2000). However, what has sometimes been lacking is an evidence-based approach to learning analytics that supports learners and staff (Kruse & Pongsajapan, 2012; and that is based on learning design, and behavioural, social and cognitive measures of engagement. It also requires the development of learning analytics that tell us with useful information about students’ progress through their studies (Long & Siemens 2011). The significance of this work is that it takes a more diverse view of learning analytics, built along solid learning design principles and utilises data generated during student learning activities to contribute to student facing learning analytics as well as providing meaningful data for staff. The following sections outline engagement, learning analytics and the learning design approach taken.
Literature review
There has been some criticism of learning analytics as favouring behaviourist measures over more complex and nuanced understandings of learning (Siemens and Long, ). Mamun, Lawrie and Wright (2016) define engagement in behavioural terms as “student participation, effort, attention, persistence and positive conduct towards the learning activity” (p. 381). Defining student engagement in purely behaviourist terms is inconsistent with the approach proposed by Wiseman, Kennedy and Lodge (2016), where it is defined as “students’ active involvement or deliberate investment of effort in their educational activities” (p. 666). Wiseman, Kennedy and Lodge (2016) reinforce the notion that engagement cannot be seen in strictly behaviourist terms and must comprise cognitive, affective and behavioural dimensions. This latter definition characterises the sense in which the term is used in this paper.
ASCILITE 2017 UNIVERSITY OF SOUTHERN QUEENSLAND 373 terms of retention or grade achieved (Davies & Graff,
2005; Yu & Jo, 2014) however it can be measured in terms
of course completion (Breslow et al., 2013). Davies and Graff (2005) found that there was little difference in performance (measured as grades) based on student participation in an online discussion forum. The exception to this was failing students, whose interactions were very low. Yu and Jo (2014) identified four variables that were predictive of student success or performance (time using the LMS; interaction with peers; regularity of access of LMS; and number of downloads). These four variables accounted for 33.5% of the variance in the final grade but tend to have a focus on behavioural analytics. Breslow et al. (2013) similarly used time spent on resources as a measure of student engagement leading to success (in this case obtaining a certificate of completion for a MOOC course). The resources investigated included videos, problem solving, online laboratories, and a discussion forum.
However, Kuo, Walker, Schroder and Belland (2014) found that learner-instructor and learner-content interactions were predictors of student success but learner-learner interactions were not. Additionally, Lam and Muldner (2017) found that cognitive engagement leads to better learning outcomes, especially where that task is collaborative. Viewing performance in narrow terms risks providing incomplete information to either staff or students about their possibility of a student doing well in the course of study. These findings seem to indicate that technology enhanced, active learning environments that seek to develop social skills may be ineffective if they do not sufficiently support the needs of student’s collaborative efforts to complete assessment tasks.
On the other hand, Tempelaar, Rienties and Giesbers (2015) found that student performance on formative assessment tasks was a stronger predictor of student performance than time spent using the LMS (e.g. such as using clickstream data). Scheffel et al. (2017) found that the number of posts made in a discussion forum was a better predictor of performance than time spent online per se. Scheffel et al. (2017) advocate for the use of learning analytics that are skills based and that support learners whilst they are engaged in the course. This would lend itself to an approach where students are supported to learn interpersonal skills, intra-personal
understandings and other practice based skills, whilst still linking them firmly with disciplinary practice. This leads to the necessity to identify suitable student-facing learning analytics and how best to present them (Verbert et al., 2014).
Providing students with information about their own learning practices and might enable them to make decisions regarding how to be successful themselves and
how to gauge their current levels of success. This tends to support the (seemingly common sense) notion that the learning environment itself, and therefore the learning design may have a greater influence on the actions required for genuine success than a poorly thought out online learning presence. It also suggests that a range of measures are likely to be predictive of success and that there is a need to investigate more complex and nuanced ways of understanding student progress, particularly in authentic technology enhanced active learning oriented courses. This brief survey of the research literature leads to the identification of a range of indicators that might be provided to students in the form of dashboards and visualisations.
Learning context
Engineering Modelling and Problem Solving or ENGG1200, is a large (approximately 1000 students) second semester first year course, originally implemented in 2012. This course has been modified over the past 5 years in response to staff and student needs. The course is designed to introduce students early to the concept of what it is like to work as an engineer on complex, ill-defined problems. In this case students have the choice to complete either an aircraft prototype (such as a glider with landing beacon) or a process control system (treatment of water using a regent activated at a certain temperature).
(Mamum, Lawrie & Wright 2016). Student ownership of learning is a key part of ENGG1200.
Because there are no lectures a “digital ecosystem” has been developed to support student learning. Since 2013, we have trialled and incorporated Facebook for Schools but develop Casper Q&A, (a novel student mediated discussion tool) in an effort to mitigate the loss of social presence that might otherwise be provided by the lecture activity (Smith et al., 2013). Additionally, the
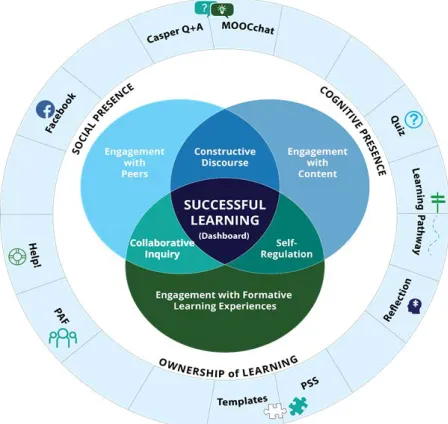
consequences of this type of course design with such large numbers of students are that there is a loss of “feel” for how well students are engaging as well as performing in various elements of the course. The tools are also designed to support students to develop reflective writing and professional development goals (Reflection tool), critical thinking (MOOCchat), group work measured using the Peer Assessment Factor (through the PAF tool) and problem solving skills (PSS, which forms part of the group design project). The assessment incorporates summative and formative assessment tasks (templates, memo, online quizzes, mid semester exam, project report). The
[image:3.595.43.267.489.701.2]approximate relationship of the tools and assessment is shown in figure 1). Students can also make use of the Learning Pathway tool (Reidsema, Kavanagh, Fink, Long & Smith 2014) to keep track of their completion of tasks and assessments throughout the semester. The data gathered from these online tools, including clickstream data could be used to generate information of relevance to the large teaching team and to the students themselves. Currently, information is presented to students in the form of a dashboard.
Figure 1: Integration of assessment aims and online support tools for authentic flipped learning
Methodology
Approach
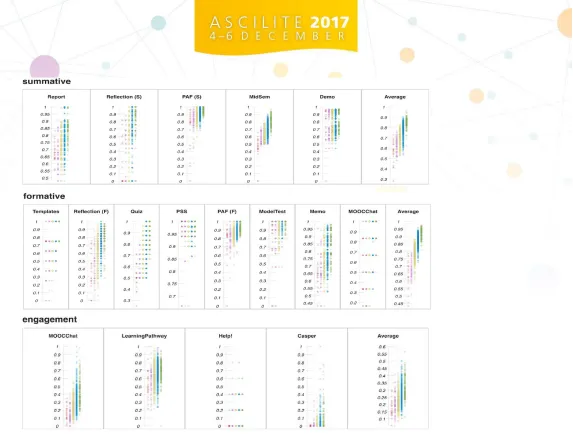
Available scores capturing the class raw data of the 832 students registered in the course are presented in Figure 2. Students are graded on a seven-point scale where 7 is a high distinction, 6 a distinction, 5 a credit, 4 a pass and grades below 3 are failing grades. Li represents available
scores for students that have received a final grade of between 3 and 7. In addition, L is organised into 3 sub-tables: S with feature S1… Ss, represent scores that
illustrate performance of the students in summative assessments, F with features F1… Ff, represent scores that
illustrate performance of the students in formative assessments, and E with features E1… Ee, represent scores
ASCILITE 2017 UNIVERSITY OF SOUTHERN QUEENSLAND 375
Figure 2 demonstrates a snap shot of the learning dashboard visualising the grade and engagement distribution of students with each course grade across different tools and assessments. In this dashboard, the following colour-coding is used for grades: green=grade of 7, blue= grade of 6, yellow= grade of 5, pink= grade of 4, and orange = grade of 3
Data organisation
Data from 832 students are included in this study. For each student, a total of 53 available scores are used to compute a set of 16 features. S features are organised into S1 (Demo Day), S2 (Reflections), S3 (Mid-Semester Exam), S4 (Final Report), S5
(PAF 2). Saverage represents the average score across all formative features. F features are organised into F1 (Templates), F2
(Problem Solving Sheets), F3 (Online Quizzes), F4 (Moocchat), F5 (Preliminary Memo), F6 (Model Test), F7 (PAF 1). Faverage
represents the average score across all formative features. E features are organised as follows as E1 (Percent of item accesses
for each week in the Learning Pathway tool), E2 (Number of posts in the MOOCchat tool), E3 Number of tickets opened in the
Help! tool, E4 (Number of question views in the Casper tool. Al results were normalised to between and 1. Eaverage represents
the average score across all engagement features.
Results
Clustering
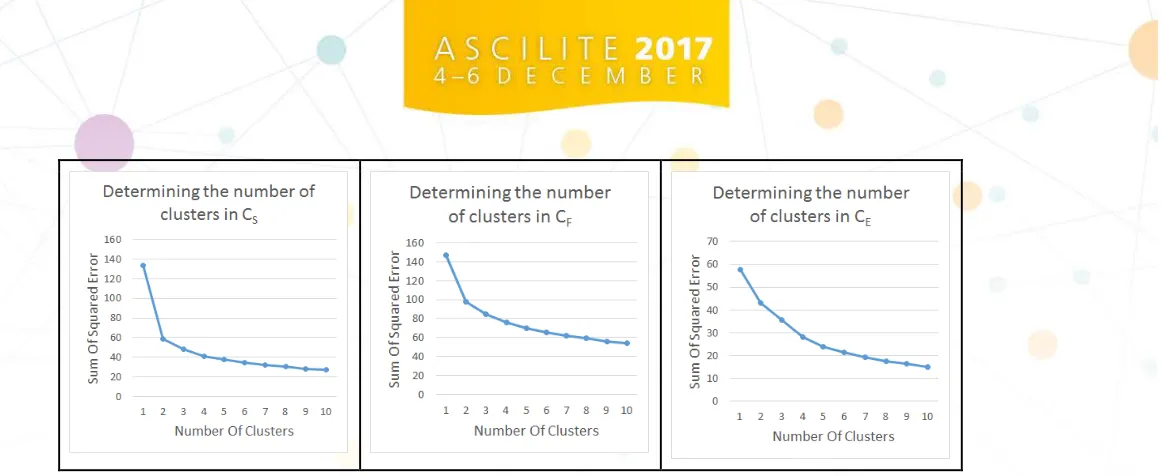
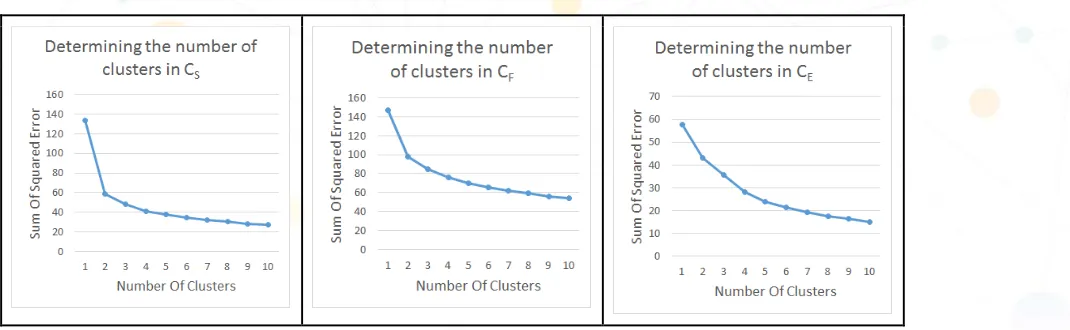
An established clustering algorithm, k-means (Khosravi & Cooper, 2017), has been employed to investigate and reveal patterns of learning and engagement in sub-populations of students with the same final course-grade. We determined values for the range of K using the “elbow” method (Khosravi & Cooper, 2017), which can be traced back to (Thorndike, 1953). This method aims to obtain the number of clusters by computing and plotting the sum of square errors (SSE) for a range
Figure 3: Using the elbow method for determining KS, KF, and KE
Clustering Based on Summative Assessments
The results obtained from running k-means with four clusters identified as CS1,CS2,CS3, and CS4 on S, which captures the
performance of the students in summative assessments, are reported in table 2. Clusters are ordered based on SAverage,
[image:5.595.48.316.364.439.2]which captures the average performance of members of a cluster across all of the summative assessments.
Table 2: Using k-means to cluster the students based on their summative assessments. S1 (Demo Day), S2 (Reflections), S3
(Mid-Semester Exam), S4 (Final Report), S5 (PAF 2), Saverage (average of S1 … S5)
Name N S1 S2 S3 S4 S5 Saverage
CS1 229 0.929 0.769 0.692 0.793 0.907 0.818
CS2 222 0.693 0.829 0.756 0.797 0.925 0.800
CS3 174 0.668 0.669 0.594 0.720 0.863 0.703
CS4 207 0.799 0.354 0.617 0.742 0.850 0.672
CS1andCS2could be said to be good all round performers (with 229 and 222 students in each of these clusters respectively).
What distinguishes these two groups is their performance on the Demo Day, the Mid-semester exam and their PAF2 scores. These two groups have the highest performance based on SAverage however, CS2 students appear to dominate teamwork
sessions based on their higher S5 (PAF) scores, they also score considerably higher than other students on their reflective
pieces. The main factor that separates CS1 members from those in other groups is their high grades on the demo day (S1).
They are also doing well on S4 and S5; however, compared to members in CS2 who appear to be strong individual performers,
their S2 and S3 grades are relatively lower.
The solid performers in CS3 consists of 174 students who have the second lowest performance based on SAverage. They have
the lowest average grade on S1, S3, and S4, suggesting that overall, they are performing poorly on both individual and
team-based assessments.
CS4consists of 207 students who have the lowest performance based on SAverage. Although their performance is better than
members in Cs3 on the majority of the summative assessments, their very low grade or failure to complete the Reflections (S2)
puts them in the lowest performing cluster. This cluster also has the lowest average grade on S5, indicating that on average
they are seen as the lowest contributors to the teamwork component.
Clustering Based on Formative Assessments
The results obtained from running k-means with four clusters identified as CF1,CF2,CF3, and CF4 on F, which captures the
performance of the students in formative assessments, are reported in table 3. Clusters are ordered based on FAverage, which
captures the average performance of members of a cluster across all of the formative assessments.
Figure 3 demonstrates the sum of squares error for 1 to 10 clusters for CS, CF, and CE (these clusters are described in more
detail later in this section.) The elbow method attempts to find clusters that have the properties of internal cohesion and external separation. However it is challenging to find an appropriate number of clusters based on student populations that are scattered across the feature space, resulting in over-fitting or under-fitting the data. In this example, the recommended value for KS, and KF, is 2 and possibly 3 for KE. However this results in an under-fitted data set. McKelvey (1975, 1978, cited in
ASCILITE 2017 UNIVERSITY OF SOUTHERN QUEENSLAND 377 approach as it is not possible to ascertain which variables will identify differences among observations. As such, despite the recommendation, since this is an exploratory study, we used the elbow method to give us a ballpark figure for the minimum number of clusters and chose 4 clusters in each case to have the ability to perform a more in-depth analysis.
Figure 3: Using the elbow method for determining KS, KF, and KE
Clustering based on summative assessments
The results obtained from running k-means with four clusters identified as CS1,CS2,CS3, and CS4 on S, which captures the
performance of the students in summative assessments, are reported in table 2. Clusters are ordered based on SAverage,
[image:6.595.43.358.414.541.2]which captures the average performance of members of a cluster across all of the summative assessments.
Table 2: Using k-means to cluster the students based on their summative assessments. S1 (Demo Day), S2 (Reflections), S3
(Mid-Semester Exam), S4 (Final Report), S5 (PAF 2), Saverage (average of S1 … S5)
Name N S1 S2 S3 S4 S5 Saverage
CS1 229 0.929 0.769 0.692 0.793 0.907 0.818
CS2 222 0.693 0.829 0.756 0.797 0.925 0.800
CS3 174 0.668 0.669 0.594 0.720 0.863 0.703
CS4 207 0.799 0.354 0.617 0.742 0.850 0.672
CS1andCS2could be said to be good all round performers (with 229 and 222 students in each of these clusters respectively).
What distinguishes these two groups is their performance on the Demo Day, the Mid-semester exam and their PAF2 scores. These two groups have the highest performance based on SAverage however, CS2 students appear to dominate teamwork
sessions based on their higher S5 (PAF) scores, they also score considerably higher than other students on their reflective
pieces. The main factor that separates CS1 members from those in other groups is their high grades on the demo day (S1).
They are also doing well on S4 and S5; however, compared to members in CS2 who appear to be strong individual performers,
their S2 and S3 grades are relatively lower.
The solid performers in CS3 consists of 174 students who have the second lowest performance based on SAverage. They have
the lowest average grade on S1, S3, and S4, suggesting that overall, they are performing poorly on both individual and
team-based assessments.
CS4consists of 207 students who have the lowest performance based on SAverage. Although their performance is better than
members in Cs3 on the majority of the summative assessments, their very low grade or failure to complete the Reflections (S2)
puts them in the lowest performing cluster. This cluster also has the lowest average grade on S5, indicating that on average
Clustering based on formative assessments
The results obtained from running k-means with four clusters identified as CF1,CF2,CF3, and CF4 on F, which captures the
performance of the students in formative assessments, are reported in table 3. Clusters are ordered based on FAverage, which
captures the average performance of members of a cluster across all of the formative assessments.
Table 3: Using k-means to cluster students based on formative assessments. F1 (Templates), F2 (Problem Solving Sheets), F3
(Online Quizzes), F4 (MOOCchat), F5 (Preliminary Memo), F6 (Model Test), F7 (PAF 1), Faverage (average of F1…F7)
Name N F1 F2 F3 F4 F5 F6 F7 Faverage
CF1 368 0.992 0.997 0.829 0.959 0.790 0.964 0.892 0.915
CF2 149 0.995 0.975 0.690 0.674 0.765 0.953 0.853 0.844
CF3 215 0.690 0.970 0.691 0.813 0.764 0.930 0.859 0.817
CF4 100 0.580 0.973 0.580 0.412 0.714 0.865 0.806 0.704
CF1 consists of 368 students who have the highest performance based on FAverage. Except for F1, they have the highest average
grade on all of the formative assessments. In particular, they have a much higher average grade in F3 and F4 compared to the
other clusters.
CF2 consists of 149 students who have the second highest performance based on FAverage. They have the highest average grade
for F1 and the second highest average across most of the other formative assessments. An interesting note is that their
average F4 grades is much lower than both members from CF1 and CF3, suggesting that these students do relatively well on all
of the formative assessments except the online quizzes.
CF3 consists of 215 students who have the second lowest performance when averaged across formative assessments. Their
lower F1 and higher F4 score seem to be their differentiating factor from members clustered into CF2.
CF4 consists of 100 students who have the lowest performance when averaged across formative assessments. Except for F2,
they have the lowest average grade on all of the formative assessments. In particular, their F1, F3, and F4 scores are
significantly lower than members of all of the other clusters.
Clustering based on online engagement
The results obtained from running k-means with four clusters identified as CE1,CE2,CE3, and CE4 on E, which approximates
engagement of the students, are reported in table 4. Clusters are ordered based on EAverage, which approximates the average
engagement of members of a cluster across all of the available tools in the course. Roughly 70% of the students have not used E4 at all, and approximately 5% of the students have used it extensively, viewing many of the questions that are asked
on Casper. This explains why average engagement with E4 is low in all of the clusters.
Table 4: Using k-means to cluster students based on engagement. E1 (Learning Pathway), E2 (MOOCchat), E3 (Help!), E4
(Casper), Ee (Average of E1…E4)
Name N E1 E2 E3 E4 Ee
CE1 100 0.705 0.298 0.316 0.049 0.342
CE2 168 0.699 0.532 0.024 0.069 0.331
CE3 326 0.714 0.258 0 0.040 0.253
ASCILITE 2017 UNIVERSITY OF SOUTHERN QUEENSLAND 379
CE1 consists of 100 students who have the highest engagement based on FAverage. They have the highest average engagement
with E3 and have the second highest average engagement with all of the other tools.
CE2 consists of 168 students who have the second highest engagement based on FAverage. They have the highest average
engagement with E2, indicating that most students in this cluster take a leading role in MOOCchat discussions. They also have
the average engagement in E4 and the second highest average engagement with E3.
CE3 consists of 326 students who have the second lowest engagement based on FAverage. Despite their low overall engagement,
they have the highest average engagement with E1, indicating that most students in this cluster are pro-active on the
Learning Pathway. Interestingly their average E3 score is 0, illustrating that none of the students in this cluster have ever
sought help!
CE4 consists of 238 students who have the lowest engagement based on FAverage. Apart from their overall low engagement,
they also have the lowest average engagement on almost all, except E3, of the individual tools, indicating that they mostly
take a passive role in the course.
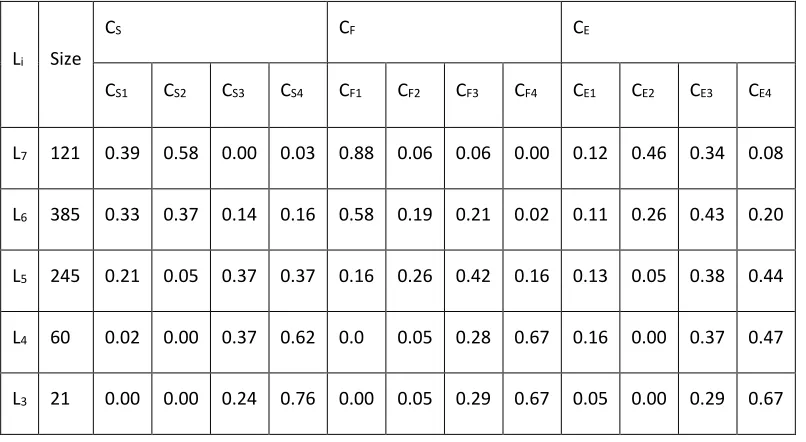
Analysing the learning pathways of students with a similar course-grade
Table 5 illustrates the membership of students with a similar course-grade (3 – 7) with reference to their associated clusters in CS, CF, and CE, and Figure 2 demonstrates a snapshot of the learning dashboard visualising the grade and engagement
[image:8.595.43.446.361.582.2]distribution of students with each course grade across different tools and assessments.
Table 5: Membership of students with a similar course-grade with reference to their associated clusters in CS, CF, and CE
Li Size
CS CF CE
CS1 CS2 CS3 CS4 CF1 CF2 CF3 CF4 CE1 CE2 CE3 CE4
L7 121 0.39 0.58 0.00 0.03 0.88 0.06 0.06 0.00 0.12 0.46 0.34 0.08
L6 385 0.33 0.37 0.14 0.16 0.58 0.19 0.21 0.02 0.11 0.26 0.43 0.20
L5 245 0.21 0.05 0.37 0.37 0.16 0.26 0.42 0.16 0.13 0.05 0.38 0.44
L4 60 0.02 0.00 0.37 0.62 0.0 0.05 0.28 0.67 0.16 0.00 0.37 0.47
L7constitutes of 121 students (14%) of the class
population. The highest achieving students have mixed patterns of engagement, and summative results, but more distinct formative result membership. Their distributed memberships to CS1 and CS2 show that they
either perform extremely well on both their individual summative assessments and group summative assessments or mostly on their group summative
assessments. The distribution of formative features shows a strong alignment to CF1, indicating that the students in
L7 consistently achieve the best results in all formative
assessment items. L7 membership strongly aligns to CE2
and CE3, with a small population belonging to CE1, and less
than one percent hardly engaging at all. The CE2
membership shows that 46% of these students taking a leading role in MOOCChat and are highly engaged with Casper. On the other hand the CE3 membership shows
that 33% of these students primarily engage with The Learning Pathway without utilising the other tools. Interestingly, 11% of these students, despite doing extremely well, have reached out and asked for help.
L6 constitutes of 385 students (46%) of the class
population. Students in this cluster have mixed summative and engagement memberships, with less varying formative memberships. The distribution between CS1 and CS2 shows that some of these students perform
extremely well on their respective group or individual assessment items, with the less prominent memberships to CS3 and CS4 indicating that there were students who
have poorer team workload distribution, or worse individual assessment achievements and thus inferior summative assessment results. The divided memberships between CF1, CF2, and CF3 indicate that L6 consistently
perform well on the formative assessments, however the close split between CF2 and CF3 shows that some students
drop marks on the Templates (Individual), but make up for these lost marks in MOOCchat (Team), or vice-versa. L6 has varied membership features, indicating that each
student found their own pathway to success with the tools. CE1 membership indicates that these students had a
good balance of using each tool, whereas CE3 membership
shows that some students achieved with relative little use of the Help! tool. Membership to CE2 shows that 26
percent of students found success through leading discussions in MOOCchat, and not valuing the use of
Casper. The remaining population in CE4 is indicative of
students who had very little engagement, but still succeeded in the course.
L5 constitutes 245 students (29%) of the class population.
Summative student features in this cluster distribute mostly evenly between CS1, CS3, and CS4. This is indicative
that some students performed well on their group projects, but much poorer on their individual assessment
and scaled team project marks as shown through the CS3
and CS4 memberships. Their formative results are spread
out between CF1, CF2, CF3, and CF4, with their strongest
membership being CF3. The variance of the memberships
suggests that students do not perform uniformly well on the formative assessments, but rather excelling in some activities and performing less well in others. L5
engagement patterns vary a lot, with strong memberships to CE3 and CE4 and a weak membership to CE1. The strong
membership to CE4 indicates that these students had very
little online engagement to the course, but still managed to achieve a reasonable grade. The slight CE1 membership
shows that these students spent a lot of time utilising course-learning resources, and the remaining
membership to CE3 indicates a neglect of use of the Help!
tool, but good engagement elsewhere.
L4 constitutes 60 students (7%) of the class population.
The lower achieving students have distinct summative feature membership split between CS3 and CS4. This shows
that students in L4 generally performed poorly on all
summative assessment, and have relative poor team performance. L4 formative results split have a distinct split
between CF3 and CF4. The majority of membership to CF4
indicates that poor achievement in most formative assessments, while the membership to CF3 shows relative
average formative scores. Engagement patterns are divided between CE3 and CE4, with a small membership to
CE1. These memberships indicate that there was a lot of
variance in the way L4 sought knowledge in the course. 36
percent of students in this cluster had high levels of
Learning Pathway engagement, with relatively low
MOOCchat engagement and time spent viewing questions on Casper. These students had no Help! engagement. Conversely, 46 percent of students in L4 had extremely
low engagement features and did not perform well. The remaining 16 percent of L4 failed to achieve superior
grades despite having high engagement across every tool.
L3 constitutes 21 students (2.5%) of the class population.
The failing students have a clear membership to CS4 and a
slight deviation to CS3. They have no association with the
higher-performing clusters, CS1 and CS2. Strong
membership to CS4 indicates that the student teamwork
was poor, and they performed very poorly on individual assessment. L3 exhibits strong membership to CF4 and
slightly less to CF3, with almost no association to the
higher achieving clusters CF1 and CF2. The memberships to
CF4 poor formative scores, and CF3 shows average
formative scores. Engagement patterns are strongly aligned to CE3 and CE4, showing that the students spent a
lot of time seeking assistance in the Help! and viewing questions on Casper. Their lack of membership to CE1 and
ASCILITE 2017 UNIVERSITY OF SOUTHERN QUEENSLAND 381 Learning Pathway, and their MOOCchat participations
were insignificant.
Discussion and conclusion
The main message to be drawn from this study is that students can take several paths through ENGG1200 in order to be successful. We can also say that students receiving a grade of high distinction have good formative assessment results, their engagement is high and that they do well on individually oriented tasks. They tend to be highly engaged in tasks requiring both on campus and online presence, including tasks that require strong participation.
Perhaps the equivocal findings in the literature on the role of attendance and participation relate to a more complex pattern of interaction and engagement overall than previous analyses and research has revealed for all students. Limiting learning analytics to purely behavioural measures, such as clickstream data, without considering cognitive or affective states would be a mistake. However we also need to be mindful of creating learning analytics that are so course specific they are not predictive or useful for judging success in other contexts.
Analysing the learning pathways of students in a blended course that uses a suite of online tools and support systems for delivering a more personalised learning experience is a challenging, open research problem. In this paper, we employed a novel technique, from the fields of data mining and visualisation to investigate the variations and similarities of student’s approaches to learning against those who achieved similar final course grades. Analysis using k-means clustering reveals that students do in fact, adopt very different pathways through the course, suggesting that there are multiple pathways to success in this course.
Perhaps this indicates a shift away from focusing on narrow predictive measures of success to looking at how students can achieve the same overall measure of success in forms of grade, despite having different patterns of interaction with the course and the tools provided in the course. There are several interesting directions to pursue in future work. Our first goal is to utilise the results of the paper to make updates to the course to further enhance the learning experience of the students. A longer-term plan is to release the learning dashboard that was used in this research as an open-access tool, allowing other educators to investigate the learning pathways of students in their own courses.
References
Breslow, L., Pritchard, D. E., Deboer, J., Stump, G. S., Ho, A. D., & Seaton, D. T. (2013). Studying learning in the
worldwide classroom: Research into edX's first MOOC. Research & Practice in Assessment, 8, 13-25.
Clow, D. (2012). "The learning analytics cycle: closing the loop effectively," Proceedings of the 2nd
International Conference on Learning Analytics and Knowledge, Vancouver, British Columbia, Canada. April 29 – May 02. 10.1145/2330601.2330636
Clow, D. (2013). "An overview of learning analytics,"
Teaching in Higher Education, 18, 683-695.
Davies, J. & Graff, M. (2005). Performance in e-learning: online participation and student grades. British Journal of Educational Technology, 36(4), 657-663.
Ferguson, R. & Clow, D. (2015). Examining engagement: Analysing learner subpopulations in massive open online courses (MOOCs). LAK ’15, pages 51–58.
Kavanagh, L. & Reidsema, C. (2014). “The importance of narrative: helping students make sense of what they’re learning”, Paper presented at the 25th Annual Conference of the Australasian Association of Engineering Education (AAEE 2014), Wellington, New Zealand.
Ketchen D. J. Jr., & Shook, C. L. (1996). "The application of cluster analysis in Strategic Management Research: An analysis and critique". Strategic Management Journal. 17(6): 441–458.
Khosravi, H. & Cooper, K. (2017). Using learning analytics to investigate patterns of performance and
engagement in large classes. In: Proceedings of the 2017 ACM SIGCSE Technical Symposium on Computer Science Education. SIGCSE '17, Seattle, WA, United States, (309-314). 8-11 March 2017. doi:10.1145/3017680.3017711
Mamun, A. Lawrie, M. & Wright, G. (2016), Student Behavioural Engagement in Self-Paced Online Learning. Proceedings of the 2016 Ascilite Conference, Adelaide, 27-30 Nov
McCredden, J., Reidsema, C. & Kavanagh, L. (2017). Designing an active learning environment architecture within a flipped classroom for
developing first student engineers, In (Reidsema, C., Kavanagh, L., Hadgraft, R., & Smith, N. (Eds.)The Flipped Classroom - Practice and Practices in Higher Education Singapore; Springer.
Conference (AAEE 2014) Wellington, New Zealand, 2014.
Reidsema, C., Kavanagh, L. & McCredden, J.,
(2016). Project Design and Scaffolding for Realising Practitioner Learning in a Large First Year Flipped Classroom Course, Proceedings of 27th Conference of
the Australasian Association of Engineering Education (AAEE 2016), Coffs Harbour, NSW, Australia. 4-7 December 2016.
Scheffel, M., Drachsler, H., Kreijns, K., de Kraker, J., & Specht, M. (2017, March). Widget, widget as you lead, I am performing well indeed!: using results from an exploratory offline study to inform an empirical online study about a learning analytics widget in a collaborative learning environment. In
Proceedings of the Seventh International Learning Analytics & Knowledge Conference (pp. 289-298). ACM.
Siemens, G. & Long, P. (2011). Penetrating the Fog: Analytics in Learning and Education. Available:
http://er.educause.edu/articles/2011/9/penetrating -the-fog-analytics-in-learning-and-education
Thorndike, R. L. (1953). Who belongs in the family?
Psychometrika, 18(4):267–276, 1953.
Verbert, K., Duval, E. Klerkx, S. Govaerts, & J. L. Santos, "Learning Analytics Dashboard Applications,"
American Behavioral Scientist, vol. 57, pp. 1500-1509, October 1, 2013 2013.
Wiseman, P., Kennedy, G., & Lodge, J. (2016) Models for understanding student engagement in digital learning
environments. Proceedings of the 2016 Ascilite
Conference, Adelaide, 27-30 Nov, 2016.
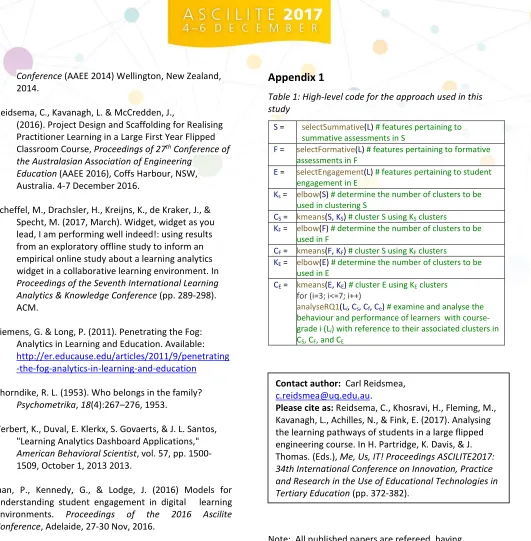
[image:11.595.48.579.16.557.2]Appendix 1
Table 1: High-level code for the approach used in this study
S = selectSummative(L) # features pertaining to summative assessments in S
F = selectFormative(L) # features pertaining to formative assessments in F
E = selectEngagement(L) # features pertaining to student engagement in E
Ks = elbow(S) # determine the number of clusters to be
used in clustering S
CS = kmeans(S, KS) # cluster S using KS clusters
KF = elbow(F) # determine the number of clusters to be
used in F
CF = kmeans(F, KF) # cluster S using KF clusters
KE = elbow(E) # determine the number of clusters to be
used in E
CE = kmeans(E, KE) # cluster E using KE clusters
for (i=3; i<=7; i++)
analyseRQ1(Li, Cs, Cf, Ce) # examine and analyse the
behaviour and performance of learners with course-grade i (Li) with reference to their associated clusters in CS, CF, and CE
Note: All published papers are refereed, having undergone a double-blind peer-review process.
Contact author: Carl Reidsmea,