AUSTRALIAN CliMate
app
An evaluation for the Managing Climate
Variability Program
Managed by the Grain Research and Development
Corporation
GRDC Project USQ00020
Author:
Dr Ann Starasts
Affiliation:
University of Southern Queensland
Date:
May 2018
1
EXECUTIVE SUMMARY
1.1
Introduction
This evaluation of the Australian CliMate app (Version 2) (CliMate) explored its functionality and usability along with the needs of users in adopting the app. It investigated potential benefits of using CliMate in management and decision making in Australian agriculture.
CliMate was developed originally as a smartphone App incorporating historical and current weather (rainfall, temperature, solar radiation) data and climate forecasting indicators into a suite of decision support tools. The app is available on website, iOS and Android platforms. Analyses available include:
How’s the Season – current season’s progress compared with previous years;
How Often? – probabilities of future weather events based on historic data;
How Wet/Nitrate? – soil water and nitrate gains over a fallow period; Yield Potential? - a simple water use efficiency based progressive yield
estimator;
Drought? – current drought status for a selected residence period; How Hot/Cold? – risk of heat or cold stress;
How Likely? – ENSO based seasonal forecast; How’s El Nino? – ENSO status;
How’s the Past? – views of historic weather patterns; and What Trend? – explore trends in weather variables.
The CliMate app was developed by RPS Australia Pty Ltd (V1 2013) and the University of Southern Queensland (V2 2017, 2018) for the Managing Climate Variability Program (MCVP) (http://managingclimate.gov.au/ ).
This evaluation was based on three sources of data including: Online survey (97 respondents),
Interviews with CliMate users (34 participants), and
User statistics available since July 2017 (web) and Nov 2017 (iOS).
CliMate is a success story. It has been adopted throughout the major agricultural areas of Australia, with particular emphasis on grains and livestock industries as well as crop insurance, government, and agribusiness. There were 20 000
registered users of Version 1 (early 2017). Version 2 (which was released in July 2017) has growing numbers of registrations and accesses (Table 1.1).
Table 1.1 Summary of main user statistics (April 2018) - CliMate Version 2.
Registrations (last 9 months) 4300
Accesses per month 4000
Farmers and advisors represent 70% of users with 70% using an iOS device and 27% use a www browser. Farmers undertake 43% of all app sessions and
advisors 28%. Three percent of users are using an Android device.
CliMate’s points of differentiation for users beyond other available climate information products include:
Data is locally-specific to a user’s choice of weather station, providing actual, historical data in simple graphical screens, (hiding vast quantities of data); and
Easily interrogated around a user’s specific location and time-based questions, mobile-friendly and portable.
1.2
Barriers to use of CliMate
The increasing user registrations and CliMate calculations (especially in April-May 2018) indicate there are few major barriers to use of this app. The main barrier to use of the app appears to be limited awareness of the app.
A number of users reported difficulties installing and using the app, and similarly difficulties using CliMate data in decisions. The fast growing user base
(particularly with seemingly very little promotion or organisational support within industries or at local levels) is evidence of the value of this app. Supporting information may assist users to fully use the app. It is suggested that examples (e.g. case studies) and contact with people may help users to use the app more fully.
Some users have not explored all of the CliMate calculations, and some indicated they do not understand or trust calculations, particularly How Wet/Nitrate,
Potential Yield and How Hot How Cold. Some saw Potential Yield, El Nino or Drought as not relevant or did not understand them. Users requested further information and examples of use.
1.3
Outcomes
Table 1.2 highlights the substantial user outcomes associated with use of the CliMate app identified within this evaluation including:
65% and 33% of survey respondents indicated that Climate had contributed to positive outcomes and improved income respectively. 47% of survey respondents believed that using CliMate had improved
their decisions or advice
54% of survey respondents believe that using CliMate has resulted in them considering weather data more carefully in their decisions 46% of survey respondents believe that using the CliMate app had
Table 1.2 CliMate app – Outcomes and impact areas
Areas of impact
Overall
Respondents who agreed
(%)
CliMate has contributed to positive outcomes 65
Contribute to maximising production 16
Income is improved by using CliMate 33
Decision Making and management
Using CliMate has improved decisions or advice 47 Using CliMate has improved business or production planning 27 Using CliMate has helped operate businesses more reliably 27
Practices
Use Climate to compare current with previous seasons 80 Use CliMate app to review the season and help explain the
outcome 63
Consider weather data more in decisions since using CliMate 54
Capacities and knowledge
Better climate monitoring from using CliMate 46 Improved understanding of weather impacts on business and
decisions 38
CliMate enabled more informed decisions or advice 46 (n=97)
1.4
Impacts
The following outlines how using the CliMate app had contributed to the areas of impact identified in Table 1.2.
1.4.1
Enhanced users’ knowledge and capacities through:
(a)Easier access to historical weather data and enhanced ability to incorporate this data into decisions and advisory processes.
(b)Improved knowledge of seasons compared to previous seasons and of the chances and possible future weather scenarios, extent of risks to crops and the feasibility of management options, and the extent of crop and soil responses to specific weather statistics.
1.4.2
The CliMate app is contributing to processes and
management by:
(a)More easily and accurately comparing their current seasons with previous, and incorporating this in decision making;
(c)Using localised weather data to explain cropping outcomes and more thoroughly identify weather scenarios that may impact on production; (d)Contributing to improving agribusiness advisory services; (e)Contributing to agricultural research planning, processes and communications; and
(f)Facilitating business and research planning, processes and communications.
1.4.3
The CliMate app has contributed to communication, learning
and decision making:
Within farming businesses;
Between advisors and clients and contributed to enhanced collaborative and situational learning and decision making; Enhanced local farmer group engagement; and
Enhanced agribusiness knowledge and skilling of staff.
1.5
CliMate app – Strengths, Limitations, Opportunities
and Risks
Strengths
- CliMate’s strength is its simplicity of use, its portability and itssimple holistic graphic outputs. It enables users to interrogate historic and current seasonal weather data in relation to their own location, allowing the user to undertake their own risk assessments.
The app is highly valued for its quick reference ability and to contribute to and
facilitate discussions and decisions making among farming businesses, between advisor and farmer and within farmer groups. It is making a significant contribution, especially within the agribusiness and crop insurance sectors and is widely used in the grains and livestock production. It has been used to guide key investments (property purchase, insurance) which were not originally envisaged in design planning.
Limitations
- Version 2’s requirement to log in to the app each time of use frustrated many users. Version 2 is seen as more complex for many users. One such complexity was the requirement to reset locations each time a different analysis is undertaken. This resulted in a loss of users and has since been improved. In addition, Version 2 contains some analyses that have little relevance to some users (e.g. Yield Potential, El Nino).Box 1.1 Usability limitations of the CliMate app
Opportunities
- CliMate users would like to understand more about the datathey are accessing, and would like more information about default and input threshold values. They would like to more easily print and share output in report form. There was little evidence in this evaluation of on-farm recording of CliMate data for future reference or using CliMate data in other calculators or budgets. Advisors currently use screen shots from CliMate to incorporate into their reports. There are opportunities for further development in such uses of app data. Example cases specific to industries or locations would help users judge the usefulness of the app and better apply the tool to their particular situations.
There are opportunities to consider further functionalities or applications (e.g. identify disease risk of provide nitrogen recommendations), and also to apply CliMate in a broader range of industries and sectors. A subscription-based
approach (especially if the app was tailored to particular sectors) or advertising may be a way of funding future maintenance, development and support.
The app’s framework, databases and 3-platform delivery mode could be used as a base to support future app development in other contexts.
Risks
- The largest risk to the future of this app may be a future lack ofownership and maintenance or support as potentially may occur in project-based developments, as this will affect users the most. Unclear long term goals, target markets or plans have potential to hinder the future of any app. There is also a risk that added functionality may make the app more cumbersome and complex.
Most respondents (86-92%) were able to install and use the app.
15% of farmers (9% of advisors) found it difficult or somewhat difficult to install the app.
20-23% of farmers had difficulties especially in understanding terminology and graphs.
7-9% advisors had ‘somewhat difficulty’ with terminology and understanding graphs.
20-25% farmers (and 12% advisors) found it difficult to change location 23% of farmers (12% advisors) found it difficult or somewhat difficult to use CliMate data in decisions.
1.6
Recommendations
1.6.1
Current CliMate app (for developers)
Qualifications on data - Assurances and explanations for users will help them to trust that the data they are accessing in CliMate is the best available for their location, especially in relation to each state, local weather data networks and trusted sources of weather data.
Identification of infilled data - A more obvious means within CliMate to identify which data is ‘infilled’ from historical averages or nearby weather stations is suggested as a key step forward for users in understanding and trusting CliMate data.
Adequate first user information - Ensure adequate information on choosing thresholds and in choosing and saving default locations and on printing CliMate output is included in help and first user files. Provide qualifications regarding the applicability of (especially) El Nino and Yield Potential, along with thresholds, defaults and standards, and how to adapt for individual situations.
Log-in requirement – It is suggested that the developer rethink the requirement to log in to the app each time of use; decisions could be made around the true value from gathering app analytics compared with user simplicity of access.
Locations –an earlier draft allowed users to select different locations for each analysis – this created some confusion for many users. Subsequently, the developers have now made the default one site for all analyses.
Printing CliMate output and reports – provide information for users on how to print or email CliMate data and outputs, and enhance this facility if possible.
1.6.2
Future CliMate app development
Case studies and examples – It is suggested that example case studies be prepared for specific industries and/or farming systems/regions within Australia, each outlining key relevant meteorological factors and technical comment about the application of CliMate app calculations in that location.
Data output and compatibility – Currently each CliMate analysis is lost unless a screenshot is taken and saved as an image. Provision of the output in report and in spreadsheet format would allow it to be incorporated into other
calculators, decision tools and budgets. Although this data is available from other sources (SILO), CliMate is now a major interface to this data for users.
Weather station data – Although some participants were asking for wider access to more available weather stations and historical data, it is understood that the current app data may be best suited to historical interrogations and better serve the range of CliMate users. It is recommended though that
developers give further consideration to the availability and quality of weather station data in each state in relation to CliMate users’ needs.
Evapotranspiration data – that developers consider the addition of evapotranspiration data to the CliMate suite of outputs.
Real time, Real place data – Interrogation of historical data and forecasts to identify location-based weather event probabilities will be more useful to
agricultural operators when it accesses more exacting location-based weather data – farmers own rainfall and temperature data, along with potentially the incorporation of paddock aspect and slope information. Current and future technologies may be well-placed to meet this expectation, rather than considering it as further functionalities in current CliMate format.
1.6.3
Other app developers for Australian agriculture
It is recommended that future developers of apps and decision support tools for Australian agriculture clearly identify and segment potential users. In doing so, they must consider the range of currently available data, information and technologies on the topic (including how this might vary between industries, states and farming systems) and position and articulate carefully how the new tool adds value within each environment (industry, farming system). In addition, developers could consider the range of users’ education, learning styles,
approaches to information use as well as the types of decisions (industry, farm, science, advisory) they are likely to be making that require the new app input. This market research (outlined above) would be improved if it was accompanied by the development of a brief pilot version of the app, for testing and
identification of its value and place with respect to (i) the already existing realm of information and tools, (ii) the issues and decisions faced by potential users and their required data (including the expectation and need for real
time/location data), and (iii) other tools and calculators that could and should integrate with the app’s data.
It is suggested that the app development timeline include review and testing with users along the way, not only of the initial development, but in subsequent versions. You can’t obviously please all of the people all of the time, but it is important to attempt to please the bulk of the potential users in re-development of any product.
available and supported, what has worked well) in order to gain economic, knowledge and adoption efficiencies.
1.7
Final
The CliMate app is a success story, making contributions especially in grains and livestock production and agri-businesses throughout Australia in terms of
maximising input efficiencies with respect to weather conditions, and identifying and preparing for future seasonal risks.
The fast growing user base (particularly with seemingly very little promotion or organisational support within industries or regions) is evidence of the value of this app. That 65% and 33% of survey respondents indicated that the CliMate app had led to positive outcomes and improved income respectively is a highly commendable outcome for an app. It summarises the widespread very positive responses from a broad range of users. Forty seven percent of survey
respondents believed that using CliMate had improved their decision making and advice.
This evaluation raises the possibilities that the CliMate app could have much wider application across more rural industries, in the education sector and in various other sectors in which a knowledge of the risks associated with weather conditions is important to operations.
1.8
Acknowledgements
Gratitude and thanks to Associate Professor David Freebairn and Dr David McClymont for provision and access to CliMate analytics and databases, historical information and statistics. This evaluation would not have been
possible without participants and survey respondents giving freely of their time and feedback. We thank them most sincerely. Thanks goes to the Grains
Research and Development Corporation and the Managing Climate Variability Program and Program Leaders for funding this evaluation and providing this opportunity.
1.9
Abbreviations
BOM – Bureau of Meteorology IOD - Indian Ocean Dipole DAFWA – Department of Agriculture
and Fisheries, Western Australia MCVP – Managing Climate Variability Program ENSO – El Nino Southern Oscillation RDC’s – Research and Development
Corporations
HE – Higher Education VET – Vocational Education and Training
Table of contents
1 EXECUTIVE SUMMARY ... 2
1.1 Introduction ... 2
1.2 Barriers to use of CliMate ... 3
1.3 Outcomes ... 3
1.4 Impacts ... 4
1.5 CliMate app – Strengths, Limitations, Opportunities and Risks ... 5
1.6 Recommendations... 7
1.7 Final ... 9
1.8 Acknowledgements ... 9
1.9 Abbreviations ... 9
2 Introduction ... 13
2.1 Background ... 13
2.2 An evaluation ... 17
2.3 Research Objectives ... 18
2.4 Overview of Methodology ... 18
3 CliMate – Adoption, value and barriers ... 20
3.1 How CliMate is used ... 20
3.2 Value of CliMate analyses ... 26
3.3 Barriers to use of CliMate app ... 28
4 Use of CliMate and outcomes ... 29
4.1 Example user cases ... 29
4.2 Outcomes and impacts ... 29
5 CliMate analyses and usability ... 41
5.1 Individual CliMate Analyses ... 41
5.2 Usability ... 47
5.3 Problems and suggestions ... 49
6 Use statistics ... 54
6.1 Spatial distribution ... 54
6.4 Sessions ... 56
6.5 Frequency of use of CliMate app ... 59
6.6 CliMate app locations ... 60
6.7 Where do users use the CliMate app ... 61
7 Information, education and awareness ... 63
7.1 Awareness of the CliMate app ... 63
7.2 Access and sharing CliMate information ... 63
8 Discussion ... 66
8.1 CliMate - a success story ... 66
8.2 Decision making and discussion tool ... 67
8.3 Barriers to use ... 67
8.4 CliMate Versions ... 68
8.5 Outcomes and impacts ... 68
8.6 Awareness and promotion ... 70
8.7 Source of CliMate data ... 71
8.8 Large array of climate tools ... 71
8.9 Use of CliMate data ... 72
8.10 Developing personalised applications ... 72
8.11 Applications beyond agriculture ... 73
8.12 Maintenance and support ... 73
8.13 Communication with users ... 73
8.14 Strengths, limitations, opportunities and risks ... 73
9 Conclusions ... 75
10 References ... 76
11 Appendix - CliMate Evaluation ... 77
11.1 CliMate version background ... 77
11.2 CliMate evaluation participants (survey and interview) ... 78
11.3 Survey respondents – Main industries and occupation ... 79
11.4 CliMate Users – Industry and Occupation (May 2018) ... 80
11.7 CliMate Individual Analyses statistics ... 91
11.8 CliMate reviews from App store ... 111
11.9 Additional registration and sessional data ... 112
2
Introduction
2.1
Background
Originally released as a smartphone App in 2013, the Australian CliMate app was developed to incorporate a range of weather-based decision tools into a mobile-friendly platform. It is aimed at decision makers requiring an improved
understanding of weather probabilities and comparisons. It incorporates
historical and near real time weather (rainfall, temperature, solar radiation) data from 4,700 weather stations across Australia as well as a suite of seasonal
climate forecasting indicators.
CliMate II builds on Version I of Australian CliMate developed for the Managing Climate Variability Program in the project "Australian CliMate
Development" [MCV00028]. Australian CliMate Version I was released in 2013 and Version II released July 2017 (www), November 2017 (iOS) and February 2018 (Android). In addition to weather-based calculators the app incorporated soil water and nitrogen mineralisation calculators (suited to broad acre farming). Version II incorporated three new analyses: a yield potential calculator; drought status and a simple trend analyser.
The app is available for downloading on two mobile device formats (iOS version for iPhone and iPad) and Android, and a World Wide Web version which can be used on any internet enabled device or desktop.
CliMate allows the user to interrogate long-term and recent climate records, asking questions relating to rainfall, temperature, radiation, as well as derived variables such as heat sums, soil water and soil nitrate. The app also provides information on seasonal forecasts based on El Nino Southern Oscillation
patterns. The aim is to derive a richer and objective assessment of probabilities of future events and current conditions. Each analysis is caste as a question where variables are selected (e.g. temperature, rainfall, radiation) for a period of interest.
Analyses available on the app include:
How’s the Season? – Compares current season’s progress in terms of rainfall, temperature, heat sum or radiation compared with previous years. This is useful when adjusting inputs during a crop or pasture season.
How Often? – Identifies probabilities of future weather events based on historic data. It identifies the chance of a sowing event based on amount of rainfall over 5 days? Examples of questions include how often is a heat sum achieved in a set period of time? What is the probability of
temperature being below a critical level for germination or flowering? How Wet/Nitrate? – Estimates soil water and nitrate gains over a fallow
period, helping to adjust inputs to better match yield expectations.
Drought? – Provides current drought status for a selected location and residence period.
How Hot/Cold? – Risk of heat or cold stress. When determining an ideal sowing date, when are heat and cold stresses lowest for the optimum flowing time?
How Likely? – An ENSO-based seasonal forecast. Based on current ENSO conditions, what is the probability that rainfall or temperature is greater than or less than key thresholds (e.g. terciles, median) and how reliable have these forecasts been in the past?
How’s El Nino? – What is the current ENSO status based on key atmospheric and oceanic indicators? What is the Australian Bureau of Meteorology’s interpretation of this?
How’s the Past? – Views of historic weather patterns. Presents views of monthly and annual rainfall and temperature summaries to allow the exploration of relationships and patterns.
What Trend? – Explores trends in weather records. A time series graph with a line of best fit (least sum of squares), differences from the mean and cumulative differences (residual mass curves) provide other views of long term data.
The CliMate app enables the provision of the following types of information: Status of a system (e.g. rainfall to date, heat sum, soil water) at a point
in time;
Probability of future events based on long term climate data (rainfall, temperature, heat sum); and
Probability of future events based on available forecasts.
Linkages between recent weather, future probabilities and future outcomes in applying weather data to agricultural decision making (Freebairn and McClymont, 2017)
(Freebairn and McClymont, 2017)
CliMate was developed by the University of Southern Queensland for the Managing Climate Variability (MCV) program and builds on Bureau of
Meteorology data from the Queensland Government’s Silo database. CliMate builds on the many ideas developed by climate specialists.
Version 1 (iOS and www) was quickly adopted throughout Australia with approximately 20,000 registrations in its first 5 years. Version 2 has >4000 registered users with 1400 new registrations in the six months to April 2018. Detailed user statistics are available since November 2017.
Appendix 11.1 outlines a brief history of CliMate versions and associated analytics.
2.2
An evaluation
In agriculture, the availability and use of information systems incorporating local, historical weather data and probabilities has potential to improve management decision making and reduce risks (Haigh, Takle, Andresen, Widhalm, Carlton & Angel, 2015; Carr, Fleming & Kalala 2016).
Yet it is suggested that insufficient emphasis has occurred on exploring how people use and interpret weather and climate data (Anderson, Kootval & Kull, 2015), or on seeking evidence in terms of outcomes and impacts at farm level (Tall, Coulibaly & Diop, 2018). It has been suggested that there have been few ‘positive tangible outcomes’ noted from managing climate risks in agriculture (Hochman and Carberry, 2011, Tall et al., 2018) and yet also that climate risk information is underutilised (Haigh et al., 2015).
Recommendations have been made to incorporate the social and process
(Vogel, Letson & Herrick, 2017), with an increased focus on the user and how the information is used in management to reduce risks.
To optimise technical design and future client uptake of the CliMate app, its technical development therefore needed to be blended with an evaluation of the human interface and application in real world scenarios.
To this end, farmers, agribusiness operators, scientists and other users, as decision makers, participated in this review. The idea is to involve potential users, observe their needs and explore how a new technology might help them. This report outlines an evaluation of the Australian CliMate app, and contributes to an understanding of the needs of users in adoption, and how CliMate
information contributes to decision making. Additionally, feedback on user experience will be used to guide future app developers.
2.3
Research Objectives
This evaluation was commissioned in line with the redevelopment of Version 2 in order to understand how to better meet the needs of users, to identify barriers to adopting the app, and to ascertain how use of the CliMate app adds value to decision making and business success in agriculture.
In particular, this evaluation:
Collates initial usage statistics and considers implications;
Identifies areas of application and use of the App and additional functions that could deliver enhanced product;
Identifies factors associated with usability of the App and its features, and barriers to its adoption and use; and
Identifies examples of value gained from use of the App in areas such as decision making, advisory services, business processes, profitability and sustainability.
Considers users’ needs with respect to business and production decisions and data management systems and processes.
The project did not quantify economic impacts from use of the CliMate app, or compare the app with other available weather information or apps.
2.4
Overview of Methodology
This evaluation investigated farmer and agribusiness use of the CliMate app and considered this in line with outcomes associated with knowledge, skills, attitude, and practice (Radhakrishna & Bowen, 2010; Bennett, 1975). The project used a combination of metrics (to identify evidence of scale), surveys (to explore
opinions and perceptions) and case-based narratives (to understand contextual issues and highlight unique examples) (Penfield, Baker, Scoble & Wykes, 2014; Leith & Vanclay, 2017). It explored and validated outcomes and impacts from use of the app. The concept of impact pathways (Douthwaite, Alvarez, Thiele, & Mackay, 2008) formed a framework for analysis and reporting of outcomes.
or any representative population of CliMate users, rather it sought to seek opinion from farmers, advisors, and scientists from major areas of use
throughout Australia. Appendix 11.2 maps evaluation participants (interview, case studies and online survey) according to their state-based location. Data sources included:
(i) Online survey of users
A link to an online survey was developed and sent to approximately 1200 users following pilot testing with agribusiness and farmer representatives. Those who chose to complete the online survey (Respondents [n=97]) were therefore self-selected and they self-reported their use of the CliMate app.
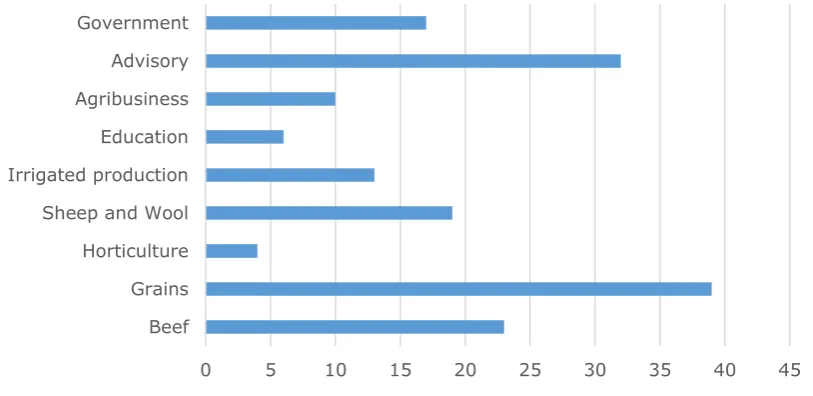
Ninety-seven CliMate users from across Australia responded to the online
[image:19.595.93.500.323.521.2]survey. The range of industries is shown in Figure 2.1 and includes grains, beef, advisory, sheep and wool and government. Further industry and occupation analysis of respondents is provided on survey respondents in Appendix 11.3.
Figure 2.1 Survey respondents - Industries (number) (n=97)
Eleven percent of survey respondents were involved in other industries including Research, Household, Social, General, Sugar cane, Viticulture, Agricultural
services, Mining, and Pest animal control.
The online survey was entirely voluntary and anonymous. No personal data on age, gender or nationality was collected. There were 24 question items in the survey with questions on respondents’ reasons for using CliMate app, value of the app calculations, frequency of use, barriers to use, usability, devices and connectivity, outcomes and benefits from using the app, industry and role. Question types ranged included multiple choice, category selection, 4 and 5 point Likert type scales (Allen & Seaman, 2007) and open-ended responses. Data analysis included descriptive statistical analysis, frequency counts, as well as cross-tabulation of findings based on user industry or role. Visual
representation of open-ended survey responses are presented as word clouds depicting the main text-based categories of responses in proportion with word
0 5 10 15 20 25 30 35 40 45
Anonymous quotes from survey respondents are included in the report but not attributed.
(ii) In-depth interviews with app users.
Following pilot testing, in-depth interviews were held with a purposively selected sample of 34 users from across Australia to represent farming, agribusiness, science and insurance sectors, and a range of locations. This sample of users however, was not intended to be fully representative of all CliMate app users in terms of location, industry, or demographic factors.
Following an introductory email from developers to all users about the study, potential participants (who ranged from avid to novice and some non-users) were contacted by email inviting them to participate in an interview. Many users who were initially contacted did not respond. Those who did formed the sample of participants in the interviews. Interviews were recorded and transcripts produced and analysed.
Interview participants were asked to describe how they use the CliMate app in their role. Qualitative iterative analysis of interview transcripts investigated participants’ use of and attitudes to the app, ensuring that findings were strongly grounded in the data (Corbin & Corbin 1990; Corbin, Strauss & Strauss, 2014) and considerate of user contexts. Categories were identified from within the data and explored to allow a depth of description. Anonymous quotes from interviews are presented and attributed to participant’s role and location.
(iii) Collation of app analytics
Collation and description of use statistics available from the system itself. These included data on users and on their use of the various App queries. Initial data on CliMate app users, their industries and roles is presented in Appendix 11.4. The project operated in accordance with and approved by University of Southern Queensland Ethics Guidelines.
(iv) Case studies
Seventeen participants were chosen as case studies. These descriptive case studies (Yin, 2017) strengthen understandings of the use of the app through additional illustration of its application in each individual context. These cases are presented in Appendix 11.6.
3
CliMate – Adoption, value and barriers
3.1
How CliMate is used
3.1.1
All users
conditions (55% of survey respondents), understand and manage climate-based risks (46% of survey respondents), and to better understand weather conditions (46% of survey respondents).
Survey responses indicated strong support for the CliMate app:
I think it was fantastic that the website and app has been made. Has made accessing the data so much easier.
Great app - keep it up.
Great app love it I’m sure the more I use it the better decisions I will make in time.
I appreciate CliMate very much and am happy to speak to you at any time.
Outstanding product and needs to be actively promoted to primary producers….Overall, excellent work!
Interview respondents explained how the app is contributing to building
confidence in farm-based decision-making and supporting related discussions: (CliMate) gives you confidence with decisions you make or you know the compromises. You are going to take on risk, doesn’t matter what you do in farming. It’s just a matter of being aware of likely outcomes. Agronomist, VIC CliMate is a handy tool, I can pull out the past, forecast the future based on the past, start a discussion based on the past, have a discussion. Just having rainfall (data), having an idea of how likely a certain rainfall event – may need 40 mm rainfall to plant, can have a discussion with a grower that it might be only 30% chance of that happening. Agronomist, NSW
CliMate is something I refer to (as) a decision making tool…(It) backs up what we’re probably thinking a lot of the time. It’s good to have it in a chart or a graph – to firm up what we are thinking and what historically has happened in the visual form. I (use it) for the likelihood sort of thing. How’s the Season – what’s the likelihood of getting x amount of rain between this period and that period. So ... when you are making some of these decisions it just puts it down in front of you in terms of what has happened previously… Mainly for me it’s later in the growing season - looking at the possibility of different outcomes in the finish. There’s not a lot you can vary up front. Grain grower, WA
Participants though were quick to identify that CliMate output is only information and that it is about something as unpredictable as weather - so it cannot be relied upon:
CliMate information is handy but I’m not going to rely on it. Forecasting is not an accurate thing so (we) take it with a grain of salt. Agronomist, NSW
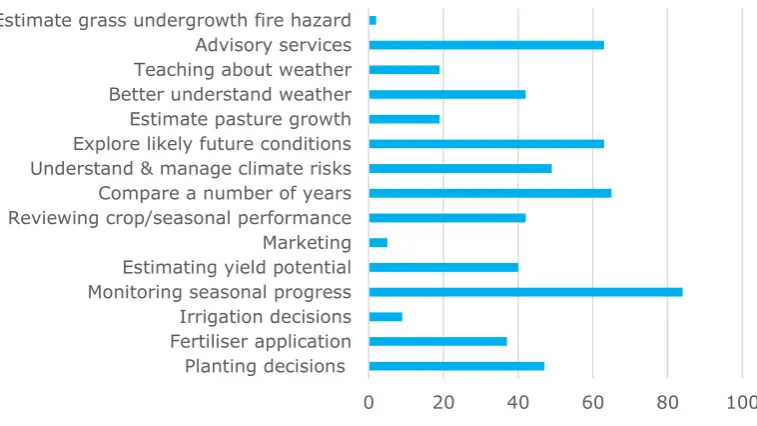
Figure 3.1 Areas of application and use of CliMate app in agricultural decision making (%) (n=97)
3.1.2
Advisors – use of CliMate app
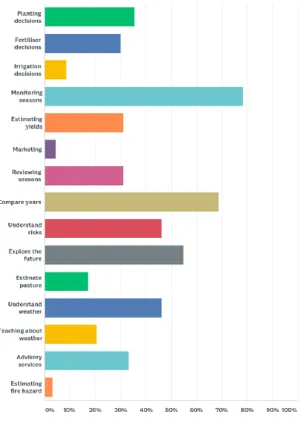
The major areas of focus for advisors was largely to monitor seasonal progress, compare a number of years and explore future possibilities with regards to the current season (Figure 3.2).
Comments
The following advisor comments indicate that the app is contributing evidence to support risk-management discussions in planning and decision making.
Figure 3.2 Advisors - Reasons for using CliMate app (%) (n=43).
Comparing seasons, estimate stored soil moisture, improve season predictably in conjunction with the French Schultz theory.
Has helped monitor the current season’s rainfall and contributed to management decisions based on current situation and seasonal forecast.
Understanding where the real climate risks are in our region.
Helps add another string to the bow when it comes to yield estimates. Also good to help plan how much N to pump into the crop depending on potential.
As an agronomist my main use for it, is as a discussion tool with clients when making seasonal plans and to review seasonal performance. I also use it to determine medium term (2 weeks to 3 months) future potential operations such as topdressing crops, making planting decisions etc.
I use my own spreadsheet tools but it gives a useful quick summary allowing me to quickly and efficiently assess probabilities. This assists me in providing
evidence based advice to my clients and supports my production modelling.
Can look at different localities weather data, and gives me more information to advise on cropping plans.
Has helped monitor the current seasons’ rainfall and contributed to management decisions based on current situation and seasonal forecast.
Broader understanding of actual season progress across client base.
It shows the historical data and current data quickly and in an easy to present manner. Great for presentations.
0 20 40 60 80 100
Planting decisions Fertiliser application
A word frequency representation of the main reasons provided by Advisors for using the CliMate app is provided in Figure 3.3, showing a focus on
‘understanding’ and including ‘reviewing’ weather and climate data and risk in their advisory and planning roles.
Figure 3.3 Word cloud for advisors - relative frequency of word mentions in user responses about CliMate.
Advisor survey respondents were using the CliMate app largely to explain
seasonal outcomes (62%) and to update their skills incorporating weather-based risks into their advice (64%) (Table 3.1). Fifty-eight percent of advisors were identifying the range of future weather possibilities for clients. Forty-six percent of advisors were establishing example scenarios using the app for the various locations they were working in – order to demonstrate or quantify risks
associated with possible future weather conditions.
Table 3.1 Advisors – reasons for using the CliMate app (n=42).
CliMate app Activity Percentage of advisor respondents
Identify future weather possibilities and quantify risks for
clients’ actual scenarios 58
Establish EXAMPLE scenarios for locations to demonstrate
and quantify seasonal risks 46
Explain seasonal outcomes based on weather data 62 Update my skills in incorporating weather-based risks in my
advice 64
Create and share location-based CliMate analyses with clients
24
Distribute example CliMate app output through email, social
media, presentations 30
Advisors were sharing CliMate app information in presentations, email or via social media (30%). Almost one quarter of all advisor respondents were sharing location-based CliMate app output, some using screenshots.
3.1.3
Farmers – use of CliMate app
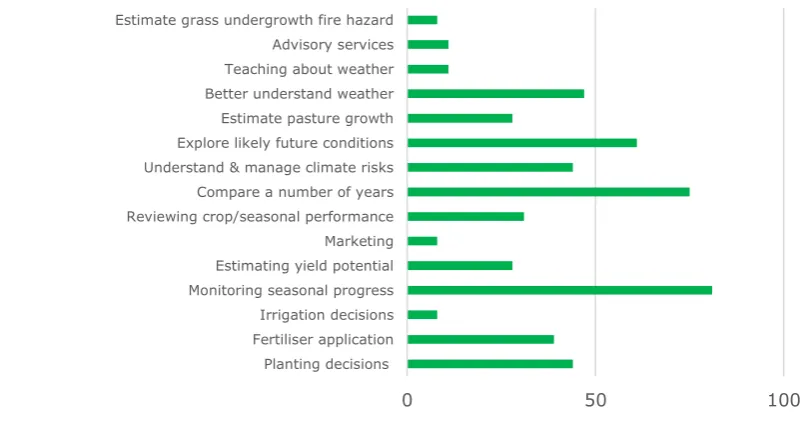
Figure 3.4 Farmers - Reasons for using CliMate app (%) (n=36)
Comments
Estimating chances of rain for planting; rainfall for August for nitrogen decisions; risk of frost and heat in crop.
It along with many other forecast models help to define seasonal forecast prediction and we use these as a guide for fertiliser applications.
I use the historical data to find patterns over a number of years, to estimate the risk of big rain events or dry periods! It seems, the longer the dry period...the bigger the rainfall event.
It’s a very intuitive app. Capable of performing analysis much quicker than excel in order to take emotion out of climatic decisions on farm.
I think summer subsoil moisture is critical in determining future cattle selling strategies. i.e. do we hold weaners over winter to sell as yearling?
To help make seasonal decisions around grapevine canopy management.
Helps determine climate risk for placing crops in different geographies.
Understanding seasons’ progress and relating to other seasons very useful. Also for comparing different sites (locations) under management.
(The CliMate app) gives me the ability to plan more, reseeding paddocks, stocking and so on.
Gives me rainfall probabilities for decision making.
When looking at buying land in other areas trying to get a reliable rainfall history.
0 50 100
Planting decisions Fertiliser application
Soundly based, structured tool to quickly get a perspective to assist decision making and general monitoring.
Become more aware of the shift and trends in climate of a period of time.
Provides a little more insight and helps build confidence around decision making.
Very useful for 12 month rolling rainfall totals and likelihood of future rainfall.
Farmer respondents indicated their reasons for using the CliMate app had a strong focus on its use in ‘decision making’ (Figure 3.5).
Figure 3.5 Word cloud for farmers - frequency of word mentions in user responses in survey
Additional data on the reasons for using CliMate by other sectors (educators, scientists and other respondents) is included for reference in Appendix 11.5.
3.2
Value of CliMate analyses
The range of analyses in the CliMate app were mostly highly valued by users. Data is presented for Advisors and Farmers.
3.2.1
Advisors – Value of CliMate app analyses
Figure 3.6 indicates that advisor respondents identified that most of the CliMate apps were ‘Useful’ or ‘Very Useful’.
How’s the Season (70% of advisors indicated this was ‘Very Useful’) and How Likely (65% indicated ‘Very Useful’) are the most valued calculations according to the advisor respondents.
How’s the Past (58% of advisors indicated ‘Very Useful’) and How Often (51% of advisors) were also highly valued.
Advisors’ least valued CliMate app was Potential Yield with only 25% of advisors indicating it as ‘Very Useful’ and 24% indicating it as ‘Useful’. Seventeen percent of advisors indicated this tool was ‘Of No Use’ and 26% indicated ‘Of some use’. A low percentage of advisor respondents (ranging from 0 to 7%) indicated they ‘Don’t know’ about particular CliMate apps.
Figure 3.6 Advisors - Value of CliMate app calculations (n=44) (%)
3.2.2
Farmers – Value of CliMate app calculations
Figure 3.7 shows that How Likely (58% found this ‘Very Useful’), How’s the Season (53% found this ‘Very Useful’), How Often (50% found this ‘Very Useful’) and How’s the Past (42% found this ‘Very Useful’) were the most valued CliMate apps for farmers. This indicates that farmers surveyed are using the app to look forward and identify probabilities and risks of weather possibilities, not just viewing the season’s progress.
When positive response data (combined percentages of ‘Of some use’, ‘Useful’ and ‘Very Useful’) were combined, most farmer users fell into this category. The exception were 19% of farmer respondents found Potential Yield ‘Of no use’, 14% found El Nino ‘Of no use’, and 11% found Drought ‘Of no use’. Further information on individual calculations is in section 5.1.
Figure 3.7 Farmers – Value of CliMate app calculations (n=36) (%)
0 10 20 30 40 50 60 70 80 How's the Season How
Often How Wet PotentialYield Drought How Hot/ Cold LikelyHow El Nino the PastHow's Trend
Of no use Of some use Useful Very useful
0 10 20 30 40 50 60 70 How's the Season How
Often How WetPotentialYield Drought How Hot/ Cold LikelyHow El Nino the PastHow's Trend
[image:27.595.78.519.522.715.2]3.3
Barriers to use of CliMate app
Although participants in this evaluation were mostly CliMate users, a small number had never used (or heard of) the app, and some had previously used Version 1. Survey respondents were all registered users of the app. They indicated that the main reason they had not used some app calculations was that they had not looked at them. Five users suggested they did not understand How Wet / N. Six respondents suggested they did not trust Potential Yield app and seven respondents indicated a lack of trust with the How’s El Nino
calculation. These findings (Table 3.2) were supported in interviews.
Table 3.2 Respondents who had not used Climate analyses indicated reasons for non-use.
Calculation Have not looked
Insufficient
Information Lack of time
Don’t
trust Don’t under stand
No
examples How’s the
Season **** ** ** ** *
How Often ***** ** ** * *
How Wet / N *****
**** * ** ** *****
Potential
Yield ***** ***** ***** ****
****** ** ****** ** *
Drought ***** ***** *****
*** *** * *
How Hot /
Cold ****** * **** ** *** * How Likely ****** * *** ** * *
How’s El
Nino ****** ***** * *** ***** ** **
How’s the Past
*** ** **** * *
Trend ****** ****** **
** **** *** * *
(n=97) (*=number of respondents)
Comments
I got on there a few times. It gives you more information that’s already happened, I’ve found that as far as a useful tool going forward it’s a bit
limited….It’s only information….You don’t base all your decision on it and if you did you wouldn’t grow a crop some years. Grain grower, VIC
We don’t get too worried about some of the funky features – soil moisture. As good as they may be, there’s too many variables that can skew the data…… We don’t use it for any futuristic stuff. Insurance industry representative (national)
CliMate is a beautiful, graphical interface. This participant suggests that the app should only include actual, historical data rather than predictive functions. Farmer, NSW
..I use DAFWA weather app. A lot of consultants and a lot of our growers use it. Extension Officer, WA
‘I’ve switched over to soilwaterapp. I used the DAFWA system, we have a network of weather stations and we can go into the site and download the monthly averages. Scientist, WA.
4
Use of CliMate and outcomes
4.1
Example user cases
A selection of examples from CliMate users (interview and survey data) is presented in Appendix 11.6. This demonstrates a range of applications within a variety of industries and locations. The tool is being used as a decision making and discussion tool in relation to planting and frost management, nitrogen application management, radiation, crop monitoring and review, fungicide spray decisions and residual herbicide management, drought management planning, feed needs and livestock sale decisions, and property purchase decisions. The examples also include insurance product pricing, education and decision support for bankers, seasonal monitoring and presentations within the mining industry, agribusiness and agricultural research planning and presentations. The app is also being used for calibrating seasons and locations within horticulture,
irrigation decisions within the grains, wine and sugar cane industries, estimating harvest dates in horticulture, and matching flowering timing for seed production. These examples are only a very small subset of the entire users. They indicate that users are developing their own specific uses for CliMate analyses and data.
4.2
Outcomes and impacts
Analysis of interview qualitative responses identified that use of the CliMate app had contributed to various impacts for users and these were validated from survey data. These included four areas of impact: (a) capacities and knowledge, (b) processes and management practices, (c) communication and engagement and (d) overall impacts. These impacts are presented and supported with survey and interview data.
4.2.1
Contribution to Capacities and knowledge
Use of the CliMate app had contributed to improving the following user capacities:
Enabled easier access to locally-relevant and simpler, historical weather data.
CliMate app users reported that the simple presentation and format of historical data had enhanced their ability to monitor weather data, review past seasons, and compare current with past seasons.
[image:30.595.140.393.181.343.2]Forty six percent of all respondents indicated that the CliMate app had enhanced their ability to monitor climate (31% indicated ’somewhat’ and 20% indicated ‘a little’). Only two percent of respondents disagreed (Figure 4.1).
Figure 4.1 CliMate enhanced capacity for better climate monitoring (%) (n=93)
Comments
To a degree. It’s one of the tools. That is the idea – have some historical
evidence at our fingertips. That’s what I like about this. There’s a whole heap of good data behind it which is easy to extract and use. I like it because it just saves me mucking around with spreadsheets with years and years of data. Grain grower, WA
Gut feels good but may not be correct. It’s good to be able to say, the risk of that is probably fairly minimal. If we say we’re sowing our wheat on 20 April but we’ve got the variety to fit that window. Being able to say, probably to an older generation of farmer that we’re pretty right, we know when it’s going to flower. The risk of a frost that time of the year is pretty minimal. It’s not to say that there is no risk, but maybe if you go back through the data, maybe there’s been one or two frosts in the period you’ve been farming. Agronomist, VIC
(I) just keep going back and having a look (at CliMate through the season). Grain grower, SA
From time to time, I look at CliMate … to see where I am. Agronomist, QLD CliMate users reported improved knowledge and understanding about seasons, weather-related risks and crop responses:
Improved knowledge
- The CliMate app assisted users to have improved knowledge of individual seasons in relation to historical weather data for their location, and of the chances and range of possible future weather scenarios.2
20
31 46
Improved climate monitoring
Better understand risks
- The CliMate app helped users to better understand the extent of risks and possible future scenarios for crops in a particular location due to weather conditions; and then assess the feasibility of management options.Understand crop responses
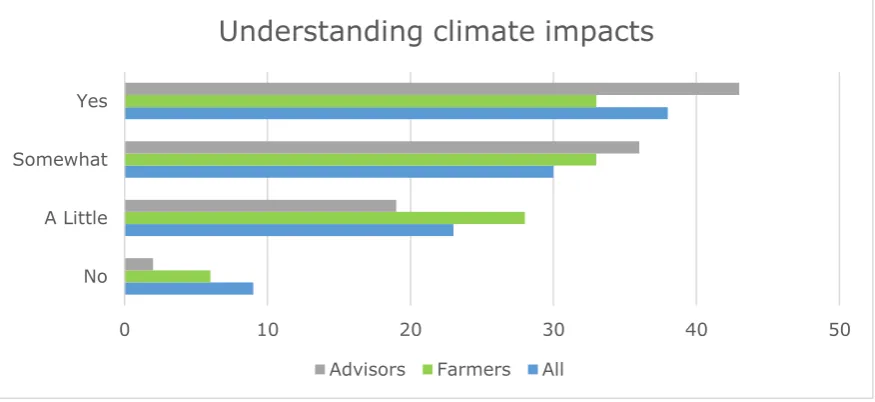
- CliMate is assisting users to improve their understanding of the extent of crop and soil responses on their farms, in relation to specific weather statistics.Survey respondents believed that using the CliMate app had improved their understanding of climate impacts on their business or decisions. Thirty-eight percent of respondents indicated ‘yes’ and 30% indicated ‘somewhat’. Forty-three percent of advisors indicated ‘yes’ and 36% indicated ‘somewhat’. The app had slightly less impact on farmers in this regard – 33% of farmers indicated ‘yes’ and 33% indicated ‘somewhat’ (Figure 4.2).
Participants described how as a resource, the Climate app helped improve their understanding of weather impacts on their decisions:
[image:31.595.79.517.361.562.2]…the confidence. Because it is an intensive trial site there is much measured, there is expectation that I know at any point in time soil water Researcher, QLD
Figure 4.2 CliMate app improved understanding of climate impacts (%) (n=97)
I like looking at how the seasons progressing, following potential trends and help explain some of the things seeing in the paddock as far as temperatures.
Advisor, QLD
I like to look at radiation – just to explain things in the paddock – mainly for grain. Last season we were sitting on the lowest sunlight we’d had for quite a while, that we could remember and it matched up with the radiation data too. It was good to be able to explain things in the paddock and why crops were doing what they were doing at a particular time. Advisor VIC
Can look at different localities weather data, and gives me more information to advise on cropping Plans, many farmers do not have the time or understanding
0 10 20 30 40 50
No A Little Somewhat Yes
Understanding climate impacts
about weather forecasting tools; as such CliMate helps me to make farmers aware of the potential risks associated with rainfall.
4.2.2
Changes to processes and management practices
The following areas summarise the contribution that use of the CliMate app had made to processes and management within agricultural businesses.
Compare seasons
- Users of the CliMate app were easily and accurately comparing the current season with previous seasons for their location, and incorporating this in decision making and review.One of the most common activities with the CliMate app is to compare current seasons with previous seasons. Eighty percent of all survey respondents were using the app for this purpose (86% of advisors and 83% of farmers), along with approximately 8% - ‘somewhat’ (Figure 4.3).
Comments
Its number one a risk management tool for me. Trying to mitigate/manage risk, even crop rotation choice. Another thing probably use (CliMate) for looking forward rather than looking back. I’m part way through the growing season… The crop might need another 60 mm of rain over the next couple of months. What is the likelihood of receiving that rainfall? What other years did we not or did we get that rain. I won’t say it’s predictive but I’m trying to get a feel of what sort of situation we’re in, what likelihood there is. Farmer, VIC
We use the CliMate app to collect current and historic rainfall data and to look at what the moisture levels are in the ground. We then use the results as part of our decision making process and pricing.. We work out our pricing partly based on the average rainfall for that area. If the actual rainfall is below or above average and if there’s any significant changes from the average, that will all affect the decision making and pricing of our product for that area. Insurance Representative
It is always good to have access to historical data. I never throw out
Figure 4.3 CliMate app is used to compare current with previous seasons (%) (n=95)
We use it in its raw form as part of our research. We found it is the single best tool that we have available to use for just measuring the status of rainfall in any area of Australia….
Its current relative to the past – gives you a bit of an indication of what the season might end up. You are really looking at it relative from an average point in time. Relative to other years at that point in time.
Best advantage is that it already does the mathematics of where the season is at any day relative to the average. That’s what we like… There’s nothing that quite tabulates it the way CliMate does it. You can do it manually but it’s across most of the base work for you. It’s an important part of our business. Insurance Representative, National
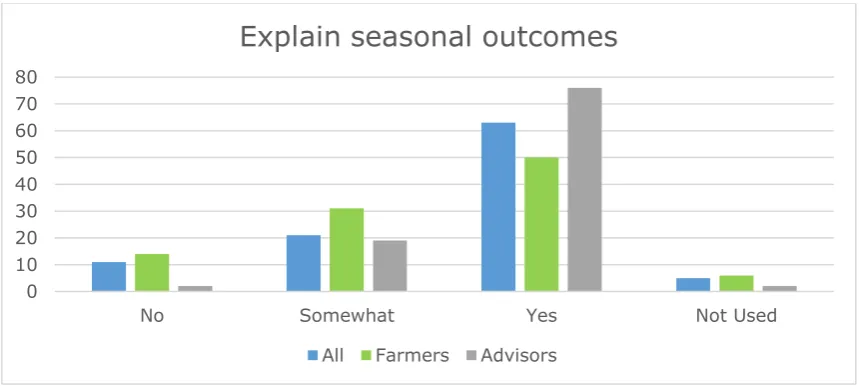
The CliMate app is being used to review the season and explain crop or pasture outcomes. Advisors were more likely to do this (76% indicated ‘yes’ and 19% indicated ‘somewhat’). Fifty percent of farmer respondents used the app to review the season (and 31% of farmer respondents indicated ‘somewhat’) (Figure 4.4).
Figure 4.4 Use CliMate app to review the season and help explain the outcome (%) 6
8
80 5
Compare seasons
No Somewhat Yes Not used
0 10 20 30 40 50 60 70 80
No Somewhat Yes Not Used
Explain seasonal outcomes
Comments
Last year…we were looking at heat sum graphs to be able to say what’s the crop doing at this stage and why is it doing it at this stage because it was so warm in April and May and this is why crops are two weeks ahead of where they should be…Radiation last year sat at the bottom of the plume for sunlight. Agronomist, VIC
The CliMate app was being used to:
Quantify the chances
of the range of possible weather scenarios for their location. Users are including this information in their business discussion, planning and decisions.Explain cropping outcomes
- CliMate users are using data to explain cropping outcomes and identify weather scenarios that may impact on production.Comments
(I can) honestly say I don’t think any two years are the same. I might say yes 8-9 years were a bit like this. Might be a little bit like 2011. It’s more like - What are the chances of getting 80 mm over the rest of the year. If it comes back and says 24% I don’t have a lot of confidence there. If it comes back and says 70-80% of years will get 80 mm for the rest of the season, I think that’s good odds, I’m happy with that. That’s sort of how I look at it. If you know your starting soil moisture, your sensitivity to risk is different from that point. If I know we’ve got heaps of soil moisture I’d be happy to take more of a chance based on what CliMate is telling me. But if I know we’re getting by on the skin of our teeth, I’ll have a look at CliMate and if it’s not giving me not a lot of confidence, I’ve got two reasons to try and be pretty conservative with my selection. Farmer, VIC This year my agronomist said we were looking at putting a second fungicide on barley. He said you could put fungicide on it. Should I or shouldn’t I? I asked. He said - You should if it’s going to be wet. Everyone’s perception of the likelihood of it being wet are different, it’s just another tool that gives you that bit of a hunch at what you think it might do as well as the weather forecast and all that you can look at previous years and the probability from now on. Farmer, SA (I used CliMate to identify) what’s the chances of getting 50 mm this winter – which is what we’ve had this year - 81% of years we’d get more than what we’ve had this year. Scientist, QLD
(The benefit of Climate is that it) just made it a lot easier simpler and quicker. You can run a whole lot of scenarios so quickly which makes it, you know you just develop a better picture. (I incorporate) data into budgets and look at extreme scenarios (working with consultant). Grain grower, QLD
Figure 4.5 Consider weather data more in decisions since using CliMate (%) (n=97)
Improving advisory services
- CliMate app has contributed to improving agribusiness advisory services.Comments
If you look at last year, how the chickpeas were progressing flowering, nothing flowered until temperature hit 15 degrees can track those trends. 2014 didn’t get any rain until March, just being able to use the app to show the seasons’ progressed - showed fallow soil water efficiencies and potential nitrate
mineralisation based on the summer as well. Just handy to show how it generally trends with the season. Agronomist, NSW
With growers talking about the season. I PARTICULARLY like comparing the seasons, all seasons, tracking this year’s rainfall vs other seasons rainfall and have a quick snapshot of how this year compares with maybe 3-5 other seasons. It’s pretty handy.
Used those just to check on our frost risk but probably used those more just to check on our periods for flowering and heat stress and relate that back to growers. Really just chances. What’s the risk?
Some advisers acknowledged that actual risk (probability) data from the CliMate app did not have the major impact on decision making, but rather was only one factor:
We try and make the best decision on the day and try and move forward. It’s only one part of the decision process. Not going to hold – because of Climate statistic. Advisor, QLD
In this environment we make a lot of our decisions based on the soil water rather than the forecast at that point. The soil water is determining most of our decisions. Advisor, NSW
Agricultural research and development
- CliMate app has contributed to facilitating agricultural research planning, processes and communications.Couple of hundred agronomists would have seen CliMate screenshots at various presentations over last few years. If there is a story to tell about soil water and
9
28
54 8
Consider weather data in decisions
saving as a photo at particular times with intent to use in presentations if the story allows. I intend to continue to use it. Researcher, QLD
Use it to tweet about it regularly – I’m advertising it all the time. People ask where did you get that information from. Consultant, WA
CliMate – pretty well just frost risk – it’s the only decisions (we’ve made based on CliMate) Development Officer, QLD
From a research point of view…I’ve found it a predictive and scenario planning tool, it is good, but retrospectively. Researcher, QLD
Data? I used the frost risk thing in a presentation for time of sowing to
agronomists and growers at GRDC updates. It’s a good visual tool to see where we should be and I overlaid our yield on top of that and it looked really pretty. Scientist, QLD
Business process and communications
- The CliMate app has contributed to facilitating other business research planning, processes and communications. Provided an education for the client team. A reference point. Justification for lending decisions. ... Was mainly wetter seasons then and showed full profile or not full and was able to indicate to the team that this area required around 75 mm of rain in order to plant (looking at it from cash flow perspective rather than new lending). Banker NSWCliMate is the location we go to to get the rainfall data. I’ve built our business around telling everyone we use CliMate data. We don’t go to BoM, we don’t go to SILO we go to CliMate version of SILO. It’s easy, you know and now there’s 100 years of history….We wouldn’t have developed our risk assessment approach if (CliMate) didn’t exist. It’s a very significant ingredient in (our business). It is an important as flour in bread…That’s how important it is for us. You won’t find a bigger advocate than us in Australia…. I’ve learnt a lot through my association with CliMate. Insurance Representative, National
4.2.3
Communication and engagement
Enhanced communication on farms
- CliMate data has enhanced communication, learning and decision making within farming businesses. Interview data indicated that farmer users were communicating within their farming business using CliMate data to help explain and justify approaches to other business members.Comments
The agronomist looks at it (CliMate), and we talk about the probably of rain events coming in the future. I’ll tell Dad what I find and he tells me what he finds. Grain grower, SA
and trying to work out if 2010 is something we should expect to have more of or less of or whatever. Farmer, WA (This farmer used CliMate for many family and friends’ locations to monitor their weather data).
Level of discussion (with farmers) goes up a level (with CliMate data) Scientist, SA
‘Gut feel (about risk)… may not be correct. It’s good to be able to say (e.g. to an older generation farmer)…we’re sowing our wheat on 20 April but we’ve got the variety to fit that window…we know when it’s going to flower. The risk of a frost that time of the year is pretty minimal’. Agronomist, VIC
Advisor-Client communications
- CliMate data has enhancedcommunications between advisors and clients and contributed to enhanced collaborative decision making.
CliMate use appeared to enhance advisor learning and the ability of advisors to communicate with their clients for improving understanding and decision
making:
Just confidence to be able to say the risk of getting a frost in this window. Having something like CliMate to say here’s your frost risk at the end of the year, it matches up with the varieties we grow and the ideal sowing times...(I incorporate CliMate data (e.g. 60 % probability) into the reports. I sometimes send the deciles screenshot through along with it. Agronomist, VIC
It’s more just about having a conversation with the growers. I just think the accuracy of all this is not good enough to base decisions on it…. General discussions about season outlooks, 3 monthly outlooks. Nothing specific. If a grower meeting, I might pull specifics out about how the season’s progressed and have a discussion about that. Agronomist, QLD
Helping the discussion – absolutely having the data, a figure to show. Agronomist, NSW
My agronomist talks to me about the probability of getting a planting rain by December. They send me the printouts. Farmer, NSW
(If I was going to a field day) I would collect data around their location, (in order to) give a presentation…During the season, (I compile and send out) a
newsletter (using our own weather tools)…but it’s good to know (I can) look at CliMate… I will use (What Trend, Potential Yield, and How Wet) I might snip a graph out and use in my newsletter. If we want additional information, I might put a link to CliMate for further information. Extension Officer, WA
Farmer group engagement
- CliMate data has enhanced local farmer group engagement through the provision of easily accessible, locally-relevant historical weather data assessments.Comments
June, once we’ve put the crop in, he will sit there again and decide will nitrogen be useful or not. Other people are using it. My private agronomist uses it too. We discuss it, where the seasons at and the likelihood of it continuing. Farmer, WA
Provides a discussion point about seasonal conditions and outlook with a group of farmers/graziers. Useful tool to discuss factors affecting climate.
Been sitting in a meeting and (someone) said we’d never get a planting
opportunity for that time of year. (Visiting agronomist) punched it into CliMate and said ‘Actually in 46% of years you would’. So in a few cases now we will look – at planting opportunities or within a window (using How Often). Development Officer, QLD
Agribusiness knowledge
- CliMate app has enhanced agribusiness knowledge and education programsAt my previous bank (non-rural bank) where the credit team had no rural experience, we used CliMate to demonstrate to the team the season’s progress so far, what moisture was in the soil and what range of possibilities the future might hold…(CliMate) enhanced my ability to communicate with this team and help to understand variations between regions – Ayr, Wagga and Moree. Banker, NSW
Knowledge is power... The more information you can get out of the website the better, for example, learning about potential yield or how wet…Management showed me areas I had not looked at yet and then we sat down and discovered other little useful areas. Insurance representative
I like looking at how the seasons progressing, following potential trends and help explain some of the things I’m seeing in the paddock as far as temperatures. Advisor, NSW
4.2.4
Overall impacts
The CliMate app has made contributions to rural businesses. Overall the impacts from use of the app are summarised in terms of the following survey
respondents’ data (Table 4.1).
Planning, decisions and advice
One quarter of survey respondents indicated that using the CliMate app had contributed to their planning with 32% indicating ‘somewhat’ and 26% indicating ‘a little’. Fourteen percent indicated no contribution to planning.
Fifty five percent of advisors indicated that the CliMate app had enabled more informed decisions or advisory services (46% of all respondents supported this and 33% of farmer respondents). Most responses were positive. Eleven percent of responses indicated no benefit.
Similarly a larger percentage of advisors believed that using the CliMate app had improved their decisions or advisory services (52%) compared with all
Table 4.1 Contribution of CliMate to planning, decisio