ANALYSE AND CLASSIFY EEG SIGNALS
A thesis Submitted by
Mohammed Abdalhadi Diykh
For the award of
Doctor of Philosophy
ii
A massive amount of biomedical time series data such as Electroencephalograph (EEG), electrocardiography (ECG), Electromyography (EMG) signals are recorded daily to monitor human performance and diagnose different brain diseases. Effectively and accurately analysing these biomedical records is considered a challenge for researchers. Developing new techniques to analyse and classify these signals can help manage, inspect and diagnose these signals.
In this thesis novel methods are proposed for EEG signals classification and analysis based on complex networks, a statistical model and spectral graph wavelet transform. Different complex networks attributes were employed and studied in this thesis to investigate the main relationship between behaviours of EEG signals and changes in networks attributes. Three types of EEG signals were investigated and analysed; sleep stages, epileptic and anaesthesia.
iii
This Thesis is the work of Mohammed Diykh except where otherwise acknowledged, with the majority of the authorship of the papers presented as a Thesis by Publication undertaken by the Student. The work is original and has not previously been submitted for any other award, except where acknowledged.
Student and supervisors signatures of endorsement are held at the University. Signed
Mohammed Diykh
Date:
Signed
Principle Supervisor
Dr. Shahab Abdulla
Signed
Associate Supervisor
iv
This section presents details of contribution by the various author for each of the paper presented in this thesis by publication. The following detail is the agreed share of contribution for candidate and co-authors in the presented publications in this thesis:
Chapter 2, Diykh et al., (2016a)
Diykh, M. & LI, Y. 2016. Complex networks approach for EEG signal sleep stages classification. Expert Systems with Applications, 63, 241-248. (Q1)
Author Percent contribution Tasks Performed
Diykh, M 70% Designed the method, simulation,
analysis, interpretation, wrote entire draft of paper
LI, Y 30% Suggested edits to manuscript,
interpretation
Chapter3, Diykh et al., (2016b)
Diykh, M., Li, Y. & Wen, P. 2016. EEG sleep stages classification based on time domain features and structural graph similarity. IEEE Transactions on Neural
Systems and Rehabilitation Engineering, 24, 1159-1168. (Q1)
Author Percent contribution Tasks Performed
Diykh, M 70% Designed the method,
simulation, analysis,
interpretation, wrote entire draft of paper.
LI, Y and Wen Peng 30% Suggested edits to manuscript,
v
Chapter4, Diykh et al., (2017)
Diykh, M., Li, Y. & Wen, P. 2017. Classify epileptic EEG signals using weighted complex networks based community structure detection. Expert Systems with
Applications, 90, 87-100. (Q1)
Author Percent contribution Tasks Performed
Diykh, M 70% Developed the method, simulation,
analysis, interpretation, wrote entire draft of paper.
LI, Y and Wen Peng 30% Suggested edits to manuscript,
interpretation
Chapter5, Diykh et al., (2018)
Diykh, M., Li Y., Wen, P. & LI, T. 2018. Complex Networks Approach for Depth of Anaesthesia Assessment. Measurement. (Q2)
Author Percent
contribution
Tasks Performed
Diykh, M 70% Developed the method, simulation
performing, analysis,
interpretation, wrote entire draft of paper,
LI, Y, Wen Peng and Li T 30% Suggested edits to manuscript, interpretation, data acquisition.
vi
detection and prevention system in a cloud environment. IEEE Access, 5, 6036-6048. (Q1).
Al-Salman, W., Li, Y., Wen, P. & Diykh, M. 2018. An efficient approach for EEG sleep spindles detection based on fractal dimension coupled with time frequency image. Biomedical Signal Processing and Control, 41, 210-221. (Q2).
vii
Acknowledgments
First of all, I would like to thank almighty Allah for his guidance and strength.
I want to express my thanks to my supervisory team Dr.Shahab and Dr.Khalid for their support and guidance.
I would like to offer my gratitude and thanks to Dr.Yan and Dr.Paul for their support,
and guidance during my PhD study. Their guidance helped me to achieve my goals in
my PhD journey.
I also want to express my personal gratitude to Sandara for proofreading my thesis.
I wish to introduce my appreciation to my honourable mother, for her support during
my PhD study. There are not enough words to describe what a powerful influence she
continues giving me.
I would like to dedicate this thesis to my Father who passed away when I was 22 years,
and also, to my beloved family who supported me through my study.
I also want to express my thanks to republic of Iraq ministry of higher education and
scientific research for supporting me.
Finally, I would like to acknowledge the support of the Australian Commonwealth
Government through the Research Training Program (RTP) Fees Offset scheme during
viii
Contents
Introduction ... 1
1.1 Human Brain ... 3
1.2 Neural system ... 4
1.3 EEG overview ... 5
1.4 Nature of EEG signals ... 8
1.5 Effects of epileptic seizures, epilepsy on EEG signals ... 10
1.6 Human sleep and EEG signals ... 12
1.7 Depth of anaesthesia (DoA) and EEG signals ... 13
1.8 Research problem hypothesis ... 15
1.9 Contribution on each chapter ... 15
1.9.1 Sleep stages classification based complex networks ... 16
1.9.2 Identifying epileptic seizures in EEG signals based on community structure detection in weighted complex network ... 17
1.9.3 Assessment of the depth of anaesthesia using spectral graph wavelet transform ... 18
2 Complex networks approach for EEG sleep classification ... 19
2.1 Diykh et a., (2016a) Complex networks approach for EEG sleep classification ... 20
2.2 Summary of results ... 29
3 EEG sleep stages classification based on time domain features and structural graph similarity ... 30
3.1 Diykh et a., (2016b) EEG sleep stages classification based on time domain features and structural graph similarity ... 31
3.2 Summary of results ... 41
ix
networks based on community structure detection ... 43
4.2 Summary of results ... 58
5 Complex networks approach for Depth of anaesthesia assessment ... 59
5.1 Diykh et a., (2018) Complex network approach for Depth of Anaesthesia assessment ... 60
5.2 Summary of Results ... 73
6 Discussion and Conclusions ... 74
6.1 EEG Sleep analysis ... 75
6.2 Epileptic seizure detection ... 76
6.4 Depth of Anaesthesia assessment ... 77
6.5 Future work ... 78
References ... 80
APPENDIX A An efficient approach for EEG sleep spindles detection based on fractal dimension coupled with time frequency image………..…….89
APPENDIX B An efficient DDoS TCP flood attack detection and prevention system in a cloud environment ……… ………101
B.I Sahi et al., (2017) An efficient DDoS TCP flood attack detection and prevention system in a cloud environment ... 101
APPENDIX C Classification of epileptic EEG signals based on simple random sampling and sequential feature selection……….… 114
APPENDIX D The simulation code to detect EEG epileptic seizures………....… 121
APPENDIX E The simulation code to analyse sleep EEG signals …………...… 136
x
List of Figures
(Excluding publication included in Chapters 2-5)
1.1 The main parts of the brain ... 2
1.2 A structure of a neuron ... 3
1.3 A neural system structure ... 4
1.4 The neurons system ... 5
1.5 An EEG signals is being recorded by Hans Berger ... 6
1.6 10/20 system electrode system ... 7
1.7 Different types of EEG rhythms ... 9
1.8 Differences between normal and epileptic EEG signals... 10
1.9 A human sleep cycle ... 11
1.10 The BIS monitoring system ... 14
xi
List of Tables
(Excluding publication included in Chapters 2-5)
1
CHAPTER 1
INTRODUCTION
The human brain is considered the command centre for the human nervous system. It is a complex network composed of billions of neurons which are capable of processing information millions of times faster and more efficiently. In recent years, much research work has been conducted to analyse human brain activity using different techniques such as electroencephalogram (EEG), Electromyography (EMG) and electrooculography (EOG) signals. EEGs are a tool commonly used to measure the electrical activity generated by the brain’s cerebral cortex nerve cells. They are measured using electrodes placed on the scalp. EEG signals record the electrical potentials generated by the nerve cells in the brain. Clinical research showed that EEG signals exhibit different patterns of waves depending on the state of a human; whether he/she is awake, asleep, anesthetized. Consequently, they are utilized as an important source for studying human brain activities and the diagnosis of several neurological diseases, such as sleep disorders, epilepsy, and monitoring depth of anaesthesia.
Although, the number of studies investigating EEG signals during sleep stages, epilepsy and anaesthesia is growing, more effort needs to be applied to improve its efficacy in terms of accuracy and time consumption (Al-Qazzaz el al., 2015; Herrera et al., 2013; Bankman et al., 1987; Henao-Idarraga). The main purpose of those studies is the analysis of EEG signals by separating EEGs into small intervals (segments). Then, the EEG segments are classified into different categories or states such as healthy and non-healthy, or to estimate the depth of anaesthesia (DoA).
2
experts or neurologists is error-prone, and requires a high cost and efforts (Kayikcioglu et al., 2015; Zhu et al., 2014; Zhang et al., 2016; Amin et al., 2016). Visual analysis is also a subjective process that means a decision made by two experts of EEG signals could be varied even for the same EEG recordings (Kemp et al., 2000; Lee et al., 2004). The demands associated with the development of accurate techniques for EEG signals analysis (to relieve the burdens of visual inspection) have intensified in the last decade. As a result, several single channel and multi-channel EEG analysis approaches have been established to computerise EEG signals analysis (Gao et al., 2016; Nguyen-Ky et al., 2013; Petsiti et al., 2015; Diykh et al., 2016a; Diykh et al., 2016b) . This focuses focus on analysing three most important types of EEG signals: epileptic, sleep and anaesthesia EEG signals. It proposes one algorithms to analyse and classify EEG sleep stages, one algorithm to detect epileptic seizures and one algorithm to monitor the depth of anaesthesia in EEG signals.
The proposed algorithm can detect and analyse the abnormalities in EEG signals as well as classify them into different categories. The proposed algorithms will be useful for identifying brain disorders and accurately monitoring a patient’s state during surgery. The outcomes of this study will help doctors and neurologists in the diagnosis and treatment of brain disorders, and for clinical research.
3
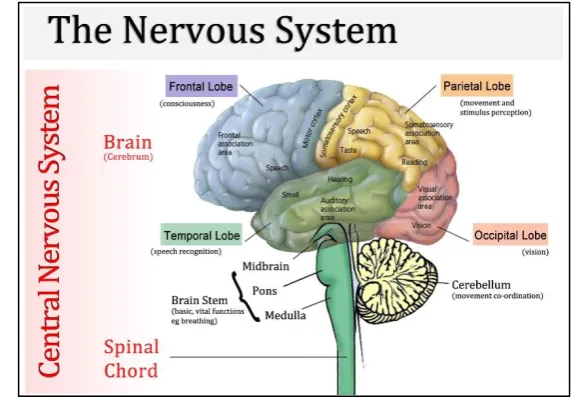
The brain is one of the most complex parts of the human body. It controls on the human nervous system. It receives commands from sensor organs and sends the output to neurons. The human brain consists of three main parts: cerebrum, cerebellum and brainstem, as illustrated in Fig1.1. A brief explanation of each part of the brain is presented below (Carlson, 2002).
The cerebrum is the most important part of the brain. It consists of right and left hemispheres. It performs the most important functions of the brain such as interpreting, thinking, speech emotions and body control. Each hemisphere is divided into four parts called lobes: the frontal lobe, partietal lobe, occipital lobe and temporal lobe. Each Lobe is associated with some functions; for example, the frontal lobe is associated with personality, speech and problem solving (Carlson, 2002, Purves et al., 2006).
The cerebellum is similar to the cerebrum in structure as it has two hemispheres, and it has a folded cortex. It is located in the area under the cerebrum. It is responsible for the control of muscle movement, balance and posture.
The brain stem is located underneath the limbic system. It works as a bridge to connect the spinal cord with the cerebrum. It is associated with the most important life functions such as breathing, mouth movement and consciousness. It is made of the pons, medulla and midbrain.
4
The brain is one of the most complex parts of the human body (Carlson, 2002, Purves et al., 2006). It consists of billions of neurons which maintain the electrical charge of the brain. A neuron consists of three main parts: cell nucleus, dendrites and long axon (Carlson, 2002, Purves et al., 2006). Figure 1.2 shows a structure of a neuron. Each part of a neuron is responsible for a specific task. The dendrite is a short-branched section which is located at the end of each cell. It consists of many receptors that receive a neurotransmitter from other cells. The long axon transmits the signal from one cell to another. The cell nucleus is the core of the cell providing the cells with instructions by which the cell takes an action.
Neurons form the main unit of the neural system. The neural system is responsible for three main functions: sensory input, integration and motor output. Figure 1.3 depicts the structure of the neural system. The sensory input recognises and monitors the environment and the changes happing with the human body. It describes responses in the skin, eyes, ears and nose (which are considered sense organs), when they receive stimuli. In the integration stage, the central nervous system (CNS), which is formed by the brain and spinal cord, manipulates the information received by sensory input and makes decisions. During motor output, the CNS sends a command to effector organs which could be a muscle or gland.
5
code. The brain is in control of most functions in the body including speech, memory, and thoughts. The brain is connected to the spinal cord through the brainstem. Figure 1.4 illustrates the nervous system structure. The spinal cord transfers signals between the brain and the body. As the CNS controls all body function, any dysfunctions in the spinal cord can disrupt the exchange of information between the body and the brain. Different lines of defences such as bones, spinal column protect the CNS from injury. In addition, a fluid between the bones absorbs shock and prevent damage to the CNS.
1.3 EEG Overview
[image:17.595.146.436.252.452.2]The brain consists of two main cells called neurons or nerve cells, and glia which together form the brain tissue (Ramada n et al., 2015; Holmes et al., 2007; Mellinger et al., 2007). The brain tissue is surrounded by a cerebrospinal fluid (CSF) which protects the brain from injuries and strikes. CSF is an aqueous medium for salts of potassium, calcium and magnesium that play an important role in the function of the CNS. The brain tissue and neurons are connected through long cables called axons. These axons spread an electrical signal between the brain neurons and tissue in a non-attenuating manner. When electrical signals are reached, the area where neurons are connected, new axons called dendrites receive those signals. The dendrites are different from axons as they do not have insulating metrical needed for fast spike propagation.
6
activity (Rao et al., 2012; Van Erp et al., 2012; Felton et al., 2007). Generally, electrodes are placed on the surface of the brain, and can easily record both spikes and synaptic currents.
The cerebral cortex nerve cells of the brain generate variety of electrical brain activities which are recorded as EEG signals. EEG signals were first recorded in 1875 by Caton in 1875 (Collura 1993; Morshed et al., 2014; Lindsley et al., 1936; Loomis et al., 1935). He was able to record electrical activity from the brains of animals and his work was considered to be the first work to deal with brain activity. The study was conducted with over 40 cats, monkeys and rabbits. In this study, Caton observed variations in brain signals associated with different states such as, a sleep, wakefulness and anaesthesia. In 1924, Hans Berger from the University of Jena in Austria, recorded the first human EEG recordings from a 17 year old boy while he was undergoing a surgery to remove a suspected tumour (Millett et al., 2001; Gloor et al., 1994; Kiernan 1886). Figure 1.5 shows the first EEG recording.
Metal strips and a sensitive galvanometer were used as electrodes and recording instruments. In this, irregular and relatively small electrical potentials (i.e., 50 to 100 µV) were observed in the patient’s recording.
However, with the developments in the digital technologies, EEG recording systems became more sophisticated. Different types of metal electrodes made from tin, gold platinum or silver, were designed to detect brain signals (Geddes et al., 2003; Tallgren
Patient during recording EEG signals
Hans Berger
An EEG recording
7
potentials produced by the brain neurons.
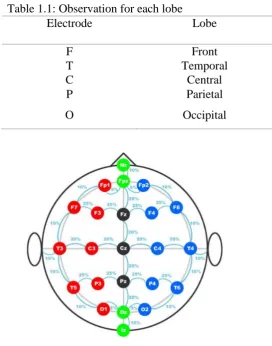
The standard system for recording the brain activity is called the 10/20 system (Teplan et al., 2002; Nicolas-Alonso et al., 2012; Mason et al., 2003). It is an international system which describes the locations of electrodes on the scalp. The 10/20 system was designed based on the relationships between the location of an electrode and the underlying area of the cerebral cortex. The numbers 10 and 20 come from the distance between each pair of electrodes that is either 10% or 20% of the total left-right or front-back of the human skull. Each one of those electrodes has a unique number and letter to identify lobe and hemisphere location respectively. Table 1.1 gives a short explanation of those locations.
[image:19.595.181.454.333.680.2]The electrodes are placed onto different locations of the scalp’s surface. The location depends on the type of signals targeted. Each electrode is associated with an amplifier
Table 1.1: Observation for each lobe
Electrode Lobe
F Front
T Temporal
C Central
P Parietal
O Occipital
8
the scalp.
The acquired EEG signals are transferred into waves form by a computer. The number of possible electrodes that can be used to obtain signals is from 1 to 512 electrodes. These electrodes depend on the scalp location targeted and the required signals. Clinical research has shown that a multi-channel EEG signal can be obtained by employing more than one pair of electrodes while a single channel signal can be recorded using one pair of electrodes. Four forehead electrodes are mostly involved in recording anaesthesia EEG data.
To record sleep EEG signals, the electrodes Fpz-Cz / Pz-Oz are mainly used in recording EEG signals. However, an alternative electrode placement such as C4-A1/ C3-A2 may sometimes be employed. For epileptic EEG signals, most of clinical studies use all the electrodes to record EEG signals (Fonseca et al., 2007; Klimesch et al., 1997; Klem et al., 1999; Kauhanen et al., 2006).
1.4 Nature of EEG Signals
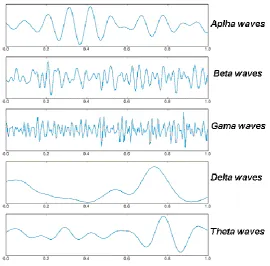
EEG signal are mainly described using two terms of rhythmic activities and transients (Thut et al., 2012; Wang et al., 2010; Schnitzler et al., 2005; Zaehle et al., 2010). The rhythmic activities are classified into different bands based on frequency using a spectral method such as a wavelet transform or Welch. Most brain activities fall in the range of 1-20 Hz. Based on biometric research, the frequency bands are divided into different sub-bands including Delta, Alpha, Theta, Beta, Gamma and Mu rhythm (Liu et al., 2005; Vaughan et al., 1996; Wolpaw et al., 2000).
Delta: the frequency range of alpha activity laies between the range of 0.5-4 Hz with a highest amplitude and lowest waves. These type of waves are associated with deep sleep, awake stages and in some cases of brain disorder.
Theta: the frequency range of theta activity is between 4-8 Hz with an amplitude up to 20 μV. It is normally observed in young children and during drowsiness in adults.
Theta activity increases in EEG signals during emotional states such as stress, frustration and disappointment.
Alpha: is in the frequency range of 8-13 Hz with amplitude of 30-50 μV. This range of frequency appears in the posterior region of the head on the both sides. This type of
9
eyes and is in a state of relaxation.
Beta: the frequency range of beta is between 13-30Hz. It is recorded from both sides of the frontal area with low amplitude and varying frequencies. This type of activity appears with motor behaviours and during active movements.
Gama: it appears during cognitive and motor functions. The frequency range of the gama activity is 30Hz and up.
EEG signals exhibit different features and patterns such as sleep spindles, k-complexes during sleep stages, spike, and sharp waves during epileptic seizures. These patterns are transients rather than rhythmic. Detecting them is much harder than detecting rhythmic activities.
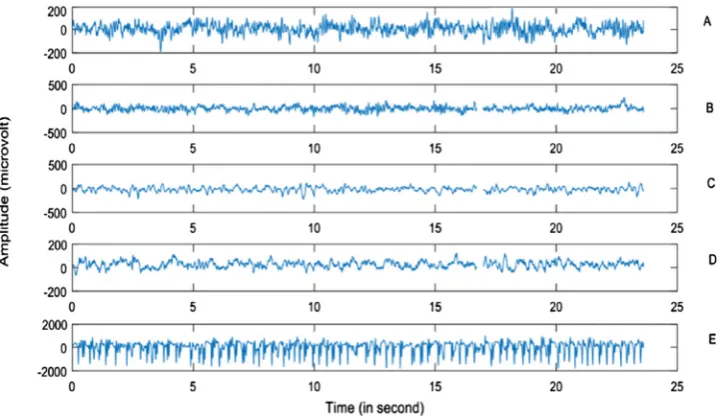
[image:21.595.172.443.130.396.2]As mentioned previously, this thesis focuses on developing robust algorithms to analyse and classify three types of EEG signals: epileptic, sleep and anaesthesia EEG signals. The following section provides a brief explanation for each of these signals and how they affect human brain nerves.
10
Epilepsy is a chronic neurologic disorders characterized by recurrent unprovoked and seizures. It affects more than 40 million people around the world; most of them young children and older adults. Developing countries contribute about 85% of epilepsy cases. Several clinical studies have shown that epilepsy can be caused by interactions between several genes and environmental factors. However, people how suffering a brain damage, stroke, toxicity and high fever can endure epileptic seizures. During an epileptic seizure, the brain neurons discharge suddenly, and abnormal activities occur within the cerebellum and cortex. Figure 1.8 shows differences between normal and epileptic EEG signals. A seizure usually lasts about two minute or less depending on the age of the patient and the health of the brain.
Epileptic seizures are classified into two different categories; partial and generalized seizures. The partial seizure effects a particular part of brain while the generalized seizure involves the entire brain. During strong seizures patients can lose consciousness for several minutes and cannot recall what has happened. Epileptic seizures can be controlled by medications and in some severe cases surgery can be a solution. However, challenges remain in curing all epilepsy patients as medication can control only 50-60% of cases.
[image:22.595.215.388.465.655.2]The EEG is a common and widely used tool employed to look at the electrical activity of the brain and the functioning of brain neurons. An abnormality in brain activity can
11
and close eyes. The advantage of EEG tests is that they enable neurologists and experts to determine what happened during seizure attacks and to compare this with normal EEG recordings. Developing accurate techniques to detect epileptic seizures in EEG signals is vital. In this thesis, a robust methodology is developed to detect the abnormalities in patients’ EEG recordings, thus, helping neurologists with early seizure detection.
1.6 Human Sleep and Sleep EEG Signals
Sleep is a dynamic process involving two main stages: rapid eye movement (REM) and non-rapid eye movement (NREM) (Giri et al., 2015; Lanjnef et al., 2015; Lee et al., 2004). The later includes four stages: Stage 1 (S1), Stage 2 (S2), Stage 3 (S3), and Stages 4 (S4). Figure 1.9 shows a normal sleep cycle.
These individual sleep stages are connected through different physiological and neuronal characteristics that are used in sleep identification by experts and researchers. The process of visually discriminating between sleep stages is called sleep scoring or sleep staging. Sleep scoring is normally carried out visually by experts with reference to either the Rechtschaffen, and Kales (R&K) (Rechtschaffen et al., 1968), or the American Academy of Sleep Medicine’s (AASM) (Berry et al., 2012) guidelines. The R&K guidelines divide sleep recordings into seven different stages namely: awake (AWA), S1, S2, S3, S4, REM and movement time. The R&K guidelines have been used as the standard for sleep scoring for the last 40 years. It has received much
12
variability in the visual evaluation of sleep stages occurring. In 2007, the AASM guidelines were modified to address some issues in the R&K guidelines. In the AASM guidelines the allocated time for S1 and SWS were changed, and a minimum of three EEG derivations including F4-M1, C4- M1, and O2-M1 from the frontal, central, and occipital regions are recorded. The AASM combines S3 and S4 into one stage, and also considers body movement as a sleep stage.
Stage 3 (S3) and Stage 4 (S4) are considered to be deep sleep that occurs in the first half of the night. During these stages, the human body starts to release hormones that restore muscles damaged from stress and fatigues. Therefore, one is not easily wakened during these sleep stages. These two sleep stages are categorised as slow wave sleep, and the corresponding EEG waves have high amplitudes. The human brain produces similar waves during S3 and S4, and 50% of these are delta waves making it difficult to distinguish them.
The REM stage is associated with a unique brain wave pattern, and the brain waves exhibit a combination of alpha, beta, and de-synchronised waves. During the REM stage, the skeletal muscles are effectively paralysed and breathing becomes more rapid, irregular and slow. During this stage, waking can easily happen and dreams can be remembered if the waking period is too long.
During the AWA stage brain waves become slower, and more synchronous, with an increased amplitude. Thus, EEGs during REM and AWA exhibit different characteristics making the separation of these stages more accurate. The brain waves during S1 transit from unsynchronized beta (12-30Hz) and gamma (25-100Hz) waves to more synchronised beta and gamma waves. During this stage, blood pressure and brain temperature fall. The range of theta waves during S2 are similar to those in S1, and the blood pressure also fall. The main differences between S1 and S2 are that the brain waves during S2 pass through two distinguishing phenomena: sleep spindles and K-complexes. Sleep spindles are defined as short bursts of brain activity in the range of 12-14 Hz for about half a second, while K-complexes exhibit short negative high voltage peaks followed by slower positive complexes.
13
signal into different sleep stages.
1.7 Depth of Anaesthesia and EEG Signals
Monitoring depth of anaesthesia (DoA) during surgical operations is an going challenge. Developing an accurate index of the DoA helps correctly deliver anaesthesia agents to patients, reduces the costs associated with anaesthesia medication and prevents unintended intraoperative awareness. The majority of the devices used to assess DoA are based on clinical signs such as heart rate, blood pressure and sweating. These signs cannot estimate the DoA precisely, and are not reliable. The use of some types of anaesthesia medications, such as muscle relaxants, can make the interpretation of these signs difficult. Clinical research has revealed that abnormalities in these signs are not always present for patients who endure awareness during surgery.
The clinical studies show that, after applying an anaesthesia medication to a patient, the drug targets the central nervous system (CNS) where EEG signals are generated. During anaesthesia, EEG signals patterns change. As long as the level of anaesthesia changes, the amplitude and frequency of EEGs fluctuate rapidly and exhibit changes of the anaesthesia depth. This is the main reasons for the wide use of EEG signals to monitor DoA. As a result, many of the devices developed to monitor DoA are based on EEG signals.
One of these devices, the Bispectral index (BIS) is the most popular. Figure 1.10 illustrates the BIS monitoring system used to assess DoA. The BIS is a complex EEG parameter designed using a combination of power spectrum analysis and time domain analysis. The values of the BIS are between 0 and 100, and change over time. Figure 1.11 shows the BIS index range.
14
In 1992, the BIS was designed by Aspect Medical Systems and it was approved by the Food and Drug Administration as a measure of the depth of anaesthesia induced by sedatives and hypnotics in 1996.
[image:26.595.233.391.327.538.2]Although the BIS has been used as a standard device to monitor DoA, it has received much criticism such as being delayed, not robust with different medications, and not sufficiently accurate across patients. However, developing an accurate index to monitor DoA is important for the delivery of an accurate amount of medication to patients and helping anaesthesiologists trace the patient’s anaesthesia state during
Figure 1.10: The BIS monitoring system (Yeung et al., 2010)
15
anaesthesia state of patients. A statistical model and spectral graph wavelet transform (SGWT) are used to monitor DoA. The results demonstrate that the new index has a high potential to monitor DoA.
1.8 Research Problems and Hypothesis
The main goals of this thesis are to develop novel approaches to discover the human brain and to find out more efficient methods of identifying brain disorders using EEG signals. The performance of the developed methods are compared with their counterparts in time, frequency and hybrid domains. Three types of EEG data are analysed and studied: sleep, epileptic and anaesthesia EEGs. Undirected complex networks, and weighted undirected complex networks are used to analyse epileptic and sleep EEGs. Anaesthesia EEG signals are analysed using spectral graphs wavelet transform. The objectives are as follow:
1. How to efficiently classify EEG sleep stages based on time domain features and undirected complex networks attributes.
2. How to apply community detection algorithms in weighted networks to identify epileptic seizure in multi channels EEG signals.
3. How to assess depth of anaesthesia based on the spectral graph wavelet transform.
The hypothesis is that classification and analysis of EEG signals can be improved using complex networks characteristics. Based on simulation results, complex networks characteristics exhibit different characteristics when they are evaluated from various EEG signals such as sleep, epileptic and anaesthesia EEG signals.
1.9 Contribution of Each Chapter
16
experiments. The following contribution are proposed:
1. Development of a structural graph similarity combined with k-means approach to classify and identifying EEG sleep stages using undirected complex networks coupled with time frequent features.
2. Improvement of developed method in No.1 by investigating new complex networks attributes that can improve the classification accuracy of EEG sleep stages.
3. Detection and classification of epileptic seizures in EEG signals based on community detection in weighted complex networks.
4. Implementation of spectral graph wavelet transform to assess the DoA. These algorithms are entered into Matlab R2013b, and Spectral Graph Wavelet Transform Toolbox1 and Matlab Tool for Network Analysis2 are used in designing algorithms. Each algorithm is simulated and evaluated using different EEG signals acquired from different channels. A brief discussion of these four contributions is provided below.
1.9.1 Sleep stages classification based on complex networks
A robust approach based on time domain features and complex network attributes to score EEG sleep stages has been designed. First, sleep EEG signals are segmented into 30 second epochs. Each 30 second epoch is further divided into 75 sub-segments using a proposed segmentation technique. Different sets of statistical features including six, nine and twelve features set, are extracted and investigated from each sub-segment. As a result, each EEG segment is represented by a vector of statistical features. The resulting vector of statistical features is then mapped into an undirected complex network. The results showed that twelve features set gives a high classification accuracy than other sets. In this method, two networks attributes of (Jaccard coefficients, and average degree) are extracted and fed to a classifier. The relationships between graphs behaviours and time domain features are investigated through complex networks. Experimental results show that complex networks constructed
1 http://wiki.epfl.ch/sgwt
17
stages.
To increase the accuracy of the EEG sleep stages classification and improve the proposed method, new structural network attributes are investigated and used in a new study. In this study, the same methodology is used. However, different EEG datasets acquired from different EEG channels, Pz-Oz and c3-A1, are used to assess the proposed method with different EEG data.
The degree distribution and clustering coefficients as well as Jaccard coefficients are extracted from each complex network and forwarded to different machine learning algorithms. The network attributes are extensively investigated. The obtained results show that the new complex network attributes increased the classification accuracy and effectively discriminated between the EEG sleep stages compared with the Jaccard coefficients and average degree.
1.9.2 Identifying epileptic seizure in EEG signals based on community structure
detection in weighted complex networks
18
1.9.3 Assessment the depth of anaesthesia using spectral graph wavelet transform
Anaesthesia EEG signals are also studied and investigated using a statistical model and spectral graph wavelet transform (SGWT). Based on previous studies, it was found that using complex networks could reveal the hidden patterns in EEG signals. In the developed method, the de-noised EEG signals are partitioned into segments using a sliding window technique, each segment is then divided into sub-blocks to make the signal quasi stationary. A set of 10 features is extracted from each block to construct a vector of statistical features. Each vector of statistical features is mapped into a weighted complex network. Then the graph wavelet transform is applied. The total energy of wavelet coefficients at scale 3 is used to form an index to monitor the depth of anaesthesia. As a result, a new index called SGWTDoAis designed and
evaluated using the EEG recordings and bispectral (BIS) from 22 subjects. The proposed index is evaluated and tested using different statistical metrics such as Bland-Altman, regression, Q-Q plot and Pearson correlation. The results demonstrated that the SGWTDoA reflects the transition from unconsciousness to consciousness efficiently.
19
CHAPTER 2
COMPLEX NETWORKS APPROACH FOR EEG SLEEP
CLASSIFCIATION
Sleep disorders have a severe effect on the health and quality of human life. Sleep scoring plays an important part in the diagnosis of sleep disorders such as apnea insomnia. To relieve the burdens (e.g. high cost and human error) of visual inspection, a number of automated sleep staging techniques have been developed (Zhu et al., 2014).
Dimension reduction and features extraction are the most commonly used core steps in the development of sleep staging techniques. Computation speed and the quality of the classification results are dependent on how those steps are efficiently undertaken. The majority of sleep scoring methods have been developed under one of the major four domains: time, frequency, graph and hybrid domains (Uğuz, H. 2012); Fraiwan et al. 2010; Şen el al., 2014; Zhu et al., 2014).
According to previous research, graph models provide a simple and popular way to study human brain functions. They have been used as a useful and efficient tool for the investigation of brain disorders such as hyperactivity disorder and Alzheimer Disease.
20
network attributes based on time domain features were used to identify the six sleep stages. Two graph attributes were investigated including average degree and Jaccard coefficients. One of the important findings of this research paper is that combining time and graph domains to identify sleep stages achieved a high classification accuracy. The paper’s results also show that using degree and Jaccard coefficients
together also improves classification accuracy. An average sensitivity and accuracy of 91% and 92% was obtained respectively when these graph’s attrivutes were used togather. To compare the proposed method with the SVM, the extracted time domain features were forwared to the proposed method as well as to the SVM. The kernel function of SVM used in this experiment was RBF. To investigate the performance of the SVM, different kernel functions were tested, and it found that the RBF gave a high classification rate than other kernel functions
We followed the same methodology in both Chapter 2 and Chapter 3, however, the main differences between them are that in Chapter 3 new network’s attributes are
investigated and used to identify EEG sleep stages. It is noticed that the performance of the proposed model is improved significantly. In addition, extensive simulations and experiments are made to explorer the relationship between time domain features and networks behaviours. Also, two datasets, which were acquired from two different EEG channels, were utilized to examine the quality of the proposed method.
2.1 Diykh et al.,(2016)” COMPLEX NETWORK APPROACH FOR EEG SLEEP STAGES CLASSIFCIATION”
Contents lists available at ScienceDirect
Expert
Systems
With
Applications
journal homepage: www.elsevier.com/locate/eswa
Complex
networks
approach
for
EEG
signal
sleep
stages
classification
Mohammed Diykh ∗, Yan Li
SchoolofAgricultural,ComputationalandEnvironmentalSciences,UniversityofSouthernQueensland,Australia
a rt i c l e i n f o
Articlehistory: Received11March2016 Revised28June2016 Accepted1July2016 Availableonline5July2016
Keywords:
Electroencephalography Complexnetworks Sleepstages Statisticalfeatures
a b s t r a c t
Sleepstagescoringisachallengingtask.Mostofexistingsleepstageclassificationapproaches relyon
analysingelectroencephalography(EEG)signalsintimeorfrequencydomain.AnoveltechniqueforEEG
sleepstagesclassificationisproposedinthispaper.Thestatisticalfeaturesandthesimilaritiesofcomplex
networksareusedtoclassifysinglechannelEEGsignalsintosixsleepstages.Firstly,eachEEGsegment
of30sisdividedinto75 sub-segments,and thendifferentstatisticalfeaturesareextractedfromeach
sub-segment.Inthispaper,featureextractionisimportanttoreducedimensionalityofEEGdataandthe
processingtimeinclassificationstage.Secondly,eachvectoroftheextractedfeatures,whichrepresents
oneEEGsegment,istransferredintoacomplexnetwork.Thirdly, thesimilaritypropertiesofthe
com-plexnetworksareextractedandclassifiedintooneofthesixsleepstagesusingak-meansclassifier.For
furtherinvestigation,inthe statisticalfeaturesextraction phasetwo statisticalfeatures setsaretested
andrankedbasedontheperformanceofthecomplexnetworks.Toinvestigatetheclassificationability
ofcomplexnetworks combinedwithk-means,theextracted statisticalfeatureswerealsoforwardedto
ak-meansandasupportvectormachine(SVM)forcomparison.Wealsocomparetheproposedmethod
withotherexistingmethodsintheliterature.Theexperimentalresultsshowthattheproposedmethod
attainsbetterclassificationresults andareasonableexecution timecomparedwith theSVM, k-means
andtheotherexistingmethods.Theresearchresultsinthispaperindicatethattheproposedmethodcan
assistneurologistsandsleepspecialistsindiagnosingandmonitoringsleepdisorders.
© 2016 Elsevier Ltd. All rights reserved.
1. Introduction
Sleepisan importantphysiologicalactivitywhichplays a cru-cialroleinself-repairingandself-recoveryforhumanbody.Itisa cyclicprocess that involves various stagesregulated by a specific system(Šušmáková &Krakovská,2008). Monitoringandanalysing sleepareveryimportanttohumanhealth.
RechtschaffenandKales (1968)suggesteda newsleepscoring visualinspectionmethodaccordingtothechangeinthe physiolog-icalsignals.Thismethodhasbeenusedforsleepstagingforabout 40years.Based ontheR&K,an overnightsleepispartitionedinto 20–30ssegmentsandEEG-rhythmswithotherparametersare cal-culatedforeach segment individually.The resultsare interpreted andeachsegmentisclassifiedintooneoftheseven sleepstages: awake,rapideyemovementsleep(REM),fournon-rapideye move-ment(NREM)numberedfrom1to4andbodymovementstage.In 2007, AmericanAcademy of SleepMedicine (AASM) released the sleep scoring criteria(Iber, Ancoli-Israel, Chesson, & Quan, 2007) wherethesleepstagesare dividedintofivestages.Themain
dif-∗ Correspondingauthor.
E-mailaddresses:[email protected] (M.Diykh),[email protected] (Y.Li).
ferencesbetweentheR&KandtheAASMarethatthebody move-mentstageisconsideredasonesleeporawakestageintheAASM. Furthermore,the NREM3and NREM4are combined intoa single sleep stage in the AASM criteria. However, using thesemethods forsleepscoringisconsideredtimeconsumingandalsoitisprone tohuman errors(Guo,Rivero, Seoane,& Pazos,2009; ¸Sen, Peker, Çavu¸so˘glu,&Çelebi,2014;Zhu,Li,&Wen,2014).Toovercomethe tediousofthesemethods, manyautomaticapproaches havebeen developedtoclassifysleepstages.
Numerous research on developing automatic sleep classifica-tionmethodsuse EEG,Electrooculography (EOG)and Electromyo-graphy (EMG) signals (Bajaj & Pachori. 2013; Ishizaki, Shinba, Mugishima,Haraguchi& Inoue,2008; Micheloyannisetal., 2006; ¸Sen et al., 2014; Van Straaten & Stam 2013; Zoubek, Charbon-nier,Lesecq, Buguet,& Chapotot,2007). Differenttechniquessuch as support vector machines (SVMs), neural networks and fuzzy systems have been developed to classify sleep stages (Adnane, Jiang, & Yan, 2012; Fang & Wang 2014;Güne¸s, Dursun, Polat, & Yosunkaya, 2011; Uguz, 2012). Most of EEG research aiming at sleep stages classification consist of two phases: (i) features ex-traction from EEG data, (ii) categorisation of the extracted fea-turesusing aclassification method.These research strodean im-portant step to develop sleep scoring techniques. However,
ter decades of investigations, many problems still need to be solved. Improvingthe accuracy of classification andreducing the complexitytime aretwo main challengesin sleepstages classifi-cation (Xiao, Yan, Song, Yang, & Yang, 2013). Further exploration onemployingmoreeffectivefeaturesextractionandclassification methodsshouldbemadetoimproveclassificationperformance.
Overthelastdecade,therehasbeenagrowinginterestinusing complexnetworkstoanalysedifferenttimeseries,suchas biomed-icaland brainsignals. (Ahmadlou, Adeli & Adeli, 2012;Liu, Zhou &Yuan,2010;Panzica,Varotto,Rotondi,Spreafico,&Franceschetti, 2013;Xu, Zhang & Small, 2008; Zhu et al.2014) analysed sleep stagesbased onvisibilitygraphs. ZhangandSmall(2006)studied behavioursofhumanspeechandelectrocardiogram(ECG)time se-riesusingcomplexnetworks. Acomplexnetwork isa mathemat-icalmodelwithrelationalinformationthatcan bedescribedbya graph.Graphtheoryprovidesamethodtocapturethetopologyof anetworkandtoextractthemaincharacteristicsacrossnetworks whichcan helpbetter understandthe relationshipsbetween net-works.
In thisstudy, an automatic sleepclassification methodis pro-posed,whichemploysstatisticalfeatures,complexnetworksanda classifier forclassifying an EEG signal into six sleepstages. Each segmentof30s EEGdata wasdivided into75sub-segments.The numberofsub-segmentswasempiricallydetermined.Thena vec-tor of statistical features was extracted from each segment and mappedintoa complexnetwork. Theaverage degreeandJaccard similaritycoefficientsofeachcomplexnetworkwereextractedand fedtoak-meansclassifier.
Twosetsofstatisticalfeatureswereextracted,andevaluatedin ordertoexplorebest representativefeatures foreachsleepstage, andtofigureouttherelationshipsbetweenstatisticalfeaturesand networkproperties.Thestatisticalfeatures were rankedandthen sorted in descending order based on the accuracy achieved for eachfeature.Thefirstbestnineandtwelvefeatureswereselected asthekeyfeaturesfortheexperimentsinthiswork.
The restofthepaperisorganizedasfollows:inSection2,we describe the prior studies in EEG signals classification. Section 3
depictsthe datasets used in this paper. Section 4 illustrates the methodologyoftheproposedmethod.Section5discussesthe ex-perimentalresults.Finally,Section 6drawstheconclusionforthis paper.
2. Relatedwork
AutomaticEEGsleepstagesclassificationisahardandcomplex problemthatrequireseffectivesolutions atdifferentlevelsofEEG processing,fromthesegmentation,theextractionandtheselection offeatures,toclassification.Thissectionprovidesabriefsummary ofdifferenttechniques.
The WaveletandFouriertransformshavebeenwidely utilized inEEG sleepstages classification. Guo et al.(2009) used a rela-tive waveletenergyto analyse epilepticEEG signals.The wavelet coefficients were extracted and forwarded to an artificial neural network. The method attained a 95% classification accuracy. Jo, Park,Lee,An,andYoo(2010)classifiedsleepstagesusingEEG sig-nalsbased on agenetic algorithm anda fuzzyclassifier.The fast Fouriertransformwitha hanning window wasutilized toobtain apowerspectrumfromthebandwidths(delta,theta,alpha,sigma, andbeta).Thefuzzyclassifiercombinedwiththegeneticalgorithm wasusedto classify the spectral features. Theirmethod was im-plemented with four EEG recordings, which were obtained from four healthy youths between 27 and 29 years old. The method achievedan 84.6%classification accuracy.Doroshenkov, Konyshev, andSelishchev(2007)identified EEGsleepstagesbasedona hid-denMarkovmodel(HMM).EachrowofanEEGsignalwas decom-posedusing a fastFouriertransform filter.Various features were
extractedandthenclassifiedbased ontheHMM.The researchers usedthePhysioNetinternationaldatasettoimplementthemethod. Theaverageaccuraciesof88%and74%forREM,awakeandstage1 wereachieved,respectively.
More recently, visibility graphs have been employed to iden-tifysleepstages.Zhuetal.(2014)utilizedtheconceptsofvisibility graphsandhorizontalvisibilitygraphstoextractthefeaturesfrom singlechannel EEGsignals.The differentgraph featureswere ex-tracted,andthenwere forwardedtoa supportvectormachine to classifythesixsleepstages.Thedatasetusedintheresearch was fromtheSleep-EDF database(Europedataformat).An averageof 87% classification accuracy was obtained. Shi et al.(2015) devel-oped multi-channelEEGsleepstagesclassificationmethod.A col-laborative representationmodel was utilized to develop a multi-learning algorithm. A k-means classifier and dictionary learning methodwereemployedinclassificationphase.
However, other studies havebeen tried toemploy hybrid fea-turesinsleepstagesdistinguishing.Herreraetal.(2013)extracted differentcombinationsofEEGfeatures byusing differentfeatures extractionmethods,suchaswavelettransform, Hjorthparameters andsymbolic representation.The extractedfeatures were ranked using a normalized mutual information extraction and fed to a SVM machine. Furthermore, the classification results were im-proved by applying a stacked sequential learning approach. ¸Sen etal.(2014)madeacomparativestudyonsleepclassificationusing differentfeatureselectionandclassificationmethods.Fourtypesof features:timedomainfeatures,frequencyfeatures,timefrequency featuresandlinearfeatureswereextracted.Theextractedfeatures wereusedastheinputtofivedifferentclassificationalgorithms:a randomforest,afeed-forwardneuralnetwork,aSVM,aradial ba-sisfunctionneuralnetworkanddecisiontree.Theresearchers con-ductedthecomparisonbasedonthedatasetsprovidedbySt. Vin-cent’sUniversityHospitalandUniversityCollegeDublin,thesame datasetsusedinthispaper.
Fromtheliterature,oneofthelimitationsintheexisting auto-maticsleepstagesclassificationtechniquesisthatthey wereused thesamefeatures toidentifyall thesleepstages.Infact, the fea-turesrequiredforadesiredaccuracyisdifferent.Tofindmost dis-criminative features for each sleep stage, the extracted features weretestedandevaluatedinthiswork,andwefoundthatnotall sleepstages can be classifiedwiththe same numberof features. Secondly,thecurrentstudieshavebeenlimitedinclassifyingand analysingEEGdataintime orfrequencydomain.However, inthis work, we have combined the statistical features with the prop-erties ofcomplex network concept for sleepstages classification. Basedonourknowledge,thisapproachhasnotbeenusedinsleep stagesclassificationbefore.
3. EEGdata
The datasets used in this work were collected at St. Vin-cent’sUniversity HospitalandUniversity CollegeDublinfrom dif-ferent randomly selected subjectsin observations over 6 months (Goldbergeretal.,2000).
They are publically available.1 All 25 subjects were selected
fromthedatabase.Theirdemographicfeatureswere:21malesand 4 females, age50±10 years, range 28–68, BMI: 31.6±4.0kg/m², range 25.1–42.5kg/m²; apnea/hypopnea (AHI): 24.1±20.3, range 1.7–90.9. The Jaeger-Toennies system was utilized to obtain Polysomnogramsrecords.10–20electrodeplacementsystemwasa methodusedtodescribethelocationofscalpelectrodes. Each in-dividualrecordinthedatabaseconsistedof2channelsEEGs (C3-A2 and C4-A1), 2 EOG channelsand 1 EMG channel. The C3-A2
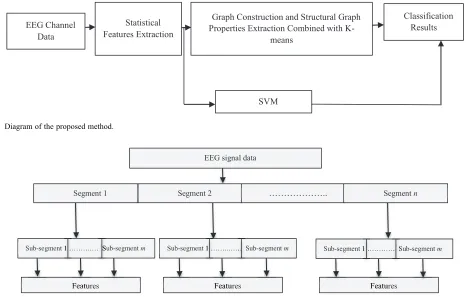
Fig.1. Automaticsleepclassificationblockdiagram.
Table1
Theinformationoftheexperimentaldata.
Sleepstage AWA S1 S2 S3 S4 REM Total
Numberofsegments 1109 897 988 1078 764 324 5160
EEG channel wasused in thisstudybecause it gives better clas-sification resultscompared withC4-A1 channel(¸Senetal., 2014). AccordingtotheR&KcriteriaeachEEGsignalwasdividedinto seg-mentsof30s(3000datapoints),witheachsegmentcorresponding toasinglesleepstage(AWA,REM,S1,S2,S3,S4,Artifact, Indeter-minate).Table1presentsthenumberofeachsleepstagesegments fromthe25subjectsduring6.9hperiod.Inthisstudy,allthe seg-mentsinTable1wereusedintheexperiments.
4. Proposedmethodology
This paperproposes an efficientmethod to classify EEG sleep stages.Fig.1 illustratesthe structureofthe proposedmethod.To decreasethedimensionalityofEEGsegments,eachsegmentis par-titionedinto75sub-segments.12statisticalfeaturesare extracted fromeachsub-segment,andthenalltheextractedfeaturesofeach EEG segment are mapped into a complex network. The average degree andJaccard coefficientsarepulled outfromeach network andusedasthekeyfeatures.Toinvestigatefromthecapabilityof complexnetworksbuildedfromstatisticalfeaturesinsleepstages identification,theextractedfeaturesareforwardedtothek-means andSVMclassifiersseparately.TheSVMandk-meansareselected because they are popularandefficient (Guo etal., 2009; Herrera etal., 2013).The detailsof themethodologyare explainedinthe followingsections.
4.1. Featureextraction
Featureextractionmethodsaimtoreducethedimensionalityof alargevolumeofsignaldatawithoutlosingthemaininformation. Inclassification,featureextractionisacrucialsteptoobtain effec-tive results.In this work, feature extraction is conducted in two stages through partitioning the original EEG data into segments andsub-segments.Thesestagesaredescribedinthefollowing sub-sections.
4.1.1. Segmentationtechnique
As EEG signals are non-stationary and non-periodic (Kemp, Zwinderman, Tuk, Kamphuisen, & Oberyé, 2000), we apply the segmentation technique in order to make EEG signals quasi-stationary. The EEG signals are divided into small segments. The interval of each segment is defined as 30s (3000 data points) in thiswork. Then, each segment isfurther divided into75 sub-segments . The number ofsub-segments and the length of each sub-segment is empirically determined during the experiments. To determine an optimum number of sub-segments that makes
EEGsignalsrelatively stationarywe compute thenumberof sub-segmentsaccordingtothefollowingalgorithm:
(1) m=1 (2) m=m+1
(3) EachEEGsegmentisdividedintomsub-segments (4) Extractingthestatisticalfeaturesfromeachsub-segment (5) Forwardtheextractedfeaturestotheproposedmethod (6) Iftheclassificationresultsaresatisfactorythenstop
segmen-tation
(7) ElseGotostep2
As the result, each segment is divided into 75 sub-segments witheach sub-segmentincludes 40EEGdatapoints.Fig.2shows thesegmentationtechnique.
4.1.2. Statisticalfeaturesextraction
After the segmentation, we used a statistical approach to ex-tractthe time domain features from each sub-segment. The fea-tureextraction methodcan reduce the number ofdata pointsin eachsegment.Thisstepisimportantbecausedecreasingthe num-berofnodesincomplexnetworkscandecreasethecomputational timeoftheproposedmethod.
Inthispaper,12statisticalfeaturesareextractedfromeach sub-segmentandusedasvaluableparameters,andallthefeaturesare putinto one vector to represent each EEG segment. The statisti-cal features are {Mean, Min, Mode, Max, Median, Range,Variation, Skewness,Kurtosis,1stQuartile,2ndQuartile,Standarddeviation}.
Theextractedfeatures arealsorankedaccordingtothe perfor-manceofthe networksduring thetrainingphase, andthen they aresorted indescending order. Thetop nine andtwelvefeatures arechosenasthemostsignificantfeatures.Theorderofthe impor-tanceofthestatisticalfeaturesis{Mean,Min,Mode, Max,Median, Range,1stQuartile,2ndQuartile,Standarddeviation,Variation, Skew-ness,Kurtosis}.Fig. 3showstheimportance ofeachfeature based ontheirclassificationaccuracyachievedinexperiments.
4.2.Mappingstatisticalfeaturestocomplexnetworks
Anetwork can be describedby a graph consistingofa set of nodes and a set of edges. The connection between each pair of nodesreferstotheexistence ofarelationshipbetweenthenodes (Blondel,Gajardo,Heymans,Senellart,&VanDooren,2004; Nasci-mento& Carvalho, 2011; Stam & Reijneveld,2007). In this work, thecharacteristicsofthecomplexnetworksareemployedto clas-sifyan EEGsegmentintoone ofthesixsleepstages.Tobuild the network, each vector of statistical features, which represent one EEGsegment,istransferredintoagraph.Thestructuralproperties ofeachgrapharethencalculatedandforwardedtoaclassifier.Let Xrepresents avector ofstatisticalfeatures froman EEG segment {xi}n1 ofnobservations.Firstly,each datapoint inXisconsidered asabasicnodeinanundirectedgraph.
Theconnectionbetweentwonodesisdeterminedaccordingto
Fig.2. Featuresextractiondiagram.
Fig.3. Classificationaccuracybasedonindividualstatisticalfeature.
grapharedeemed tobe connectedifthespacedistancebetween the corresponding nodes is less or equals to the predetermined value(adaptivethreshold D ).
(v1,v2)∈ Ei f d(v1,v2)<D, where Dis the adaptive threshold (1)
Afteragraphisconstructedfromthestatisticalfeatures,an ad-jacentmatrix iscalculatedbasedon thegraphconnection,which isdefinedas:
A(v1,v2) =
1 , if (v1,v2)∈ E
0 , otherwise (2)
Fig.4showsasmallsegmentof(2.4,5.0,6.2, 6.0,7.5, 8.5,3.0, 1.8,9.5)whenbeingtransferredintoacomplexnetwork.
The number of nodes increases when there are more sub-segmentsinoneEEGepoch,andviceversa.Allgraphshaveafixed numberofnodes.
4.2.1. Graphfeatures • Averagedegree
Theaveragedegree(AD)referstothenumberoflinks connect-inganodeinanetworktoothernodes.Inanindirectnetwork thetotalnumberoflinks L ,canbedefinedas:
L= 1 /N n
i=1
ki (3)
Where L represents the number of links, ki is the degree of nodeithandnisthesizeofthenetwork.
In Fig. 4 we have k1=1, k2=2, k3=3, k4=2, k5= 3, k6=2, k7=3, k8=0, k9=3,andAD=2.
Theaveragedegree wasusedby Artameeyanant,Sultornsanee, andChamnongthai(2015)todistinguishthesleepstagesusing weightedvisibilityalgorithm,andbyZhangandSmall(2006)to identitydifferentdynamicregimesintime series.Inthiswork, foreachgraphthedegreedistributioniscalculatedand consid-eredaseffectivefeaturesforsleepclassification.
• Jaccardcoefficient
We investigate the relations between nodes by using Jac-cardcoefficient.Jaccard coefficient wasused byAnuradhaand Sairam(2011)toclassify digitalimages,andIglesiasand Kast-ner (2013) employed Jaccard coefficient to analyse similarity betweentwotimeseries.TheJaccardcoefficientfunctionis cal-culatedbasedonthefollowingequation:
wvi, vj
= |(vi)∩
vj
/(vi)∪
vj (4)
Where (vi) is the set of neighbors of nodevi, (vj) is the setofneighborsofvj,and w =[0,1].Foreachgraph,aJaccard coefficientvectoriscomputed.
4.3. Statisticalanalysis
Inthisstudy,thecrossvalidation,sensitivity(SE)andaccuracy (AC)areusedtoevaluatetheperformances(Siuly,Li&Wen,2011; Zhuetal.,2014).
• K-cross-validation:isusedtoestimatethequalityof classifica-tion.Itiscalculatebydividingadatasetintokmutualexclusive ofsubsetsofapproximatelyequalsizeandthemethodrepeated k-times.
Performance= 1 /K k
1
accuracy(k) (5)
• Sensitivity: is a statisticalmeasure which is used to evaluate theperformanceofaclassificationtestedbymeasuringthe pro-portionoftheactualpositiveclassification.
SE = TP/(TP + FN) (6)
• Accuracy:isusedtocalculatetheproportionofthetotal num-berofpredictionsthatarecorrect.
AC = (TN+ TP)/(TN + FN+ FP + TP) (7) Where TP=correctly classified EEG sleep stages,FN=incorrectly classifiedEEGsleepstages,TN=thenumberoftruenegative clas-sification,FP=thenumberoftruepositiveclassification.
4.4. Classification
Fig.4. AcomplexnetworkrepresentingasmallsegmentofEEGfeatures,withnodesrepresentingdata(features)andalinerepresentsanedgebetweennodes,withdegree distribution.
their popularity in biomedical data classification (Güne¸s, Polat, Yosunkaya, & Dursun, 2009; Zhou, Gan, & Sepulveda, 2008; Zhu etal.,2014).
4.4.1. Supportvectormachine
SVMshave attracteda great deal of attention. The first paper fortheSVMwasproposed byBoser,Guyon,andVapnik(1992).It transformstheoriginaldataintoahighdimensionbyusinga non-linearmapping.Withinthenewdimension,itsearchesforthe lin-ear optimalseparatinghyperplane. Zhuetal.(2014)andHerrera et al.(2013) used theSVM classifier to classify EEGsleep stages. Inthiswork, aSVM machinewasusedasastandard classifierto comparewiththeproposedmethodinEEGstatisticalfeatures clas-sification.TheSVMfunctioninMatlabR2013isusedinthispaper.
4.4.2. K-meansalgorithm
K-means is considered as one of most powerful methods in data classification. The algorithmpartitions n observationsinto k groups, so that each observation belongs to one group with the nearest centroid.It has been widely used to classify data in dif-ferent areas,such asdigitalimages classification,time series and biomedical data analysing (Liao, 2005). In this paper, k-means functioninMatlabR2013isused.
5. Experimentalresults
In thissection,the efficiencyofthe proposed methodto clas-sify sleepstageswasevaluated.Twodifferentgroupsofstatistical features:thefirstnineandalltwelvestatisticalfeaturesfromeach EEGsub-segmentasdiscussed inSection 4,wereused. Themain purpose of selecting different features sets was to examine the abilityofbuildingstatisticalfeaturesascomplexnetworksonEEG sleep stages classification. A vector of statistical features, which contains900features(75×12),wasalsoforwardedtoaSVM and ak-meansclassifierforresultcomparisons.Theexperimentswere conductedusingMatlab(Version:R2013)onacomputer withthe following features: 3.40GHz Intel(R) core(TM) i7 CPU processor machine, and 8.00GBRAM. All the experiments by the proposed method,k-meansandtheSVMwereevaluatedusingaccuracyand sensitivity.
5.1. EEGsleepstagesclassificationusingdifferentnumberoffeatures
Twodifferentsetsofstatisticalfeatureswere usedinthis sec-tion.Theperformance oftheproposed methodbasedontwosets offeatureswasassessed.
5.1.1. Experiment1:usingthefirstninestatisticalfeatures
In this experiment, the top nine features of {max, min, mode, median, range, 1stquartile,2nd quartile,standarddeviation},based
Fig.5. Accuracybasedoncomplexnetworkproperties.
Table2
Classificationaccuracyoftheproposedmethodbasedon9features.
Sleepstage AWA S1 S2 S3 S4 REM Average
Accuracy 86.0% 88.0% 87.0% 69.0% 79.0% 70.0% 80.0% Sensitivity 87.0% 88.0% 87.5% 67.0% 79.0% 71.0% 79.8%
ontheirimportanceasshowninFig.3,wereusedtorepresentthe originalEEGdataineachsub-segment.Atotalof675(75×9) fea-tureswereextractedfromeach30ssegmentandwerethen trans-ferredintoacomplexnetwork.TheaveragedegreeandJaccard co-efficientfromeachgraphwerecalculatedandforwardedtothe k-meansclassifier.
Firstly,wetestedtheaveragedegreetoinvestigatehowthe av-eragedegreeofagraphwasusedtodistinguishsleepstages.From theobtainedresults,we observed that,the averagedegree wasa key featureto significantly identifythe sleepstage AWA,butnot sufficienttorepresenttheothersleepstages{S1-4,REM}.The re-sultsobtainedwerecompatiblewiththeresultsthatwerereported by Artameeyanant et al. (2015) and Zhu et al. (2014). The AWA sleepstage included the low activity compared with other sleep stages.
Table3
Classificationaccuracyoftheproposedmethodbasedonthe12features.
Sleepstage AWA S1 S2 S3 S4 REM Average
Accuracy 94.0% 92.16% 90.0% 92.3% 93.44% 91.2% 92.% Sensitivity 96.7% 93.0% 90.0% 95.0% 95.0% 91.0% 93.4%
Fig.6. ClassificationAccuracybasedonnetworkproperties.
Table2reportstheclassificationaccuracyandsensitivitybased onthetopnine statisticalfeatures.Basedon obtainedresults,we canseethat theaccuracyratesofthesixsleepstagesvaries.The betterperformance wasachievedforS1,S2 andAWA.Thelowest accuracyratewas69% forS3,and70%forREM.Theexperimental results shown in Table 2 confirmed that the nine features set wasnot sufficient to identify S3, S4 and REM. In summary, the performance oftheproposed method wasacceptable interms of accuracy when using the top nine statistical features to classify thesleep stages ofAWA, S1 and S2 fromEEG signals, while the accuracieswere a little bit low forS3, S4 and REM. The average ofaccuracy for the proposed method after repeating it 10 times usingtop nine features was 81% withC3-A2 channel EEG.Based onTable2,theresultsimpliedthattheproposedmethodhadthe abilitytoclassify thestagesofAWA,S1,S2 withagood accuracy of86%,88%and87%.
5.1.2. Experiment2:usingtwelvestatisticalfeatures
This experiment was designedto investigate the performance ofthe proposedmethodusingall twelvestatisticalfeatures{max, min,mode,median,range,1stquartile,2ndquartile,standard devia-tion,variation, skewness,kurtosis}.900(12×75)statisticalfeatures wereextractedfromeach30ssegment andmappedintoagraph. Themainpurposeherewastoexamtheeffectsof12features on thepropertiesofgraphandhow theincreasing inthenumberof nodesingraphscould improvethediscrimination abilityofsleep stagesclassification.
As mentioned in experiment-1, the average degree (AD) and Jaccardcoefficient wereexaminedto identifytheimprovementin classificationafterusing12features.Weobservedthat,theAD be-camethe essential propertyto distinguish thestages ofAWA,S1 andS2, significantly,afteraddedthe statisticalfeaturesof {varia-tion,skewnessandkurtosis}.BasedonFig.6theimpactofJaccard coefficient on the final classification accuracy was improved and alsobecameanimportantfeaturetoseparatetheREMsleepstage, probablyduetotherelationshipbetweennetworknodeswas im-proved.Itwasobservedthatthetwopropertiesoftheaverage de-greeandJaccardcoefficientfromthecomplexnetworkscan signif-icantlydistinguishthestageofAWA.
Table3showstheclassificationaccuraciesachievedbythe pro-posedmethodusingthetwelvefeaturesset.Basedontheresults, theclassificationaccuracyforS3,S4andREMstageswasimproved
Fig.7. Performancecomparisonamongtheproposedmethod,k-meansandSVM.
bymorethan18%,comparedtothoseinExperiment1.Theresults confirmedthatEEGsleepstagescouldberepresentedasgraphs.In general, theaccuracywasimprovedforclassifyingAwake,S1and S2byusingallthetwelvefeatures.However,theaccuracyratefor S3,S4 andREMincreasedsignificantly whenusingall thetwelve features.Itis92.34%,93.44%and93.77%,respectively.
AlsoasshowninTable3,thehighestclassificationaccuracyrate was92.16% forStage Awake, and93.44% forS4, respectively. The performancewasimprovedforallthesleepstages.Theaverageof accuracyusingallthe12featureswas92%.Basedontheresultsin
Table2,theproposedmethodwasefficienttoclassifythesixsleep stageswithagoodaccuracy.
5.2. Comparisonstudy
Toinvestigatethe performancesofthe proposed methodwith otherexistingmethods,weconductedtwotypesofcomparisonsin thissection.Firstly,theperformance oftheproposed methodwas compared with the support vector machine (SVM) and k-means, thetwopopularclassificationmethods.Secondly,theobtained re-sultsinTables 3and4were comparedwithother existing meth-ods,proposedbyFraiwanetal.(2010),Güne¸setal.(2009),Ozsen, (2013),Zhuetal.(2014)andHsu,Yang,Wang,andHsu(2013).
5.2.1. ComparisonwiththeSVMandK-means
Inthissection,thecomparisonwasmadeintermsofthe clas-sificationaccuracyandtimecomplexity.Thetwelvestatistical fea-turesextractedinSection4.1.2wereusedforthecomparison.4000 randomlyselectedsegmentswereusedinthecomparison.900 sta-tisticalfeatureswere extractedfromeachsegmentandforwarded to the proposed method, k-means andSVM classifiers to classify sleepstages.The SVMisabinaryclassifierandinorderto evalu-atetheperformanceoftheSVMwiththeproposedmethodaswell asthek-means,apairof2-statesleepstageclassificationwere as-sessedandtheaccuracyofeachsleepstagewascalculated.
Table4
Performancecomparisonofdifferentmethodswiththeproposedmethod.
Author Sleepstages Extractionfeatures Model Accuracy
Güne ¸s et al., 2009 AWA,S1,S2,S3,S4&REM Welchspectralanalysis Decisiontree 91.40% Hsu et al., 2013 AWA,S1,S2&REM Energyfeatures Recurrentneuralclassifier 87.2% Fraiwan et al., 2010 AWA,S1,S2,S3,S4&REM Timefrequencyentropyatdifferentbands Lineardiscrimination 84% Zhu et al., 2014 AWA,S1,S2,S3,S4&REM MeandegreeofDVGandHVG DifferentVisibilitygraphalgorithm+ SVM 87.5%
Ozsen, (2013) AWA,S1,S2,S3,S4&REM Dependentsequentialfeatures ANN 90.93%
Theproposedmethod AWA,S1,S2,S3,S4&REM Complexnetworkproperties Complexnetwork+ k-means 92.16%
Fig.8. Comparisonoftheexecutiontimeamongtheproposedmethod,k-means andSVM.
significantly when it dealt with 4000 segments. However, with sleepstagesclassification usingcomplexnetworkscombinedwith k-means, thediscrimination ability wasimprovedsignificantly.In addition,theeffectofthestatisticalfeaturesinsleepclassification, arefoundtobemoreeffectiveandpositivewhenimplemented us-ing complex networks. The average of 10 times accuracy of the proposed method,the k-means andthe SVM were 93% 60% and 53%respectively.
Intermsoftheexecutiontime,fromFig.8weobservedthatthe proposed method took an acceptable time although it hadmore processingstepsinvolvedinthealgorithm.K-meanswasrecorded the lowest executiontime comparedwith the SVM andthe pro-posedmethod.Althoughconvertingthestatisticalfeaturesto com-plexnetworkswouldtakemoretimeitprovidedmoreaccurate re-sultsinsleepstagesclassification.
5.2.2. Comparisonwithothersinglechannelsleepstages classificationmethods
To verify the performance of the proposed method,
Table 4 presents the comparison of the performances among the proposed method and some reported methods in the litera-ture.Thewinningclassificationaccuracyratesamongthemethods were highlighted in bold font in Table 4. Based on the results in Table 4, the proposed method is the best among the three methods. Güne¸s et al. (2009) reported their results of the sleep stagesclassificationusingalessnumberofepochscomparedwith our proposed method. The Welch spectrum was used to extract the important features fromEEG data and then fed the features to a decision tree classifier.The proposed method achieved high results comparedwithone proposed by Güne¸s etal. (2009). Hsu et al. (2013) identified sleep stages based on energy features. The energy features were extractedfromeach EEG segment, and a recurrent neural classifier was used to classify the extracted
features.TheresearchbyOzsen,(2013)useddependentsequential featuresextraction andartificialneuralnetwork algorithmto dis-tinguishsleepstages.Theresearchreportedanaverageofaccuracy 90.93%,about4% lower than the proposed methodin thispaper.
Fraiwanetal.(2010)focusedondesigningasystemtodifferentiate sleepstagesbasedontime frequencyentropy.Theaverage ofthe accuracyresultsobtainedwas84%.Theaccuracyresultswerealso lower than the proposed method. Zhu et al. (2014) developed a methodtoclassifysleepstages.Basedonvisibilitygraphapproach, theresearchersachievedan87.5%accuracy.Theproposed method isoutperformedthoseby Zhuetal.(2014).Based onTable4,the proposed method can be served asan effective method for EEG sleepstagesclassification.
6. Conclusions
Inthispaper,anefficientsleepstagesclassificationmethodwas proposed. The statisticalproperties of EEGsignals were analysed usingcomplexnetworkstoclassifyasinglechannelEEGsignalinto sixsleepstages.ThestatisticalfeaturevectorofeachEEGsegment wasmappedintoacomplexnetwork.Theaveragedegreeand Jac-cardcoefficient werecalculatedfromeach networktoforma fea-turevector. Allthe networkproperties werethen forwarded toa k-means classifier forthe sleepstages classification. Twosets of thetwelve andthefirst nine featureswere testedandevaluated. Theexperimentalresultsshowtha