Grafton, M.C.E., Izquierdo Acebes, D., Yule, I.J. Willis, L.A., 2016. Measuring the Spread Patterns of Spreaders Under Normal Field Conditions Compared to test Conditions. In: Integrated nutrient and water management for sustainable farming. (Eds. L.D. Currie and R. Singh) http://flrc.massey.ac.nz/publications.html. Occasional Report No. 29. Fertilizer and Lime Research Centre, Massey University, Palmerston North, New Zealand. 11 pages.
MEASURING THE SPREAD PATTERNS OF SPREADERS UNDER
NORMAL FIELD CONDITIONS COMPARED TO TEST CONDITIONS
Grafton M.C.E.1 Izquierdo Acebes D.1 Yule I.J.1 and Willis L.A.1
1New Zealand Centre for Precision Agriculture, Institute of Agriculture and Environment,
Massey University, Palmerston North, New Zealand.
The Fertiliser Quality Council, Ravensdown and the Fertiliser Association commissioned Massey University to conduct some fertiliser spreading trials over the summers of 2013 – 2014 and 2014 – 2015. This work was undertaken to provide a better understanding of the effects of field conditions on spread patterns for some commonly applied fertilisers, which were provided by Ravensdown and Ballance for the work.
This work was commissioned to help understand which factors effect spreading accuracy in actual application conditions. The work provides some science around this topic which has had fertiliser suppliers being blamed for poor spread outcomes by spreaders claiming the products are not of a suitable physical standard to spread accurately.
This work identified the following factors which reduce spreading accuracy which effects in- field CV and are poorly understood for ground-spread:
Border spreading (non- migration past border target)
Variable rate application within paddocks
Headland control (spreading around corners)
Effects of slope, hills and uneven surfaces
The effect of wind
Other changes in operating conditions, temperature, humidity, height of crop
The effect some of these variables have on in-field coefficient of variation (CV) and the importance in terms of bout width distances to meet Spreadmark standards are measured. The paper finds that the effect of slope has a marked negative impact on application rate and spread pattern. The effect of wind is also negative but can be mitigated. Border spreading is possible if the spreader is correctly set up. Variable rate application and changes in crop height, temperature and humidity were not tested.
Keywords: variable rate application, spread pattern testing, ground spreaders
Products and method
Trays were also laid on a slope which was between 10 - 12°, measured by an Abney inclinometer. Tests were undertaken in still and cross wind conditions on the flat and slope as in Figures 2 and 3.
[image:2.595.112.418.53.229.2][image:2.595.146.426.349.551.2]
Figure 1: Distribution of trays in a flat paddock prior running the Spreadmark tests.
Figure 2: Scheme of the set used for our Spreadmark tests in flat paddocks, displaying the three rows of trays, driving direction and orientation of the paddock
[image:2.595.118.502.618.752.2]The Spreadmark test
It is appropriate to explain what the Spreadmark test actually does and why this method of testing is undertaken. In a Spreadmark test the spreader is driven over a set of trays, which are: 0.5m x 0.5m square with baffles inside to prevent fertiliser bouncing out of the trays. A gap is left for the spreader to drive through and the contents of the dislodged trays are weighed and averaged with trays on either side of the wheel gap. All trays are weighed and a bout width established, for the spreader to spread which meets an international standard (ISO 5690) see Figures 4 and 5.
The bout width is derived from the coefficient of variation (CV), which is the standard deviation; that is where the variation in weights where 67% of the samples lie, divided by the average tray weight. So the spread pattern is overlapped to achieve a CV of 25% for fertiliser and ag-lime which contain no nitrogen; and 15% for fertilisers containing nitrogen, which is the ISO standard.
Therefore in Figure 4 where superphosphate is sown at 163kg/ha, the pattern overlap is set for a CV of 25%, which means that 67% of the trays will have the equivalent of between 122.25Kg/ha and 203.75Kg/ha. The trays are 0.25m2 whereas a hectare is 10,000m2,so the average weight in each tray is a little over 4 grams.
0 1 2 3 4 5 6 7
-40 -30 -20 -10 0 10 20 30 40
Distance from centre Tray Wt (g)
0% 5% 10% 15% 20% 25% 30% 35% 40%
0 4 8 12 16 20 24 28 32 36 40 44
[image:3.595.100.520.291.431.2]Bout Width TF CV%
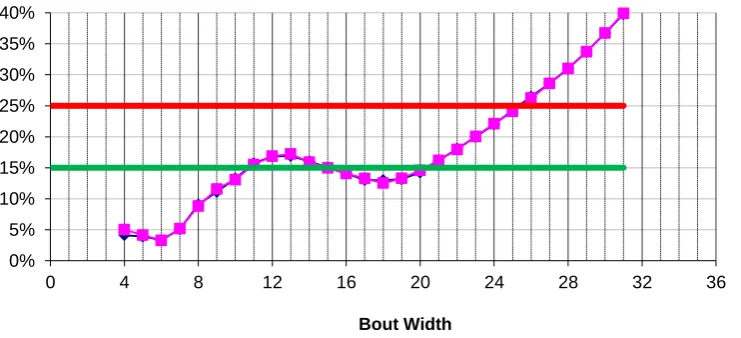
[image:3.595.96.508.473.633.2]Figure 5: Example of Spreadmark test using a Scania_ACE truck spreading SSP (163 Kg/ha) in standard conditions, showing the dispersion curve at BW=37m and increase of CV for a TF (To and Fro) distribution
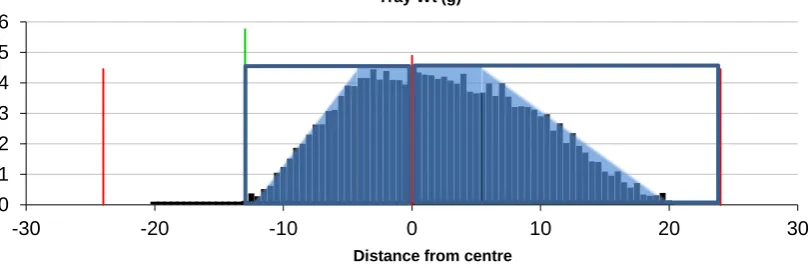
The Spreadmark software calculates the correct overlap to deliver the desired spread accuracy; in this case Figure 4 shows the weight of SSP in each tray displayed in black 20 metres from each side of the spreader using 80 trays. Figure 5 displays a graph with CV along the Y axis and bout width on the X axis. The green horizontal line is shown at 15% CV as for nitrogenous fertilisers and the red line is at 25% CV for non-nitrogenous fertilisers. Where the pink line intercepts the CV line, gives the bout width which must be driven to achieve the desired accuracy. In this case SSP, which does not contain nitrogen, intercepts the red line at 37m, which would achieve the desired accuracy of a 25% CV. However if the product contained nitrogen it would need to be driven at 17m where the green line intercept occurs to achieve a spreading CV of 15%.
The test in Figures 4 and 5 was undertaken on a flat paddock in still conditions. These are the conditions Spreadmark tests are undertaken and are rarely the conditions that prevail when fertiliser is spread on the farm.
The Kuhn Axis spreader has many of the features made available by manufacturers as standard. It had settings for border control, either to prevent discharge over a border or to maintain rate to a border but allow fertiliser to cross the border. However, these settings require product testing prior to spreading the material by the operator (Yule and Grafton, 2013).
Results
Three of the four products used in the trials contained nitrogen, they were; urea, DAP and Nitrophoska Blue (Nit). In the summer of 2013 – 2014 twelve trials were undertaken using two samples of SSP and twelve trials using DAP. The SSP trials were to compare a SSP with 17% fines (<0.5 mm in diameter) and one with 0.3% fines in still conditions (Chok, et al.
2014). The DAP tests compared spreading on the flat in still conditions with a 6m/s cross wind (22km/hr) (Grafton, et al. 2014). An additional 74 trials were undertaken during the summer of 2014 – 2015 using all four products, on slopes, flats and in still and windy conditions.
All products were affected by wind and slope, see Figures 6 and 7. Products were most affected by spreading across a slope, followed by spreading in still conditions, Figures 8 and 9; cross wind conditions, Figures 10 and 11; and border spreading, with the correct settings Figure 12 and incorrect settings Figure 13.
0 1 2 3 4 5 6
-30 -20 -10 0 10 20 30
T r a y W t ( g )
Distance from centre (m) Tray Wt (g)
Figure 7: Example of the effect of slope on a Spreadmark test using a Kuhn-Axis mounted spreader spreading Nit (78 Kg/ha), showing the dispersion curve at BW=24m. Where, 65.2% of the fertiliser is applied on the right side of the truck and 34.8% on the left.
Figure 8: Weight in grams of DAP in trays as Kuhn Axis spreads over the trays
Figure 9: Spread pattern test still conditions, DAP, bout width 21m. The green horizontal line represents the 15% CV line required for fertilisers containing N, the pink line the to and fro spread pattern.
0 1 2 3 4
-30 -20 -10 0 10 20 30
T r a y
W t
(
g
)
Distance from centre (m)
0 1 2 3 4 5 6 7 8
-25 -20 -15 -10 -5 0 5 10 15 20 25
Distance from centre
Tray Wt (g)
0% 5% 10% 15% 20% 25% 30% 35% 40%
0 4 8 12 16 20 24 28 32 36
[image:5.595.80.446.318.428.2] [image:5.595.74.445.500.669.2]Figure 10: Weight in grams DAP in trays as the tractor passes over them
Figure 11: Spread pattern test in 6m/s cross wind, DAP, bout width 13m.
Although SSP was also affected by spreading on slopes and in wind, the reduction in bout width to achieve a 25% CV was much less than with the reduction in bout width required by nitrogenous fertilisers to achieve a 15% CV.
The results for Urea whist spreading using the environmental setting; show that the product applied as it was meant to (figure 12). There was almost no product applied beyond 12m on the environmental side and the rate applied in total was 70% of target. Whilst on the overlap side the pattern was as required for a 24m bout width.
0 1 2 3 4 5 6
-25 -20 -15 -10 -5 0 5 10 15 20 25
Distance from centre
Tray Wt (g)
0% 5% 10% 15% 20% 25% 30% 35% 40%
0 4 8 12 16 20 24 28
[image:6.595.74.461.279.461.2]0 1 2 3 4 5 6 7 8
-30 -20 -10 0 10 20 30
Distance from centre (m) Tray Wt (g)
The spread pattern of SSP using the environmental boundary produced a flatter spread pattern than that of urea (see Figure 13). There is fertiliser spread beyond the 12m on the boundary side. The spread rate within the 12m boundary was 80% of the target rate. The rate within 12m, on the opposite side, was 75% of the application rate. This is because the environmental bout width set at 24m is incorrect for SSP and would need to be considerably further to achieve the desired accuracy.
Discussion
It is apparent that commonly encountered field conditions have a marked effect by increasing spreading CV at bout widths established under test conditions.
To establish the cost of uneven spreading Palisade ‖@Risk‖ software was applied to single superphosphate response trials undertaken by (Morton, et al. 1998). The SSP responses are based on diminishing return data collected over a number of years by (Morton, et al. 1998). SSP was used as it is the most commonly applied fertiliser in New Zealand.
0 1 2 3 4 5 6
-30 -20 -10 0 10 20 30
Distance from centre Tray Wt (g)
[image:7.595.81.486.104.238.2]Figure 12: A Spreadmark test using a Kuhn-Axis spreader spreading Urea (142 Kg/ha) with environmental settings, showing the distribution of fertiliser at 24m on the normal side and 12m on the border side
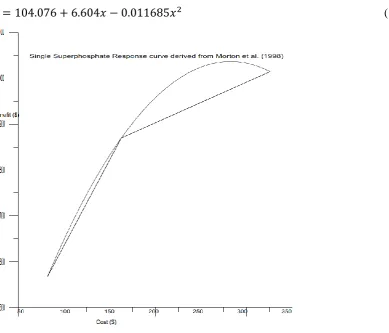
These responses were converted into cost benefit analyses by (Grafton, et al. 2011) and this data has been updated and a polynomial continuous function representing the diminishing return yield data, see Figure 14.
The spreading simulation data was produced in ―@Risk‖ version 6.3 (Palisade Corporation, NY).
The application rate had a normal distribution fitted which was given a standard deviation based on the coefficient of variation of the spreading performance.
That is; an application rate of 220Kg SSPha-1 spreading at a CV of 15%, would have a normal distribution fitted, with a mean of 220 Kgha-1 and a standard deviation of 33 Kgha-1.
The software runs Monte Carlo simulations to produce a distribution of outputs based on either discrete or continuous distributions with a number of iterations based on the user’s preference. In this case a continuous output was required with 5,000 iterations.
The spreading benefit was derived by assigning an output which varied with the spreading rate being simulated, using the yield curve for SSP response on pasture, equation 1:
[image:8.595.83.473.320.653.2](1)
Figure 14: A polynomial continuous function fitted to cost benefit analysis by (Grafton, et al. 2011) for @Risk analysis based on data from (Morton, et al. 1998), equation: Response ($0.28 KgDM) to Cost ($0.38 KgSSP).
shows a simulation at a high application rate at the asymptote of the curve using a CV of 45%.
[image:9.595.74.342.161.364.2]In figure 15 the simulated benefit is very close to the target; $572.67 to the target of $574.50. The simulated benefits maintain the Normal distribution, which the spreading rate is being varied in the input.
Figure 15: 220Kg SSP CV 15% which targets a response of $574.50 at a cost of $83.52
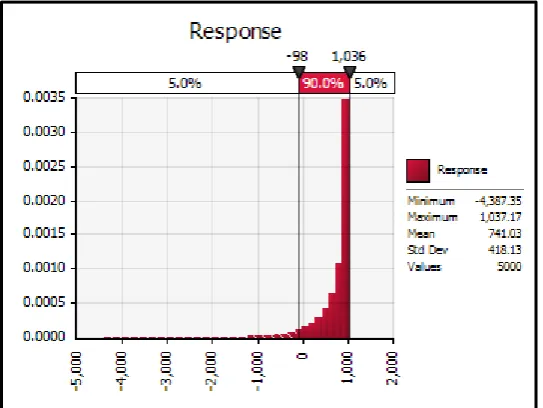
In figure 16 whilst the spreading rate is being varied in a Normal distribution, mean 880 Kgha-1, with a standard deviation of 264 Kgha-1 the output distribution from the response curve has become skewed. The modal rate is at the maximum response but much of the spread is less than the target and the simulated response of $741.03 is much less than the $1,006 target response.
[image:9.595.72.344.502.706.2]Conclusions
The results of the spreading with nitrogenous fertilisers were unexpected as the reduction in spreader performance, in terms of spread pattern bout width to achieve the target CV was greater than expected. Spreading of nitrogenous fertilisers, are required to meet a standard under Spreadmark test conditions of a CV of 15%. When compared to Spreadmark test conditions field conditions, influenced by slope and wind, may require significantly reduced spreader bout width if an acceptable CV of 15% is to be obtained.
In contrast to nitrogen containing fertilisers, single superphosphate which had the widest range of particle sizes and the largest mean particle size, had the most robust spread pattern. Fertiliser products which do not contain nitrogen are required to meet a standard under Spreadmark test conditions of a CV of 25%.
The results from these trials were different than expected. The NZ Groundspread Association has argued that a SSP should be fully granulated to produce a product with physical properties similar to DAP, so as to provide a homogeneous product in terms of particle size. However, DAP did not perform well in the spread tests conducted in the field. Even hypothetically, if the DAP did not contain nitrogen it still was a less robust spread pattern.
The ballistic properties of materials are dependent on size, particle density and spherical shape, in order of importance in distance travelled from a set speed. It is apparent that as SSP has the largest mean particle size, the highest particle density and a spherical shape, it has a more robust spread pattern when field conditions are not ideal. The spreading standard which applies to SSP also provides more latitude as it does not contain nitrogen and so a CV of 25% rather than 15% is acceptable.
It appears from the work carried out in this programme that Spreadmark certified spreading distances for nitrogenous fertilisers may not reflect performance in the field when conditions are not ideal and spread patterns are influenced by slope or wind. Certainly these results indicate that in New Zealand conditions where wind and slopes are encountered on most farms, spreading distances used when applying nitrogenous fertilisers need to be reduced to achieve the target CVs. Spread patterns under field conditions may be improved by calculating offsets to mitigate the effect of wind or slope. Such offsets with a narrower bout width; will require an accurate in truck GPS capability.
Offsets will vary for different spreader types; these spreaders will need to be type tested for a range of products in a range of conditions. The work undertaken for this report has identified that field conditions require mitigation strategies, using compensating offsets to maintain spreading accuracy. The report has not identified what these offset distances are.
Even if using offsets spreading distances will need to be a lot less than those measured in ideal test conditions, if accurate spreading is to be achieved.
References
Grafton, M.C.E., Yule, I.J., Robertson, B.G., 2014. The Ballistics of Separation of Fertiliser Blends at Wide Bout Widths. In: Nutrient management for the Catchment and Community. (Eds L.D. Currie and C.L. Christensen).
http://flrc.massey.ac.nz/publications.html. Occasional Report No. 27. Fertiliser and Lime Research Centre, Massey University, Palmerston North, New Zealand. Pages 11
Grafton, M.C.E., Yule, I.J., Manning, M.J., 2011, Analysis of Material Flow from Topdressing Aircraft, In: Adding to the Knowledge Base for the Nutrient Manager. (Eds L.D. Currie and C.L. Christensen). Occasional Report No. 24. Fertilizer and Lime Research Centre, Massey University, Palmerston North, New Zealand. 14 Pages.
ISO 5690 Equipment for distributing fertilisers— Test methods—Part1: Full width fertiliser distributors, ISO Standards Handbook, Agricultural Machinery, 13, International Organisation for Standardisation, 1985: pages 373–386.
Morton, J.D., Sinclair, A.G., Morrison, J.D., Smith, L.C., Dodds, K.G., (1998), Balanced and adequate nutrition of phosphorus and sulphur in pasture, New Zealand Journal of Ag. Research, Vol. 41: pp 487 – 496.
New Zealand Fertiliser Quality Council. (2013). New Spreadmark Codes of Practice. Wellington New Zealand: On line publication. Retrieved from: http://www.fertqual.co.nz