Solid Waste Management
in Vientiane, Lao PDR
by
V ongvilay Khotpathoum
(University of Tasmania)
Declaration
This thesis contains no material which has been accepted for the award of any other degree or diploma in any tertiary institution, and to the best of my knowledge and belief, contains no material previously published or written by another person, except where due reference is made in the text of the thesis.
Signed
Abstract
The substantial growth in research into solid waste management in developed countries is well documented. However, the management and practices of solid waste in developing countries are not so well-known. Therefore, the purpose of this study is to focus on solid waste management in Vientiane Municipality, in Lao PDR, a developing country, and to learn from the experience of managing solid waste in Australia, a developed country.
Firstly, this thesis examines the general issues and solid waste management strategies in Australia, followed by Australian policy and legislative :frameworks for solid waste management. Secondly, the study investigates the current issues, legislation and solid waste management practices in Vientiane, Lao PDR. A survey of solid waste management in Vientiane Municipality focuses on the Vientiane Urban Development Administrative Agency (VUDAA), two private waste contractors, and householders. The research methodology consisted of two survey questionnaires. The first was administered to the VUDAA and two private sector providers, and the other to 102 households in both urban and rural areas.
Acknowledgments
I would like to thank the people whose support and contribution made this thesis possible.
Firstly, I would like to acknowledge the support received from my family. Words cannot describe the emotional feeling that I extend to my parents, sister, brother, and cousins for their support and belief in me during the pursuit of my educational goals. I also would like to acknowledge Mr. Teo Hwe Teq, a person who has given me valuable input and encouragement all the way through.
I off er my grateful appreciation is to Mrs. Margaret Eldridge who has helped me and welcomed me to share her home. I would not have had the opportunity to be here without her generous support. I particularly want to thank her for helping with English language.
Much appreciation extends to my supervisor, Julie Davidson, for her knowledge, ideas, thoughtful suggestions, patience, guidance, and time. She was always there when I needed help. This thesis would not have been completed without her.
Acronyms
ADB ATSDR DCTPC DOE EPA EPR ESL GDP GNP GTZ JFPR JICA LaoPDR LDC MCTPC MTR NCEE NGO NKRS NMOC NSC NSWAsian Development Bank
Agency for Toxic Substances and Disease Registry Department of Communications, Transport, Posts and Construction
Department of Environment Environmental Protection Act Extended Producer Responsibility Earth Systems Lao
Gross Domestic Product Gross National Product
Gesellschaft fiir Technische Zusammenarbeit Japan Fund for Poverty Reduction
Japan International Cooperation Agency Lao People's Democratic Republic Least Developed Countries
Ministry of Communications, Transports, Post, and Construction
Mid Term Review
National Centre for Environmental Economics Non-Government Organisation
National Kerbside Recycling Strategy Non-Methane Organic Compound National Statistics Centre
NUOL NWMRS OECD PADETC PPPUE STENO STEO SWM
ucs
UNDP UNEP VUDAA WHO WMCNational University of Laos
National Waste Minimisation and Recycling Strategy Organisation for Economic Cooperation and Development Participatory Development Training Centre
Public Private Partnerships for the Urban Environment Science and Technology and Environment Organization Science Technology and Environment Office
Solid Waste Management Urban Cleansing Service
United Nations Development Program United Nations Environmental Program
Vientiane Urban Development Administrative Agency World Health Organisation
Table of Contents
Declaration ... · .... · · · ·. · · · 11
Abstract ... · · ... · · · 111
Acknowledgement. ... iv
Acronyms ... v
Table of contents ... v11
List of figures ... x
List of tables ... xi
Chapter 1: Introduction ... 1
1.1 Introduction ... 1
1.1.1 Country circumstances ... 2
1.2 Study objectives ... 4
1.3 Study area ... 5
1.3.l A brief background on Vientiane ... 7
1.3.2 Population growth ... 7
1.4 Summary ... 10
1.5 Thesis outline ... 11
1.6 The limitations ofthis research ... 12
Chapter 2: The mountain of waste ... 13
2.1Introduction ... 13
2.1.1 Waste and problem associated with it.. ... 13
2.1.2 Solid waste ... 14
2.2 Solid waste management ... 16
2.2.1 Collection and transport ... 17
2.2.2 Waste minimisation ... 18
2.2.3 Treatment and disposal ... 19
2.3 The economics of solid waste ... 23
2.3.1 Charges ... 25
2.4 Summary ... 26
Chapter 3: Solid waste management in Australia. ...•... 27
3 .1 Overview of solid waste management in Australia ... 27
3.2.1 Waste avoidance ... 28
3.2.2 Waste reduction ... 29
3.2.3 Waste recycling ... 31
3.2.4 Energy recovery ... 32
3.2.5 Waste disposal. ... 33
3.3 Solid waste management issues in Australia ... 35
3.4 Australian policy and legislative frameworks for solid waste management ... 36
3.4.1 National waste minimisation and recycling strategy (NWMRS) ... 36
3.4.2 National kerbside recycling strategy (NKRS) ... 37
3.4.3 State and territory government solid waste management policies and legislations ... 3 8 3.5 Australian local government and environmental management.. ... 39
3.5.1 Local government and solid waste management system ... 40
3.5.2 Problems in solid waste management faced by local governments ... 41
3.6 Summary ... 42
Chapter 4: Solid waste management in Vientiane, Lao PDR ...• 43
4.1 Solid waste management issues ... 43
4.2 Legislative framework ... 45
4.3 Solid waste management and organisational involvements ... 48
4.4 Solid waste management in Vientiane ... 51
4.4.1 Responsibilities for solid waste management ... 51
4.4.2 Waste disposal and landfill site ... 53
4.4.3 Waste collection systems ... 55
4.4.4 Waste recycling ... 56
4.4.5 Wa"ste pickers ... 58
4.5 Summary ... 59
Chapter 5: A survey of solid waste management in Vientiane ... 60
5.1 Purposes of the survey ... 60
5.2 Methodology ... 61
5.3 Survey results ... 64
5.3.l VUDAA and private waste contractors ... 64
5.3.1.1 General details and waste collection service ... 64
5.3.1.2 Waste disposal and landfill site ... 70
5.3.2 Domestic households ... 72
5.3.2.1 Waste collection service ... 72
5.3.2.2 Waste disposal. ... 75
5.3.2.3 The possibility of improving waste disposal ... 77
5.3.2.4 The possibility of improving waste disposal and collection service79 5.4 Discussion ... ' ... 82
5.4.1 Waste collection service ... 82
5.4.2 Waste disposal ... 85
Chapter 6: Conclusion and recommendation ... 86
6.1 Conclusion ... · ... 86
6.2 Recommendations ... 87
References ... 90
Appendix 1 ... 101
Appendix 2 ... 107
List of Figures
Figure 1.1 Map of the Lao PDR ... 2
Figure 1.2 Map of Vientiane, Lao PDR ... 6
Figure 1.3 Population data for Vientiane Municipality, Lao PDR in 1995, 2000 and 2005 ··· 9
Figure 4.1 Organisational structure of SWM in Vientiane Municipality ... 52
Figure 4.2 Waste collection service in Vientiane ... 56
Figure 4.3 Waste pickers in Vientiane ... 58
Figure 5.1 VUDAA organisation flow chart ... 65
Figure 5.2 Waste collection activity with a large open dump truck at the market in Vientiane ...
67-Figure 5.3 Frequency of waste collection by area ... 72
Figure 5.4 Rubbish bins provided by area ... 73
Figure 5.5 Timing of service by area ... 73
Figure 5.6 Waste disposal service used for normal waste by area ... 74
Figure 5.7 Failure to collect waste by area ... 74
Figure 5.8 Frequency of failure to collect waste by area ... 75
Figure 5.9 Waste separated into different categories by area ... 76
Figure 5.10 Different categories waste separated by area ... 76
Figure 5 .11 Usual method of waste disposal by area ... 77
Figure 5.12 Collection service improvement in the last five years by area ... 79
List of Tables
Table 1.1 Comparison of population growth rates in South East Asian countries ... 8
Table 2.1 The stren~ths and weaknesses of waste treatment and disposal methods .. 20
Table 3.1 Key legislation and selected waste minimisation strategies for the New South Wales and the Tasmanian government, a case of comparison ... 38
Table 3 .2 Legislation, regulations and guidelines relating to landfills for the governments of New South Wales and Tasmania, a case of comparison ... 39
Table 4.1 Main features of the levels oflandfill and leachate control.. ... 54
Table 5.1 A list of survey area ... 63
Table 5.2 Waste volume collected per annum ... 64
Table 5 .3 Summary of the weekly designated areas of the Lao Garbage Company waste collection service ... 69
Table 5.4 Aware of effects of dumpling and burning waste by area ... 78
Chapter 1: Introduction
1.1
Introduction
In recent decades, the rapid growth of cities in the developing world has resulted in increased consumption of resources to meet the rising demands of urban populations and industry, and this situation directly increases the amount of waste generation in cities (Boadi & Kuitunen, 2005). The growth of waste volume and the change in waste composition are attributed to a number of factors, such as rapid growth of population and economy (more people to produce waste and more money to buy products which will become waste in the end); insufficient infrastructure to deal with the growth; limited funding for planning and proper operation; lack of legal framework and political will for implementation and enforcement; lack of community involvement and clearly inadequate knowledge and skills to deal with or prevent such problems (Yousif & Scott, 2007). The outcomes of these changes and inadequate waste management practices are a direct impact on public health and the natural environment, allowing for the increase of uncontrolled dumpsites and refuse in the urban environment (Yousif & Scott, 2007). Thus, these factors are the axis around which poor waste management practices revolve.
anticipates learning from the expenence of developed countries, particularly
Australia.
1.1.1
Circumstances
The Lao People's Democratic Republic (Lao PDR) or Laos is a landlocked
country situated in Southeast Asia. The population is approximately 6,521,998
people with an annual growth average of 2.37% (CIA, 2007). The country is
bordered by five other countries: the People's Republic of China and Burma to the
north west, Thailand to the west, Vietnam to the east, and Cambodia to the south
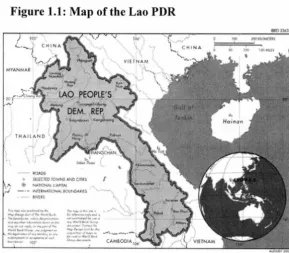
(Figurel. Map of Laos). The nation is bordered on the west by the Mekong River, the
most important river for more than seventy million people who live along the river
(Kristensen 2001). The Mekong River is the main source of food (rice crops,
agriculture, and fish especially), transportation, communications and trade with other
countries sharing the river (ADB, 2006; Kristensen, 2001). In addition, the main tributaries of the Mekong all have significant watersheds; these tributaries are used
[image:14.566.161.450.471.724.2]fur hydroelectric power generation (ADB, 2004; Wong, 2004).
Figure 1.1: Map of the Lao PDR
-~-~ tOAOS
,
...
\.\
VfUNAM \
0 SUfCl(D fOWNS Ai"1D OflES I ,.. @ iw..nc>NA.t CAl'f1Al
;..J - --INfUNATIONAI. M)JN0AIJE$.
,... · lr·'fU ~ , "'·--~"".,. ...
...,~"""""'""' .... ,,,.._ ... ..._ ... ._ -""'tlo~._ ... .,..,i1,o
_,,.. ... ~ ... ,,..,.1-.. ~ ... c:i..._.,..._
-·-.,..,-
..
~..,.-'--~·<I-· ~- 107·
,,...,... .r-:'\..~ >
""""""""""·~--· ... ·-1),.,
""'-*"~-.. """~~"""' ...
--i'.'--... ~ ... ,i.:. ...
....,.i...--'....,...,,. -'~--·-· "'-"'-~ ...
c.--.-
CAM&.OOfA tOliLaos has a total land area of 236.800 square kilometres (km2) with largely mountainous topography and thick forest (ADB, 2006; CIA, 2008). The mountainous landscape widens across the most northern part of the country (WHO, 2005). The central and southern parts of the nation are plateaus and plains with heavy pollution compared to the northern area (Wong, 2004). Administratively the country is divided into sixteen provinces, one municipality, and one special region (Regional data exchange systems, 2008). The capital city of Laos is Vientiane which is located in the central part of the country (Wong, 2004).
Laos has a tropical monsoon climate which is characterized mainly by two distinct seasons - a rainy season from May to October and a dry season from December to April (ADB, 2006). The natural hazards are flooding and drought which occur frequently (CIA, 2008). For the period of the wet season, areas of greater altitude can receive rainfall of more than 3000 mm annually (Wong, 2004). Due to relatively low altitude, Vientiane receives an annual rainfall of between 1500 mm and 2000 mm (Wong, 2004). The annual average temperature range is approximately 28 °C to a maximum of 38 °C (Regional data exchange systems, 2008). However, during winter in the mountainous areas, the temperature drops to around 14 to 15 °C (Regional data exchange systems, 2008).
estimated maternal mortality was more than 400 per 100 OOO births. This was higher for females aged between 15-39 years, and it was even higher with those aged between 30-39 years (NSC, 2005).
From an economic perspective, Laos is largely an agricultural region with about 80% of its labour force employed in the agriculture sector, while the industry and services sector employs around 20% (estimated in 2005) (ADB, 2006; CIA, 2008). Laos depends a lot on foreign aid and imports a large number of its manufactured goods, medicine and machinery (DEFAIT, 2003 cited in Wong, 2004). The Lao economy benefits from investments in hydropower, mining, and the construction of hydroelectric dams. The latter is one of the strong economic drivers (CIA, 2008). In addition, the export commodities are mainly hydroelectricity, timber, copper and gold, coffee, wood products and textiles (CIA, 2008).
Laos J:ias an underdeveloped infrastructure, especially m rural areas. Although the Lao government has support from Japan and China to improve the road system, it has no railroad, only a basic road system, limited external and internal telecommunications (CIA, 2008).
In addition, because of climatic and topographic conditions, SWM is a largely neglected subject. Low awareness and education on SWM result in inappropriate handling of waste, for instance, through burning and dumping which produce health risks for all communities. The country's rivers, especially the Mekong River, are critical to the population's livelihoods. However, the rivers are still used as a dumpling ground for waste, so that during the rainy season, when flooding occurs, the dumped waste is redistributed into residential areas. These practices produce widespread and negative health effects.
1.2
Study Objectives
The main objectives of this thesis are to:
•
review the relevant literature associated with solid waste management;• collect information on the ongoing status of solid waste management
activities in Laos;
• explore the relevant regulations and legislation in Australia and Laos with are associated with solid waste management and the roles these play in order to encourage environmental improvement;
• critically examine the key challenges and hurdles to solid waste management in Laos;
• provide recommendations on how to improve waste management m Vientiane, based on the case study results;
• learn from the experience of a developed country, using the example of Australia.
1.3
Study area
Figure
1.2: Map of Vientiane, Lao
PDR
0
SANGTHONG
N
!
I
NAXAITHONG
XAITHANY
- cH:t.. THABUR ~ SIKHOTHA80tJG / XAYSETTHA
~ -
-SIS1ffTHANAK
I
/
:
:~
10,000 20,000 40,000
~~~liiiiiiiiiiiiiiiiiiiiliiiiiiil~~~~~~Meters
~PHONG
1:600,000
Logctnd
Rural Arcio
D
lkban Arcia1.3.1
A brief background on Vientiane
As mentioned before, the capital city of Lao PDR is Vientiane. It has a total land area of approximately 3,920 km2 and is located on the Mekong river bank directly opposite Nongkhai province, Thailand (MacDonald, 2004; WEP A, 2008). As the Lao economy remains open to foreign investments, the prefecture of Vientiane is the centre for business and government. The city accommodates all of the foreign embassies, the presidential palace, government offices and non-government organisation head offices (MacDonald, 2004). In addition, many foreign businesses invest in several sectors, particularly in industrial factories, wood processing, textiles, and garment factories (Phouxay, 2007). Thus, urban migration seems to be increasing with the requirement for a bigger labour force and a number of young people have migrated from the countryside to the larger cities, particularly to the capital city, in order to improve their life, chances, career, and education (Phouxay, 2007). Since Vientiane has expanded rapidly, the city is facing a number of infrastructure-related problems such as traffic jams, sewerage disposal problems, and poor waste management. According to UNEP (2001 ), "such growth is known from experiences a 11 over the world to lead to an exponential increase in mban environmental problems and stress the cultural fabric of the ethnically diverse country". People in rural areas, however, still remain in farming (ADB, 2006).
1.3.2
Population growth
many children in case they do not all service. The other Mekong subregion countries, such as Vietnam and China (particularly Yunnan province), had adopted policies to reduce the rapid rate of population growth (Jones, 1999); for example, one or two children per family. According to Jones (1999), Thailand has the highest level of urban dominance of any large countries in the world, with its urban population existing in the capital city (Bangkok). However, the low population growth rate in this country is mostly because of the urbanisation subverts the largely corporate family based way of life of traditional society and replaces it with individualism and growing personal objectives (Jones, 1999). The Urban Development Sector Unit (1999) states that socio-economic development, industrialisation, and urbanisation have an effect on the waste generation rates.
Table 1.1: Comparison of population growth rates in Mekong subregion countries.
Country Population growth rate (%)
Cambodia 2.5
LaoPDR 2.5
Burma 2.3
---
Thailand 0.8Vietnam 1.6
Yunnan Province, China 1.2
(Source: ADB-UNEP, 2004 cited in Khanah & Souksavath, 2005)
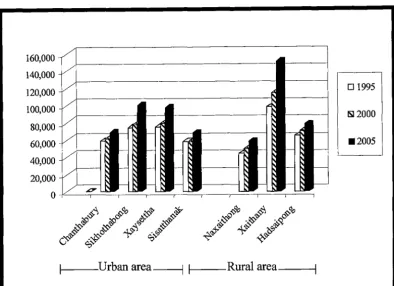
In the past decade, the urban population has been increasing rapidly, mainly because of migration to towns (STEA & UNEP, 2006). According to Ababa (2006), the National Statistics Centre (NSC)1 has been conducting population census surveys every ten years; the first census was conducted in 1985, and the second and third were carried out in 1995 and 2005. Since the population data from 1985 is not available, figure 2 represents the population in the whole city in 1995, 2000, and 2005 respectively.
1
Figure 1.3: Population data for Vientiane Municipality, Lao PDR in 1995, 2000 and 2005. 160,000 140,000 120,000 100,000 80,000 60,000 40,000 20,000 0 / /
v
~v
~,'
~
v
-I
di
'I
- ~ I - - -~~
-v
~~ ~ ~ ~'
-~
~-'
~-I
-V~' ~
!
~~ ~ ~ ~
v~' - ~ ~
~ - ~ - ~ -
-~
~ ~ ~~
~
~~
~v-u-
~ - I - - ~ ~ --~
1---Urban area---l 1---Rural area---;
Source: NSC, (1995 & 2005); NSC (2000) cited in ESL (2004a)
D 1995
fSi12000
•2005
Figurel.3 represents the Vientiane population data for 1995, 2000, and 2005 respectively. It can be seen clearly that the differences between the population in the urban areas and the least developed areas have increased rapidly at each census. The most significant item here is the high population in Xaythany district. In just fifteen years, the population in Xaythany district has increased from around 90,000 to almost 160,000 persons. On the other hand, in the Sikhottabong and Xaysetha districts in the urban area the population :r;ose to almost 100,000 persons in 2005. The smallest population occurs in Naxaithong district which has risen less than 60,000 persons over the fifteen year period.
1.4
Summary
1.5
Thesis outline
This thesis is organised as follows:
Chapter 2 examines the literature to illustrate SWM theory and the complexities involved. These include collection and transportation, waste minimisation, treatment and disposal. In addition, the economics of solid waste is highlighted as an associated environmental problem.
Chapter 3 gives SWM background and SWM strategies in Australia. It
focuses on SWM issues, the national policy and regulatory framework for SWM which include the national waste minimisation and recycling strategy, and state and territory government SWM policy and legislations. In addition, Australian local government environmental management is also illustrated.
Chapter 4 examines some of the SWM issues in Vientiane Municipality. It
illustrates the legislative framework in Lao PDR and then focuses on the SWM initiatives and organisational involvement. It details SWM in Vientiane Municipality including responsibility for SWM, waste disposal and landfill sites, waste collection systems, and waste recycling.
Chapter 5 reports on a survey of SWM in Vientiane. It explains the methodology and interview process involving relevant stakeholders. These include the Vientiane Urban Development Administrative Agency (VUDAA), two private contractors: a.) Lao garbage company and b.) Chanthabury Cleansing Pvt. Company and lastly households. In addition, survey results and data analysis are also provided.
1.6
The limitations of this research
Not many solid waste management projects have been undertaken in Lao PDR, thus there were difficulties accessing the relevant documents for references and analysis of the issues. In addition, a review of literature from different sources found only a few papers or studies relevant to this topic. These are projects of the Japan International Cooperation Agency (JICA) (2004) and the United Nations Development Program (UNDP) (2004) both of which employed Earth Systems Lao to undertake waste management studies in Vientiane. In addition, the research paper written by Bhoj Raj Rhanal and Bounsouk Souksavath (2005) proved helpful.
Chapter 2: The Mountain of Waste
2.1
Introduction
2.1.1 Waste and problems associated with it
What is waste? We usually think that waste is just rubbish such as tins, bottles, paper and old food that are thrown in the rubbish bin (Becklake, 1991: 4 ), but in fact the definition of "waste" is more than that. According to Becklake, ( 1991 : 3 ), "All living things produce waste". Waste is basically produced from households, industries and commercial enterprises. It can be defined as any product or substance that is no longer of use or value to people or organisations that own it and which will be discarded (Australian Government Productivity Commission, 2006: 2). Simply throwing things away creates pollution and is wasteful of the Earth's limited natural resources (Becklake, 1991). EPA NSW defines waste as "any matter, whether solid, liquid, gaseous or radioactive, which is discharged, emitted or deposited in the environment in such volume, constituency or manner as to cause an alteration of the environment" (EPA NSW, 1996).
Even though waste is perceived to be a problem for many reasons, the three major reasons usually cited are: (i). disposal which can affect the environment and people's health; (ii). landfill space is claimed to be becoming scarce; and (iii). waste is the unused items of a life cycle process that can have upstream environmental and resource implications (Australian Government Productivity Commission, 2006:XXVII). In general terms, poor waste management practices have a direct impact on public health, natural environment, and economy. Firstly, in terms of public health, poor waste management practices allow for the creation of serious health problems associated with disease-carrying pests, such as rats and flies (Birley
2005). For instance, Domfeh (1999) asserts that poor garbage storage and sanitation results in diarrhoea in most third world countries. Secondly, Rogers (2005: 4) claims that the direct environmental impacts of solid waste are sobering. In particular, the greatest environmental threat of solid waste is from the landfill itself. According to Rogers (2005: 4), the increased amounts of waste mean more and more toxins are released into the environment, and contaminate the soil and water supply. The landfills also emit 'land-fill gas', due to the emissions of decomposing waste (Rogers, 2005: 4). This vapour consists mostly of highly flammable methane, which is a major contributor to global climate change (Cameron, 2008; Rogers, 2005: 4). Lastly, due to increasing solid waste generation, increasing land prices and more stringent environmental regulations, waste management is becoming more expensive (Qian & Burritt, 2007). For example, the urban areas of Asian countries currently spend around US$ 25 billion on SWM per annum; this figure will rise to at least US $ 50 billion in 2025 (Urban Development Sector Unit, 1999). In the long run, this increase in cost not only has a negative impact on the country's economy, it will also impact on the effective operations of the organisations involved in waste management (Qian & Burritt, 2007).
Therefore, due to this complexity of issues at hand, waste management is a challenging field. In other words, waste management often covers a truly wide range of disciplines from natural sciences and technology to social sciences and beyond (Bruner, 1996; Miranda, Miller & Jacobs, 2000). Indeed, while looking for solutions to waste problems, it is always necessary to address more than just one discipline (Bruner & Feliner, 2007).
2.1.2 Solid waste
increased generation of large amounts of solid waste in th.e world is attributed to the rapid growth of cities both in developing and developed countries (Boadi &
Kuitunen, 2005). Compounding this effect is the fact that modem societies are also known as 'throwaway societies'. Some of the characteristics of these societies are; economic prosperity which encourages people to buy more, which in tum increases waste generation; advertising which emphasises the short life-cycle of previous products, where the latest product is an improvement on all the others; and self-service cultures that wrap everything individually so that we can take the goods from the shelves ourselves (Becklake, 1991: 6). All of these factors have contributed to the increase in the level of solid waste generation over the past.
In Australia, a portion of solid waste has been designated by the government as 'hazardous waste' (Scott, Beydoun, Amal, Low & Cattle, 2005). In general terms, hazardous waste is defined as waste that requires treatment before it is suitable for disposal to landfill (Beranek, 1992, Nathanson, 1986: 373; Scott et al., 2005). Examples of hazardous waste include medical waste from hospitals, fertilisers, paints, and cosmetics (Becklake, 1991: 18; Beranek, 1992; Nathason, 1986: 337). In Australia, although all states specify the separate disposal of hazardous wastes, variations exist between states as to what constitutes a hazardous waste, and the acts and regulations that control them (Scott et al., 2005). Having said that, hazardous wastes in Australia are generally categorised according to their basic properties of toxicity, reactivity, ignitability, and corrosivity (Chayabutra, 1994). It is not the intention of this thesis to focus on hazardous solid waste, hence, solid waste will be considered to be the more common type of municipal waste, as alluded to earlier.
The purpose of municipal solid waste management is to protect public health, prevent congestion, and preclude unpleasant odours and aesthetically offensive scenes by removing these wastes from point of origin and disposing of them in a safe and acceptahle way (Beede & Bloom, 1996: 177). Therefore, with this notion in mind, the following discussion will focus on the management of solid waste.
2.2
Solid waste management
Scholars recommend the implementation of an integrated waste management hierarchy in order to achieve sustainable solid waste management (for example, see, Price & Joseph, 2000). Indeed, review of the literature on solid waste management shows that this system has been favoured by many developed countries such as the United States (for example, see, Lah, 2001), Australia (for example, see, Chayabutra, 1994) and developing countries as well, such as Panama (for example, see Linowes
& Hupert, 2006) and India (for example, see, Zia & Devadas, 2007). The solid waste management hierarchy was designed to provide a framework by which municipal solid waste is reduced or managed through several different practices (Price &
community's needs (Lah, 2001; Yousif & Scott, 2007), the basis of this strategy consists of (Price & Joseph, 2001; Urban Development Sector Unit, 1999):
• Collection and transport • Waste minimisation
• Treatment and disposal (recycling, composting, landfilling, incineration with energy recovery)
2.2.1 Collection and transport
In general, there are three waste collection methods. The first method is referred to as the traditional method, where a truck with a three-man crew drives from one house to another as two men empty dustbins or throw rubbish bags into the rear of the truck (Angelelli & Speranza, 2002). This method is still used in many developing countries. The primary s1,iortcoming of this method is that it requires a large number of crew to do the collection, hence increasing the collection cost (Angelelli & Spreranza, 2002).
The second method, known as the side-loader system, requires residents to place their garbage bins on the streets, and the collecting truck will stop beside each container and, by means of a semi-automatic system operated by the driver from the cabin, it lifts and empties the bins into the truck's body (Angelelli &' Speranza,. 2002). This system requires the lowest number of crew, it collects more rubbish in a single operation as compared to the traditional system, is faster and does not involve the division of a collection area into neighbourhoods (Angelelli & Speranza, 2002). However, the main drawback of this system is it often results in litter being left where bags have been ripped or interfered with by animals (Chayabutra, 1994). This is by the far most popular waste collection method in Australia.
The third method is the communal collection ( Chayabutra, 1994 ), where the municipality provides large containers at designated areas for residents. In Australia, this method is still practised in rural areas and areas that are far away from local infrastructure. The drawback of this system is it could be expensive for the operator due to the long distances travelled and the time involved (Chayabutra, 1994). In addition, this method is inconvenient for residents because they need to travel to a central location in order to dispose of their waste.
2.2.2 Waste Minimisation
affect the waste stream before the point of generation, while recycling, combustion and landfilling are the management options after the point of generation (Phillips, Adams, Read & Green, 2000; Price & Joseph, 2000; Read & Phillips, 1998). Waste minimisation has been regarded by some as too idealistic to feature within the solid waste management strategy (Price & Joseph, 2000). However, the best way to achieve more sustainable waste management is the reduction of waste at source (Phillips, Clarkson, Adams, Read & Coggins, 2003). Although waste minimisation is at the top of the waste management hierarchy, it is almost the most difficult to implement. Scholars argue that reform of education and information strategies are essential in order to increase the awareness of the importance of waste minimisation (Price & Joseph, 2000; Waite, 1995). Having said that, this strategy has also been successfully implemented. A good example can be drawn from Northamptonshire in UK, where the local council, in partnership with 22 companies, developed a program that concentrates on resource efficiency and dramatic waste reduction, and increased the production of more first class product per unit of resource (Phillips et al., 2003). After 24 months, the companies not only saved 3.5 million pounds, they also reduced their waste output associated with production by at least 20 percent (For full details, refer to Phillips et al., 2003), hence, greatly reducing waste generation.
2.2.3 Treatment and disposal
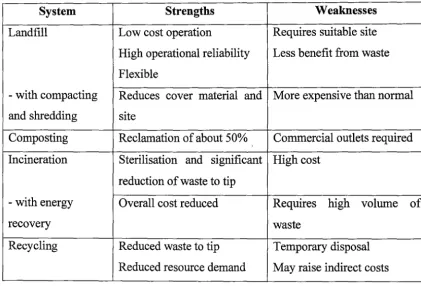
Table 2.1: The strengths and weaknesses of waste treatment and disposal methods
System Strengths Weaknesses
Landfill Low cost operation Requires suitable site High operational reliability Less benefit from waste Flexible
- with compacting Reduces cover material and More expensive than normal and shredding site
Composting Reclamation of about 50% Commercial outlets required Incineration Sterilisation and significant High cost
reduction of waste to tip
- with energy Overall cost reduced Requires high volume of
recovery waste
Recycling Reduced waste to tip Temporary disposal Reduced resource demand May raise indirect costs
(Source: Commission of the European Communities, 1982, cited in Chayabutra,
1994)
Landfill:
landfill (Ramboll, 2007). Open landfills have a low management cost, but result in a lot of pollution (Chayabutra, 1994). Typically, these landfills are located in areas where the risk that they will cause damage to human health and the environment is reduced to acceptable levels (Australian Government Productivity Commission, 2006: 68). Once they reach the end of their operational life, they are restored and used for recreational or other purposes (Ramboll, 2007). The main drawback of open dumping and sanitary landfill is that it is practically impossible to keep the hazardous waste within landfill sites (Becklake, 1991: 19). Therefore, secure landfills are often used to treat hazardous waste to prevent detrimental effects on the environment (Department of Primary Industries, Water, and Environment, 2004).
In terms of municipal solid waste landfills, the waste deposited in these landfills generally derives from households, offices, and small businesses and they do not accept many forms of hazardous waste (Scott et al., 2005). Nevertheless, the items that originate from these seemingly benign sources often contain toxic substances. As they break down, they can release their toxic constituents into the leachate (Musson, Jang, Townsend, Chung, 2000).
Composting
On the large scale, composting involves separating out the organic decomposable material from waste, shredding or pulverising it to reduce its particle size, and digesting it through a window method (Russell, 1982: 134; Zbinden & Goodman, 2007). This decomposition of organic waste results in a humus-like substance which is primarily used as a soil conditioner (Russell, 1982: 134). On the small scale, composting is often referred to as backyard composting of biodegradable organic waste (Lah, 2001 ). Either large or small scale, the disadvantage of composting is the production of odours, harmful gases such as methane and nitrous oxide; pollution of ground water and soil; and the attraction of pests and pathogens to the area (Hobson, 2007).
Incineration
In simple terms, incineration is the burning of waste. This is a popular method in many countries such as Japan, Denmark, Sweden, and Switzerland, because this can reduce the amount of solid waste by about 80 to 90 percent (Becklake, 1991: 12). In addition, a properly designed incinerator that operates under suitable temperatures and. conditions can generate heat or electricity for the nearby areas (Lah, 2001; Price & Joseph, 2000; Russell, 1982: 135). At the present time, incineration is the only suitable method for intractable wastes and has gradually attained better efficiency and less emission of toxic residues (Chayabutra, 1994). However, incineration also has its harmful environmental impacts (Price & Joseph, 2000). Firstly, proportionately more energy is needed to produce smaller units of energy. In other· words, the resources required to install, run and maintain an incinerator will be more than half those needed to run a similar-size generator (Price & Joseph, 2001). Furthermore, for every ten tonnes of waste burned, one tonne of ash remains (Becklake, 1991: 12). This may still contain harmful materials which pollute the environment when the ash is buried in landfill sites (Becklake, 1991: 12).
Recycling
The benefits of recycling are resources conservation (eg. trees), reduced energy consumption ( eg. making paper from used paper instead of virgin timber reduces the energy used for production by almost 70 percent and requires less than half as much water), and lower water and air pollution (Pollock-Shea, 1988; Price & Joseph, 2000). In addition, recycling offers communities an opportunity to trim their waste disposal needs, and thereby reduce disposal costs and reduce the demand on the size of increasing landfill (Pollock-Shea, 1988). However, in many areas of the world, there are barriers to recycling such us prejudice against use, or post-consumer materials; and weaknesses in secondary material markets (Gandy, 1993). In other words, the economic viability of the recycling option depends largely on the availability of secondary markets for recovery products or materials (Australian Government Productivity Commission, 2006: 81; Department of Environment, Queensland, 1996; Russell, 1982: 78).
The other main challenge of recycling is that many residents are still unsure of what can be recycled and how to present items before placement in the bins. This is evidenced by the fact that many items that are not recyclable such as garden waste, ceramics etc are found in recycling bins (Christchurch City Council, 2006). In addition, the recyclable items are poorly presented such as caps and lids still attached to containers, and the containers are not thoroughly rinsed (Christchurch City Council, 2006).
2.3 The economics of solid waste
There are many different sources of funds for SWM. In general, these are positively correlated to SWM decision making that is based on a particular method for determining the appropriate price of waste management services (Bureau of Industry Economics, 1993: 32). Indeed, literature on SWM identifies an array of costs that have an important impact on the sources of funds for SWM. Morris &
of solid waste management. In similar vein, Beede & Bloom (1995) suggest several mechanisms that may affect funding for waste management. These are the effects of income and demand for environmental quality (Beede & Bloom, 1995). For instance, they assert that high-income households are likely to demand more for environmental quality than low-income households, and thus are willing to pay more for it (Beede
& Bloom, 1995). Quite differently, Bose & Blore (1993) suggest the funds for solid waste management should incorporate total costs, including the opportunity cost of landfills and the costs associated with various externalities, such as diminished neighbouring property values and environmental risk costs.
Recently, there has been consideration of the possibility of financing waste management through unit charges rather than property taxes as a means of bringing about a reduction in societal waste production. More importantly, without the unit charges for garbage, individuals do in fact perceive the marginal cost of the waste management services they receive to be zero and therefore have no incentive to change their waste production level (Ferrara, 1999).
Despite a wide array of literature pertaining to the economics of SWM, the fundamental sources of funds for SWM are generally clustered around sources such as property taxes, separate property taxes, service charge fees, can or container rental charges, special assessment and miscellaneous revenues (American Public Works Association, 1966, cited in Chayabutra, 1994). The rate bases for SWM through property tax are generally estimated by combining two or three different measures; these are generally measured by uniform charges for each service, number of rooms, dwelling, units or apartments, frequency and service provided, size and numbers of containers (Chayabutra, 1994). With regards to residential properties, service charges are usually based on number and size of containers, collection method, frequency and distance of the waste collection (Australian Government Productivity Commission, 2006: 66), whereas commercial rates are usually based on quantity, frequency of collection, kind of business, square footage or flat rate, and large container services (Bernstein, 1991).
in charges for solid waste collection are influenced by a number of factors such as the number of dwellings, the nature of the streets to be negotiated, the distance from collection area to the disposal site and the productivity of the collection crew (Bureau of Industry Economics, 1993: 51 ). In addition, metropolitan dwellers are often charged higher compared to rural residents (Bureau of Industry Economics, 1993: 63).
Within Australia, general tax revenues collected by local governments have funded SWM (Australian Government Productivity Commission, 2006: 42). The greatest tax revenue is derived from the sector that collects and transports waste (64 percent); followed by the processing, treatment and/or disposal sector (27 percent); and the collection and transport of recyclables sector (6 percent) (Australian Government Productivity Commission, 2006: 42). This general tax revenue 1s derived from both private firms and government trading enterprises (Australian Government Productivity Commission, 2006: 42).
2.3.] Charges
According to Bernstein (1991), three types of charges apply to the collection and disposal of solid waste: user charges, disposal charges, and product charges.
Disposal Charges. These charges are based on the type of waste and the
method of treatment before dumping (Bernstein, 1991). For example, incinerated and composted waste attract a lower rate than landfilled waste (Bernstein, 1991 ), because it is necessary to treat landfilled waste for leachate emission and other environmentally harmful polluters.
Product charges. Most product charges on waste have applied to
non-retumable containers, lubricant oils, plastic bags, fertilizers, tyres, and feedstock (Bernstein, 1991). Special charges and taxes that compose these product charges are often levied on these polluting products to influence firms or households' behaviour, aiming at either reducing the quantity produced, or at decreasing the amount of effluents (Bernstein, 1991; Morage-Gonzalez & Padron-Fumero, 2002). For instance, in Sweden and Norway, product charges are applied to batteries, fertilizers, and pesticides (Morage-Gonzalez & Padron-Fumero, 2002). However, most product charges systems lack actual incentive impact because they rely heavily on direct monitoring and regulation by government (Bernstein, 1991).
2.4
Summary
Chapter 3: Solid Waste Management in Australia
3.1
Overview of solid waste management in Australia
Like many developed countries, Australia has become increasingly concerned about the relationship between environment and development. These concerns are based on the fact that several important environmental issues are land-use related and are tied to growth (Chinitz, 1990; O'Gallagher, 1990: 1). Specifically, Australia is now at a stage where SWM choices are fast becoming as important a competitive development factor among communities as water management, reliable electricity, sewer capacity, buildings, and other infrastructure (Beranek, 1992; Keen & Mercer, 1993). In this context, good SWM choices and management have become major foci of development, particularly within the context of sustainable development (Keen & Mercer, 1993).
Along with the growing urban population in Australia in recent years, waste generation has grown rapidly (Qian & Burritt, 2007). It is estimated that more than 26. 7 million tonnes of solid waste is collected and disposed of in landfills each year nationwide (Australian Bureau of Statistics, 1998). More startling is the fact that the study suggests that Australia's level of solid waste generation per capita is one of the highest in the world (Environment Australia, 2001 cited in Qian & Burritt, 2007). Given the limited capacity of the ecosystem and environmental impacts of solid waste disposal on the ecosystem, the increasing quantities of waste have become a critical problem challenging sustainable development (Qian & Burritt, 2007).
Stemming from that notion, this chapter briefly explains the SWM strategies adopted in Australia, followed by policy and regulatory frameworks that are related to these strategies, and lastly the role of local government in planning and managing solid waste in Australia.
3.2
Solid waste management strategies in Australia
As mentioned earlier, the philosophy for SWM in Australia adopts a waste hierarchical approach that focuses on avoidance, recycling, energy recovery and lastly disposal. In this approach, a proper strategy for SWM for individuals, businesses, and communities is one that addresses as much of the solid waste at the highest level on the hierarchy as possible (Rubick, 1991: 2). Indeed, the presumption underpinning the waste hierarchy is that the environmental costs are generally lower if waste is avoided altogether and higher when waste is disposed to landfill (Ackerman, 2005: 2). Having said that, according to Beranek (1992), options that are successful in one country may not be successful in another due to economics or other social factors such as prevailing allilutles (Beranek, 1992). Therefore, the purpose of this section is to critically examine each option in Australia and its strengths and weaknesses in the Australian context.
3.2.1 Waste avoidance
appropriate packaging and reusable or refillable products (Environment Australia, 1997: 50). The strength of this method is that it is the best way to achieve sustainable SWM as it can prevent many negative environmental impacts of SWM compared to other methods such as landfilling.
However, success in terms of implementing this strategy is hard to quantify because of there being so many reasons for waste stream fluctuation and also because it is hard to measure the success rate of 'educating' communities about waste avoidance (Beranek, 1997). Indeed, according to the Australian Government Productivity Commission (2006: 147), in order to maximise net benefits to the community, SWM policy should be guided by rigorous analysis of the financial, environmental and social costs and benefits, not by the simple priorities suggested by the waste hierarchy. In other words, without any measurable standards or benchmarks, waste avoidance strategies can be viewed as aspirational targets at best, as opposed to legally binding regulations. Therefore, it is difficult to assign accountability to the parties involved, as well as consequences for targets not being met (Australian Government Productivity Commission, 2006: 154).
In short, the zero waste targets tend to be aspirational goals or arbitrary targets rather than strategic and comprehensive strategies. More importantly, in Australia, the evidence shows that chasing this zero waste target has a very high cost and is technically, financially and administratively complex (Australian Government Productivity Commission, 2006: 150). Therefore, in Australia, this approach is not widely endorsed compared to other SWM strategies.
3.2.2
Waste reduction
According to Environment Australia (1997: 53), waste reduction refers to changes to a product or process that reduce the amount of waste produced, that is, situations where it is not viable to avoid the production of some waste. In Australia, some identifiable examples of waste minimisation include:
15% less material than the original product which was introduced in 1978
(Rubick, 1991: 31).
• The glass industry is constantly responding to this challenge as well. In Australia, the 'stubby' beer bottle produced by ACI Glass Packaging weighed 260g in 1980 but only 170g in 1990 (Rubick, 1991: 31 ).
• Various councils have adopted differential pricing strategies across Australia. These initiatives are mainly based on the justification from research by Recycle NSW in 1993 that indicates that larger garbage bins resulted in more waste being diverted into the bin (Litter and Recycling Research Association, 1993). These initiatives include (Environment Australia, 1997: 54):
- Pay by volume- Charging households according to the size of bin they select.
Bag or tag systems- Similar to volume based systems, but the charge levied relates to actual volume generated rather than the volume available.
Pay by weight- Charging households based on the weight of waste collected.
Rebate systems- Householders pay for a standard service level and then receive a rebate (reward) for using the service less often.
However, the main disadvantage of these strategies is they are not easy to implement. This is because the options available need to be balanced against other criteria such as community expectation, type of waste, incidence of illegal dumping, and other problems such as 'stomping' on bin contents (Environment Australia, 1997: 53). Indeed, to cite one example, the Australian Government Productive Commission (2006: 145) states that solid waste such as glass, plastics and aluminium and ferrous metals is largely inert in landfills and is not a significant contributor to leachate, therefore produces few or no externalities in landfill. Therefore, seeking to move such waste 'up the hierarchy' would impose net costs on the community if additional costs incurred by disposers are not offset by the benefits of reduced environmental externalities (Australian Government Productivity Comission, 2006: 146).
guide waste management policies (Australian Productivity Commission, 2006: 143). The reason is that strict adherence to the waste hierarchy list of preference can lead to waste management outcomes that are unsuitable for the circumstances, costly to the community, and risk circumventing the study of all relevant costs and benefits required in order to develop sound SWM policy (Australian Productivity Commission, 2006: 143).
3.2.3 Waste recycling
Recycling is the process of converting products back into their constituent raw materials and then reprocessing this raw material into new articles (Environment Australia, 1997: 63). The impetus for recycling is the need to conserve natural resources and to protect the environment (Institution of Municipal Engineers, 1991: 11 ). As mentioned earlier, however, different properties of various materials determine their suitability for recycling, as not all materials can be recycled indefinitely (Pollock-Shea, 1998). In some cases, recycling reduces the quality of a material, so it is not always possible to yrodu1,;t: lht: same arlicles that are provided from the source material (Organisation for Economic Co-operation and Development, 1983: 20). In addition, recycling success is also determined by the fact that recycling cost does not outweigh the anticipated benefit, and demand exists for the finished product (Institution of Municipal Engineers, 1991: 11; Pollock-Shea, 1998). In other words, councils must first seek a reliable outlet for the products of recycling and establish that the required standards of cleanliness, consistency and absence from contaminants are achievable within the collection routines to be adopted (Institution of Municipal Engineers, 1991: 11 ).
In Australia, although the recycling rates have increased over the years, research by Harrison Market Research (2005), suggests that the recycling program in Australia is one of the most successful in Organisation for Economic Cooperation and Development (OECD) countries. The main contributors to this success are the Australian public's perception of the importance of recycling activities and the strength of market demand in Australia and internationally for recovered materials compared to virgin materials (Australian Bureau of Statistics, 2003). In addition, the use of a marketing network has proven very successful in developing markets for recycled materials in Australia (Nicholson, 2005). These marketing networks consist of members with common goods and/or services and facilitators that assist in the development of new and existing markets for the members' products (Nicholson, 2005). These marketing networks (in essence, also the recycling companies), with the support of local governments, have created the demand for recovered materials both locally and internationally by driving the prices of recovered materials below the virgin materials (Australian Government Productivity Commission, 2006: 24). Also, with the support of local governments, recycling companies have thrived, with operations ranging from recovery of cardboard and glass to organic waste and oil (Environment Australia, 1997: 64). Having said that, the success of recycling also needs to be balanced by the location of recycled products and the stability of recycling markets (the main contributing factors) (Environment Australia, 1997: 67).
3.2.4 Energy recovery
Commission, 2006: 33), the growth in landfill-gas capture has occurred due to government incentives, regulatory requirements promoting the generation of electricity from renewable sources, attempts to reduce greenhouse gas emissions from landfills, and commercial incentives (Department of the Environment and Heritage, 2005).
3.2.5 Waste disposal
In Australia, the current state of technology an4 comparative cost of alternative methods to landfill suggest that approved and managed landfill is the most appropriate means of solid waste disposal (Australian Government Productivity Commission, 2006: 68). More than 90 percent of all solid waste generated in Australia is disposed of in landfill (Scott et al., 2005). In 1993 it was estimated that each year more than 14 million tonnes of refuse, representing 95% of the total, is disposed of in Australian landfills (Scott et al., 2005). By 1996-1997 this had increased to 21.2 million tonnes, 33 tonnes corresponding to a per capita disposal of 1.1 tonnes per year and placing Australia among the highest 10 solid waste generators within the OECD (Scott et al., 2005). However, the amount of waste disposed to landfill in Australia as a proportion of total generated, appears to have fallen (Australian Government Productivity Commission, 2006: 68). For example, landfill-disposal rates decreased from 60 percent to 45 percent and 67 percent to 27 percent respectively, in Victoria and the ACT between 1994-95 and 2004-05; potentially for the same reasons that recycling rates have increased (Australian Government Productivity Commission, 2006: 31).
Productivity Commission, 2006: 68). Indeed, the Environmental Guidelines for Solid Waste Landfills and Industrial Landfilling (EPA NSW, 1996) describe the benchmark procedures for the proper management of solid waste in landfills as follows:
a. Lining and capping. Lining of a landfill bed cell is usually accomplished using an impervious material such as compacted clay and/or artificial liners such as high-density polyethylene. Some authors have estimated the life-span of this lining to be up to a century (Baccini, Henseler, Figi & Belevi, 1987; Christensen, 1989: 20). However, more recently, a report by Van Moorst (1996) indicated that some liners have been found to fail after only several years, possibly due to the environment and soil conditions. Therefore, within Australia, there is a call to extensively investigate the current measures of liners in order to prevent the release of contaminants into the environment in the long term (Scott et al., 2005). Capping involves placing a layer (usually of material similar to the liner) over the filled landfill to minimise the _infiltration of rainfall or surface water. The main purpose of the cap is to maintain a
'dry' environment within the cell and prevent the generation of leachate.
b. Layering. Layering involves placing the waste in a series of layers of nominal thickness, covering each layer (daily) with clean soil. Layering improves waste compaction and reduces the problems with odours and vermin and decreases the infiltration of precipitation.
c. Compaction. The primary aim of compaction is to reduce waste volume. Compaction does have an influence on other landfill characteristics such as leachate generation, liquid and gas permeability, and decomposition rate (Scott et al., 2005). Canziani & Cossu (1989 cited in Scott et al., 2005) reported that the extent of compaction can significantly reduce leachate volumes.
3.3. Solid waste management issues in Australia
As detailed earlier, a waste management hierarchy is utilised within the Australian context. In terms of this waste management hierarchy, the main challenge that faces the governments is how it can convince various stakeholders such as industries and communities to adopt more acceptable waste management practices (O'Gallagher, 1990: 65). In other words, a fine balance of the "stick" approach to legislation and its associated penalties and the "carrot" approach of providing incentives for various stakeholders to regulate themselves must be attained in order to achieve sustainable development and management of solid waste policies and strategies (O'Gallagher, 1990: 65).
3.4
Australian policy and legislative frameworks for solid waste
management
In Australia, as elsewhere, traditionally waste management was concerned with any potential adverse outcomes of putrescible waste on public health (Scott et al., 2005). From the early 1970s, the public has become increasingly concerned with the effects of pollution on the environment, and eventually this concern has extended to the management of solid waste (Australian Government Productivity Commission,
2006: 45).
Environmental policy and legislation is a state responsibility in Australia (Hubick, 1991: 122). In essence, solid waste management is mainly under the jurisdiction of each state in Australia. However, many of the policy responses currently in place in the states have their origin in two key national policy initiatives adopted in 1992: the National Waste Minimisation and Recycling Strategy (NWMRS) and the National Kerbside Recycling Strategy (NKRS) (Australian Government Productivity Commission, 2006: 46).
3.4.1 National Waste Minimisation and Recycling Strategy
(NWMRS)
NWMRS (Australian Government Productivity Commission, 2006: 47). These schemes place greater responsibility on producers for recovery or disposal of specific goods. Extended producer responsibility (EPR) involves policies that make producers (at least partially) responsible for waste treatment and/or disposal of their products or goods (Lindhqvist, 2000). The responsibility assigned to producers does not make it necessary to physically take back goods and process or dispose of them, rather, producers could be made responsible for financing such activities by others (Australian Government Productivity Commission, 2006: 260). Within Australia, although some agencies questioned the efficiency of just targeting producers, given that many parties are involved in a product's life cycle, many local governments do favour EPR (Australian· Government Productivity Commission, 2006: 260). The most common initiatives practised within Australia are take-back requirements and deposit refunds such as those on beverage containers under the container deposit legislation prescribed in the Environment Protection Act 1993 in South Australia (Environment Protection Authority SA, 1998).
3.4.2 National Kerbside Recycling Strategy (NKRS)
3.4.3 State and Territory Government solid waste management
policies and legislations
As alluded to earlier, the NWMRS and NKRS were the guiding policy framework for the states and territories throughout the 1990s and have resulted in most states and territories subsequently introducing new SWM legislation and strategies (Australian Government Productivity Commission, 2006: 60). Key legislation, strategies and governance bodies that are related to both waste minimisation and landfilling for both the New South Wales state government and the Tasmanian state government (by way of comparison) will be illustrated in table 3.1 and table 3.2, respectively.
Table 3.1: Key legislation and selected waste minimisation strategies for the New South Wales and the Tasmanian Government, a case of comparison (adopted from Australian Government Productivity Commission, 2006: 51 ).
~
New South Wales Tasmania
Waste • Waste Avoidance and •Guide to Industrial Waste minimisation Resource Recovery Strategy Management
strategies 2003
•Waste Reduction and Purchasing Policy
Legislation • Protection of the • Environmental Management Environment Operations Act and Pollution Control Act
1997 1994
[image:50.566.95.522.414.650.2]Table 3.2: Legislation, regulations and guidelines relating to landfill for the governments of New South Wales and Tasmania, a case of comparison (adopted from Australian Government Productivity Commission, 2006: 175).
New South Wales Tasmania
Acts and • Protection of the • Environmental
regulations Environment Operations Act Management and Pollution
1997 Control Act 1994
• Protection of the • Environmental
Environment Operations Management and Pollution (Waste) Regulation 2005 Control (waste
management) Regulations 2000
Landfill • Environmental impact • Landfill sustainability guide guidelines statement (EIS) guideline: 2004
Landfilling 1995
•Environmental guidelines: solid waste landfills 1996
Government • Department of Environment • Department of Primary
authorities and Conservation Industries, Water and
• Department of Planning Environment