Published in: International Journal of Fatigue, 29 (2007) 565-574
An effective method to investigate short crack growth
behaviour by reverse bending testing
N. Gao a,*, M. W. Brown b, K. J. Miller b, P. A. S. Reed a a
Materials Research Group, School of Engineering Sciences, University of Southampton, Southampton, SO17 1BJ
b
Department of Mechanical and Process Engineering University of Sheffield, Sheffield S1 3JD
Abstract
A reverse bending rig has the advantage of relatively cheap construction compared
with servo-controlled machines, and its robustness and reliability make it ideally
suited to long-term testing programmes. In this paper, the details of the mechanical
mechanism of a bending rig, the methods of its strain measurement and stress-strain
analysis have been presented. A series of tests has been carried out to investigate short
crack growth behaviour of AISI type 316 stainless steel under creep-fatigue
conditions at 550o . The advantage of this type of test allows a comparison to be
made, on one specimen, of the influence of both tensile and compressive hold periods
on crack growth behaviour. It has been shown that predominantly intergranular long
cracks form on the tensile side and transgranular short cracks on the compressive side
and these are a prominent feature between 0.9 – 2.5% strain range. C
Key words: Creep-fatigue, Short crack, Crack coalescence
*
1. Introduction
Materials subjected to high temperature service are usually exposed to complex
strain-time histories and experience differing damage modes. Creep damage, which is
a time-dependent process, depends primarily on the history of stress and temperature
applied to the component; whereas fatigue damage is generated by the cyclic stress
and depends primarily on time-independent plastic strain. The imposition of one form
of damage is also known to influence the other. When the two damage components
act in a combined manner, a creep-fatigue interaction develops [1,2,3]. The basic
reason for the creep-fatigue effect can best be understood by detailed consideration of
the stress-strain pattern involved during cycling with a tensile hold period. During the
tensile hold period, stress relaxation occurs at a range of strain rates, similar to those
encountered during creep testing, and produces an additional amount of tensile strain
to that produced from fatigue cycling. Although this additional strain, which is given
by the amount of stress relaxation divided by Young's modulus, is less than 0.1% per
cycle, it has a drastic effect on the life [4].
Many service conditions result in creep-fatigue damage. For example, the current high
price of fossil fuels and the increased use of large nuclear plant for base-load electric
power generation have resulted in increased shift operation of fossil-fired plant.
Between start-up and shut-down there is a period of on-load running. The material at
the surface of a stress concentrating feature may be at constant strain during this
period, and stress relaxation will take place by creep. Similar types of situation arise
also in steam turbine components, pressure vessels and gas turbines. To design any of
these components for satisfactory operation requires an understanding of the
mechanisms which occur in the fatigue processes. In particular, the
deal of attention because of their various applications in the power generation industry
and particularly the nuclear industry.
In 1961 Forrest and Penfold [5] first reported on a reverse bending fatigue machine
which they had developed for thermal fatigue testing. A bar specimen of rectangular
cross-section was bent through a predetermined angle of deflection, producing
alternating strain on the top and bottom surfaces of the specimen. In 1963 Forrest and
Armstrong [6] reported on strain controlled fatigue tests performed on Nimonic alloys
using a number of these reverse bending machines. A large number of machines were
later built within the UK for the testing of power plant materials [7,8,9].
Subsequently there have been substantial developments in uniaxial push-pull fatigue
testing and most tests are now performed on such machines. Until now, most
information from reverse bending tests are related to long crack investigation and
there is still limited information available on short crack investigation using reverse
bending rigs in the literature, although reverse bending machines are of particular
benefit in creep/fatigue tests [10,11,12]. Fully reversed bending creep-fatigue tests
can be performed on a displacement controlled high temperature bending rig. Its
relatively cheap construction compared with servo-controlled machines together with
its robustness and reliability make it ideally suited to long-term testing programmes.
When a hold time is introduced into a bend specimen, one side is subjected to a
tensile hold period, while the opposite side experiences a compressive hold period.
Thus this type of test allows a comparison to be made, on one specimen, of the
influence of both tensile and compressive hold periods on crack growth behaviour
[13,14].
This paper first addresses the mechanical mechanism, the methods of strain
investigation of short crack growth behaviour in AISI type 316 stainless steel under
creep-fatigue conditions is presented, which shows that reverse bending testing is an
effective method to study both tensile and compressive effects on this failure
phenomenon simultaneously.
2. Reverse bending rig
majority of time relay requirements on the control panel of the rig, permitted dwell 2.1 Mechanical mechanism of the bending rig
A schematic view of the mechanical mechanism of the bending rig is shown in Fig. 1.
A full description of the rig can be found in Ref. [15,16], and only a brief
introduction is presented here. The test specimen was clamped by two horizontal
cross shafts made of type 316 stainless steel using removable clamping plates. It was
strained in pure bending by rotation of the cross shafts about their axes. The
development of a net tensile stress in the specimen during bending was avoided by
allowing one of the cross shafts to move horizontally in slots as well as to rotate. Both
cross shafts were connected to cross beams by means of a pair of lever arms. Two
loading arms were fixed on the cross beams at one end of the specimen and connected
via bearings eccentrically on two pulleys on the other end. The drive for the rig was
provided by a D. C. motor, having a 2,000 r.p.m. maximum speed, connected to one
of the pulleys through a reduction gear box, and this movement was then transferred
to the second pulley via a chain. Therefore, when the same eccentricity was provided
on each pulley, equal and opposite angular movements can be applied to a specimen.
To prevent accidental damage to the machine in the case of a specimen fracture, a
safety microswitch was set on one end of the cross shaft which would cut off the
periods from 9.99 seconds to 99.9 hours thereby making wide-ranging creep-fatigue
tests possible.
2.2 Strain measurement and furnace
The specimen bending moment was obtained from a load cell on one of the vertical
loading arms. The load cell output readings in the form of DC voltage were monitored
continuously by a digital multimeter and a chart recorder. Hysteresis loops were also
plotted at intervals throughout the tests. The plotter was calibrated periodically with a
digital voltmeter. Control of specimen strain was achieved by adjusting manually the
eccentric radii of both pulleys, which were fitted with scales to record the required
values of angle of bend φ for different strain amplitudes, where
φ= −
Sin 1[ (Eccentric radius of pulley) / (Length of moment arm) ] (1)
Here the eccentric radius set on the pulley is equal to the amplitude of vertical
displacement in either upward or downward directions, and the length of the moment
arm is the distance from the centre of the lever arm bearings to the centre of the cross
beam. A full description of the strain measurement and bend geometries can be found
in Ref. [15]. The displacement signal from a linear displacement transducer was
recorded continuously by a digital multimeter and a chart recorder and was drawn
periodically by an X-Y plotter. The values of strain for the specimen can be calculated
by a simple geometrical relationship equation from the values of angle of bend.
The specimen was heated by a horizontally mounted split 5 kW electric furnace. The
minimise heat loss. A thermocouple, sheathed in a stainless tube, was fixed to the
specimen to monitor continuously the temperature of the furnace. The thermocouple
was connected to a microprocessor based Eurotherm controller which can
automatically monitor and maintain the set temperature, and display the measured
value of the temperature in digital form. On average, the temperature along the
specimen length was uniform and the difference between separate thermocouple
readings and the Eurotherm readings was within ±3oC.
2.3 Stress-strain analysis
Cylindrical specimens with a total gauge length of 153 mm and a diameter of 10 mm
were employed. The clamping zones at both ends of the specimen were made flat in
order to hold the specimens rigidly in the rig grips. Consider a round cross-section
specimen subjected to a reversed bending moment M and assume that the original plane sections remain planar under bending. The amplitude of surface strain at a
distance y from the neutral axis of the specimen is given by
ε=2φy
L (2)
where φ is the angle of bend and is the specimen gauge length. The maximum
surface strain for a round bar of radius L
r is, therefore
ε=2φr
The total bending moment, taking into account the symmetrical contribution to the
bending moment of the sections above and below the neutral axis is
∫
−= r y r y dy
M 0
2 2
2
2 σ (4)
Because of the stress-strain behaviour, the material follows a power law
σ=k( ) ε n (5)
expressing the stress in terms of its equivalent strain from equations (2) and (5) gives
dy y r y L k
M r n
n
∫
−⎟ ⎠ ⎞ ⎜ ⎝ ⎛
= +
0
2 2 1
2
4 φ (6)
Substitution of Sinθ =
(
y r)
in equation (6), the maximum bending moment on thesurface is expressed as
(
)
(
)
[
θ θ]
θσ π Sin Sin d
r
M =
∫
2 +n − +n0
3 1
max 3
where σmax is the maximum surface tensile stress. The integration can be computed
numerically by the Simpson rule and the maximum surface stress can be calculated,
for a known hardening exponent n, as follows
(
)
(
)
[
]
∫
+ − += 2
0
3 1
3 max
4 π θ θ θ
σ
d Sin
Sin r
M
n
n (8)
3. Experimental procedures
The material used in this experimental investigation was austenitic AISI type 316
stainless steel (0.049C-0.54Si-1.36Mn-17.26Cr-11.20Ni-2.15Mo, wt%) which was
supplied by the Electric Power Research Institute in conjunction with the USA
Nuclear Regulatory Commission in the form of 16 mm thick solution-treated hot
rolled plates. The material was tested in the as-received condition, i.e., solution
annealed at 1050oC for 30 minutes and then water quenched. Microstructural analysis
showed an equiaxed austenitic structure with an average grain size of 40 microns [16].
In considering the nature of reverse bending tests, a simple specimen design is
important. However the previously used rectangular bar [11,17] in bending
experiments brings the problem of achieving a well-polished specimen surface; which
is critical for carrying out a short crack study via replication. A rectangular bar can
not be polished mechanically along its entire length, and requires an electropolishing
method. As a result, a lot of polishing pits may occur within the material matrix.
These pits in turn become favoured sites for first stage cracks to initiate and grow and
subsequently influence the observation of cracks and the estimation of life. Therefore,
mm was adopted in this study so that mechanical polishing was much easier, and
obviated the introduction of electropolish pits. The cylindrical specimens were
machined by fine turning and an allowance of 0.05 mm was left to permit polishing in
order to get the final shape and dimensions of the working section. The polishing
procedure mainly involved two steps. In the first step coarse polishing was
accomplished by using emery papers with increasingly fine grit, i.e. 280, 400, 800 and
1,200 sizes. The second step was completed by cloth polishing using diamond pastes
of 25, 6 and 1 microns respectively. A final scratch-free, mirror-finish surface was
obtained.
The choice of a particular definition of failure is usually linked to the service
application of the material but is also frequently influenced by experimental
convenience. The definitions of failure commonly used at present include: (a) final
fracture of the specimen into two pieces; (b) the observation of a certain size of crack;
(c) a chosen percentage decrease in the value of the maximum stress; (d) a chosen
percentage deviation of the curve of maximum stress versus cycles from the
extrapolated cyclic hardening or softening behaviour; (e) the earliest identification of
the formation of a cusp in the hysteresis loop. Final fracture of the specimen is the
simplest and most frequent definition used in the past for reverse bending tests.
However, for displacement or strain controlled bending tests, where there is a stress
gradient, final fracture of the specimen may not occur for a long time, even though the
specimen is badly cracked and unable to carry a significant load. The observation of a
fatigue crack of a certain size has been used as a criterion of failure in some
experiments [18], but under elevated temperature testing when the specimen is
enclosed in a furnace, a certain size of crack is difficult to monitor continuously. The
because a cusp cannot be achieved with confidence until the cracked area has reached
between 10% and 20% of the specimen section. The criterion that is probably among
the more sensitive to the onset of significant cracking, and that most conveniently
takes account of changes in the stress-strain response of the material due to strain
hardening or softening is that contained in definition (d) above [19]. Therefore, a
failure criterion of 5% decay in the stabilised value of bending moment was used in
these experiments. The type 316 stainless steel showed cyclic hardening at the
beginning of the tests. This was followed by a period of slow but steady decay, which
ended with a fast load decay due to macro-cracking. By drawing a straight line 5%
below and parallel to the steadily decaying line, the point of intersection of the
parallel line with the eventual rapid load decay curve gives the creep-fatigue
endurance Nf [16].
The creep-fatigue tests were performed isothermally on the high temperature bending
rig in air at 550 under a fully reversed bending condition at a constant strain rate of
. Test strain ranges from 2.55% to 0.92% yielded lifetimes from 200 to
1,500 cycles respectively. A dwell period of 60 minutes was introduced at the
condition of maximum cyclic strain with the help of the multifunction digital timer
fitted in the rig. To collect crack growth data, replicas were taken throughout the
creep-fatigue tests for each specimen by interrupting the tests, removing the top of the
furnace and cooling down the specimen to room temperature, by using an air blowing
fan. In order to assess the effect of a rest period introduced when taking replicas at
elevated temperature, some additional continuous creep-fatigue tests were also
performed at the same strain ranges as the interrupted tests.
oC
1
1 10× −3s−
The surface of the specimens was cleaned by acetone to remove loose oxides before
carried out using cellulose acetate sheet of 35 microns thickness, together with
acetone spread over the specimen surface. The specimen remained in the rig for the
whole duration of the test. The acetone causes replicas to wrap around the specimen
by surface tension and no pressure is required. Each replica was left for about ten
minutes to dry out completely, then removed from the specimen surface and mounted
flat on a microscope glass slide for subsequent microscopical examination. In the tests
large acetate strips with an area of 55 mm × 20 mm were applied at both ends and in
the middle along the gauge length of the specimens when the upper (tensile) surface
was held under maximum strain. In this condition the cracks on the upper surface
were fully open, and at the same time the cracks on the bottom compressive surface
were closed. The whole area of both the upper and the lower surfaces of a specimen
was covered by six replicas to collect all crack data. This is necessary in the case of
bending tests as the bending moment is constant along the gauge length and therefore
cracks are able to initiate and grow anywhere within the working gauge section. The
same process was repeated at least twice in case of bubble formation under the acetate
sheet, which could damage crack information on the replicas. The cracks on the
replicas were measured from one tip to the other along the whole crack profile. Their
length is defined as surface crack length . This process was carried out by using an
in-house REPAN image analysis system. This system consists of a high resolution
4. Experimental results
4.1 Strain-endurance
All the tests were conducted above the fatigue limit of this material (Δεfl =0 38. %)
ΔM =62 97. (Δ )0 275.
with values of the total strain range being from 2.55% to 0.92% at 550 C with a one
hour hold time in each cycle. These tests were continued until a 5% change in the
stabilised value of bending moment was detected. The total number of cycles at this
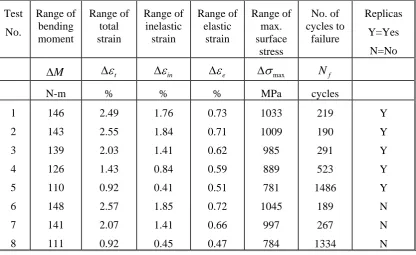
point is defined as the fatigue life of the specimens. Results from these
creep-fatigue tests are summarised in Table 1. Regression of these test data in terms of angle
of bend and bending moment gives the following power law equation:
o
φ (9)
Similarly, a best-fit line can be obtained by regression of the test data in terms of
maximum surface stress and total strain range:
Δσ Δε .
( )
=2831 t 0 273 (10)
max
Regression of all data points yields the following Coffin-Manson equation in terms of
inelastic strain range:
Δεin(Nf) .
. 0 741
0 919
In the same way, by using the elastic strain range, the endurance curve can be
represented by the following Basquin type equation:
Δεe(Nf) .
. 0 186
0 0188
= (12)
Equations (11) and (12) may be combined into a more useful endurance equation in
terms of total strain range:
Δεt =0 0188. (Nf)−0 186. +0 919. (Nf)−0 741. (13)
The results of continuous creep-fatigue tests, listed also in Table 1, show that the rest
periods for taking replicas, which took about eight hours for each interruption
including cooling and reheating, do not produce a significant effect on creep-fatigue
life of specimens. It was also confirmed that these interruptions did not affect the
fatigue life [20]. Therefore it is believed that the results of creep-fatigue tests with the
replication process can be used to represent the real un-interrupted creep-fatigue
condition in explaining changes of lifetime and crack growth behaviour.
4.2 Crack growth behaviour
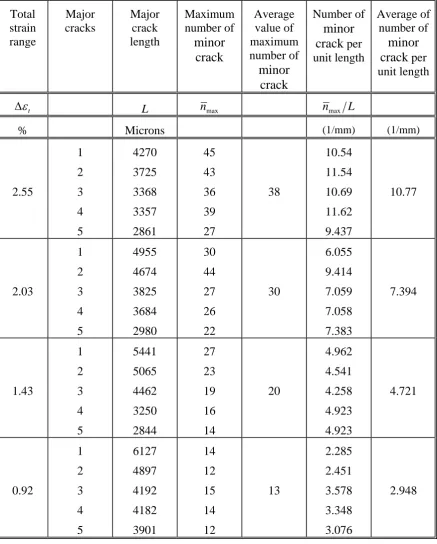
Since a major surface crack at failure has been found to form by the linkage of many
individually initiated minor cracks, its net length is defined as the sum of lengths of
all individual minor cracks involved. For each specimen five dominant major cracks
were measured separately. The number of minor cracks in each main crack and the
can be seen how the number of minor cracks changes with the changes in the total
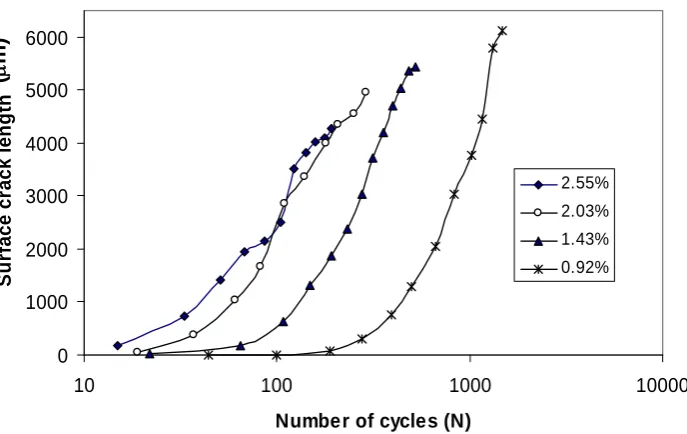
strain range. Comparing the crack growth curves of the longest major crack at each
strain range, it shows that the final crack length tends to be longer with a decrease of
strain range (Fig. 2).
The observations of minor crack growth indicate that minor cracks individually grow
and subsequently coalesce, and their behaviour determines the overall behaviour of
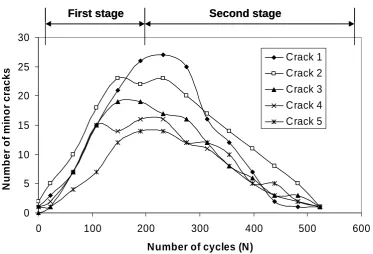
the major crack and also determines the life of specimens. The number of minor
cracks varies with the change of number of cycles and a change of total strain range.
Fig. 3 illustrates that the number of minor cracks contributing to a major crack first
increases and then decreases with increasing number of cycles at 1.43% strain range.
In fact, this indicates a two stage process of crack growth. In the first stage, individual
minor cracks initiate and grow without linkage; this can be considered as first stage
crack growth. In the second stage, these individual minor cracks have gradually
grown long enough to meet each other, and the linkage process occurs and is
enhanced with increasing number of cycles, so the number of minor cracks decreases
until finally a major crack is formed from a certain number of minor cracks.
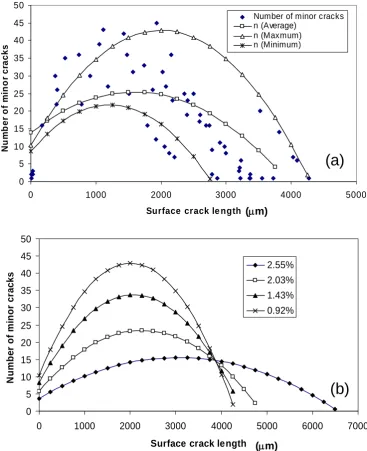
By plotting curves of number of minor cracks n against surface crack length as, a parabolic pattern is found similar to the curves of number of minor cracks versus
number of cycles. This means that the number of minor cracks could be described by
some mathematical equations in terms of surface crack length and strain range.
Considering the number of minor cracks in five major cracks at each strain range,
three curves can be deduced and described relative to the average number of minor
cracks nave, maximum number of minor cracks nmax and minimum number of minor
nave= A1+B a1 s+C a1 s2 (14)
nmax = A2+B a2 s+C a2 s2 (15)
nmin = A3+B a3 s+C a3 s2 (16)
Thus, a series of parabolic equations can be obtained for the different strain ranges.
The regressions of constants "...; ... and C ... in equations (14) for different strain ranges produces a parabolic equation expressing the average
number of minor cracks n as a function of surface crack length a
A A A1, 1, 1 '
B B B1, 1, 1
' " "
C C
1, 1, 1 '
ave s and total strain
range Δεt. Similarly, the maximum number of minor cracks n and minimum
number of minor cracks n
max
min also can be derived by the same method. In general, they
are expressed as follows:
nf a f t f t as f t s
t s
(ε, ) = 1( ε )+ 2( ε ) + 3( ε )a
2
Δ Δ Δ (17)
The regression curves of average, maximum and minimum numbers of minor cracks
at 2.55% strain ranges from equations (17) are represented in Fig. 4b. A comparison
of the maximum number of minor cracks clearly shows that the number of minor
cracks increase and the crack length decreases as a result of increasing the strain
4.3 Crack morphology
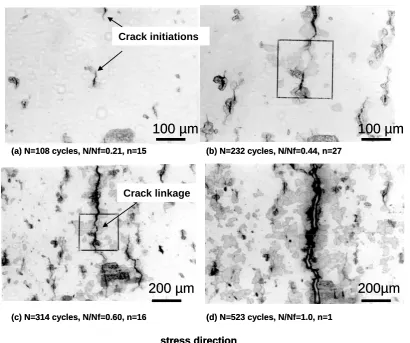
The processes of minor crack linkage on the tensile side of the specimens when
forming major cracks are clearly illustrated in a series of photographs of Fig. 5
obtained by light microscopy. It demonstrates that these individual minor cracks
initiate always on oxide patches, indicating that oxide damage may assist Stage I
cracks to initiate. Only a few minor cracks initiate from inclusions. It is seen that the
higher the total strain range, the higher the density of minor cracks. Following the
whole process of crack growth it is found that most cracks, which are around the
dominant crack, do not grow very much with an increase of creep-fatigue cycles and
they keep within the range of a few grain sizes (see Fig. 5c-d). This result proves that
microstructural barriers may play an important role in the current creep-fatigue tests
although shielding effects from the dominant crack are also likely to be significant. As
seen in Fig. 6, most cracks on the tensile side of the specimens initiate from grain
boundaries. Cracks propagate along a zigzag path, generally following grain
boundaries and occasionally propagating in transgranular form. A few wedge cracks
were found ahead of some crack tips, as shown in Fig. 6, which may suggest that a
creep effect is produced at the crack tips by the introduction of hold time.
Because the cracks on the compressive side were always closed either when the
creep-fatigue tests were under a hold period, or when the tests were interrupted to take
replicas, it was difficult to detect details of cracks on replicas taken on the
compressive side. Carefully checking the replicas, especially the replicas taken at later
stages of creep-fatigue life, it has been found that the cracks on the compressive side
have a different morphology from the tensile side. Most cracks observed on replicas
of the compressive side initiate from the matrix, and only a few of them appear to
short, generally of a length of one or two grain sizes, only a few grow a little longer.
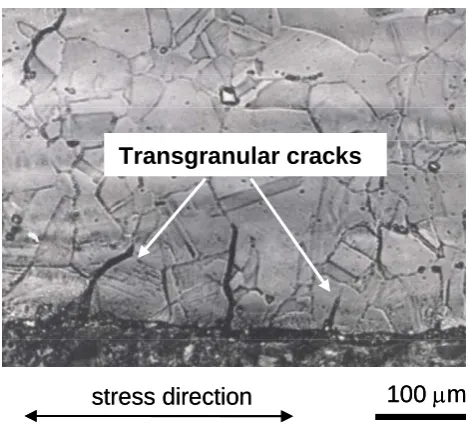
In contrast to the tensile side, most of the cracks on the compressive side initiate and
grow transgranularly, and only very few initiate intergranularly (Fig. 7). Their depth
is also within one or two grain sizes and these short, transgranular cracks generally
have blunt ends.
5. Discussion
5.1 Crack growth behaviours
The initiation and growth behaviour of individual minor cracks in Stage I and their
subsequent coalescence in Stage II is the dominant characteristic during the failure of
these specimens under the current creep-fatigue bend tests. The process of crack
linkage has been observed in a 316 stainless steel during continuous fatigue cycles at
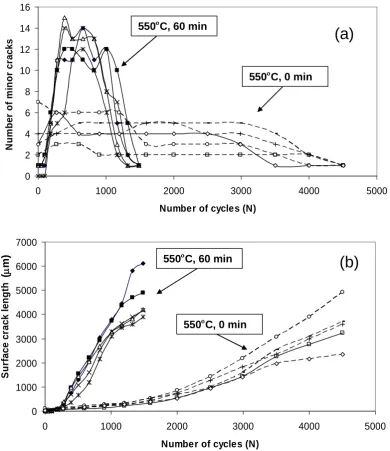
550oC [15]. The curves of the number of minor cracks against the number of cycles
N are compared in Fig. 8a for fatigue and creep-fatigue cycles at 550oC under 0.92 %
strain range. An obvious increase of the number of minor cracks is seen to be due to
hold time. This is in agreement with the results which demonstrated that the number
of cracks increase both with dwell duration and strain range [21]. Also, all curves in
Fig. 8a possess the parabolic pattern showing that individual minor crack growth and
then coalescence occurs under fatigue and creep-fatigue cycles in the same way. As
expected, plotting together the as−N curves of both fatigue and creep-fatigue conditions at the same strain range of 0.92% (Fig. 8b) indicates an increase of crack
growth rate and a decrease of life due to the effect of temperature and time
As seen in Figure 6, most of the distributed surface cracks on the tensile side initiate
and propagate along grain boundaries. Some research work has investigated crack
morphology on the tensile side and the compressive side respectively of bending
beams under creep-fatigue conditions [11,22]. Crack growth from the compressive
side was transgranular, whereas for the tensile side, it was predominantly
intergranular when testing two types of 316 steel plates. These results are in
agreement with the present experimental results. Both outcomes indicate that
creep-fatigue in tension is more damaging than in compression because the intergranular
long cracks on the tensile side continue to grow with creep-fatigue cycling while the
transgranular short cracks on the compressive side remain within one to two grain
sizes.
Crack interaction and subsequent coalescence on the tensile side of specimens is a
feature of the short fatigue crack failure mechanisms in this study. Crack propagation
due to coalescence under a certain loading state is strongly influenced by the
microstructure of the material on the one hand and by the interaction of cracks on the
other [23]. Kamaya et al. [24] proposed the influence of the interaction between
multiple cracks on crack growth behaviour greatly depends on the relative position of
the cracks. Also, the influence is strongest when the crack lengths are equal and
decreases as the difference in crack length increases. If the difference in crack length
is greater than a certain level the interaction is sufficiently small to allow the influence
of interaction to be ignored. The critical ratio in crack lengths was shown to be related
to the magnitude of offset between the two cracks. The greater the offset is, the
greater the requirement for similitude in crack length for there to be interaction.
Parallel collinear non-coplanar semi-elliptical cracks are very sensitive to crack-tip
until the latter become non-propagating [26]. The fatigue crack growth of larger
cracks does not appear to be significantly affected by the presence of smaller cracks,
which has been one of the features of these experimental results (Fig. 5c-d)). J.
Stolarz [27] proposed the increase in surface crack length due to coalescence has no
effect on crack growth rate until the crack reaches its equilibrium aspect ratio which
occurs exclusively in the depth direction. It was also suggested for low cycle fatigue,
that crack coalescence of this nature at the surface has no significant influence on the
kinetics of fatal crack growth.
5.2 Mechanisms of creep-fatigue failure
Under creep-fatigue conditions, cycle lifetime is both time and cycle dependent. Such
interactions may be "sequential" when an element of one type of deformation is
followed by the other, or more commonly, "simultaneous" when both modes co-exist
in a single stress (or strain) cycle [21]. Although actual components experience
extremely complex temperature-strain-time profiles, it is usual to represent
simultaneous interactions between fatigue and creep in the laboratory, as in this study,
by strain controlled cycles which contain a dwell at peak levels of strain. Failure may
either be "fatigue dominated", which usually involves the growth of a surface initiated
fatigue crack, or it may be "creep dominated" when grain boundary cavities link and
extend outwards, encountering fatigue cracks only close to final failure.
Examinations of longitudinal sections in this study (see Fig. 6) provide evidence that
surface cracks on the tensile side play a significant role in failure. Most of these
cracks initiate and propagate intergranularly. The crack path resulting from different
strain ranges are similarly intergranular and tortuous, with only a few exceptions, in
grain boundaries are regions of high defect concentration due to the mismatch of the
contiguous crystal lattices [28]. Grain boundaries can also act as a site of stress
concentration, and give rise to high local stress and plastic anisotropy. A feature of the
hold time test in austenitic steels is that the stress is relaxed, and this results in creep
damage occurring on grain boundaries. Only a few wedge cracks related to stress
relaxation were found, but no round cavities were detected. Therefore, it can be
concluded that under the current test conditions, failures were fatigue dominated. As
seen in Fig. 5, most of the cracks on the tensile side initiate from oxide patches.
Because grain boundaries and their environs are zones of chemical segregation and
precipitates that have poor oxidation resistance, oxidation penetration along grain
boundaries is usually faster than into the bulk material. This type of grain boundary
oxidation may accelerate intergranular crack initiation and growth [29]. Therefore the
main effect of oxidation is to accelerate crack initiation and Stage I crack growth, but
has little influence on Stage II crack growth because it has been found that cracks are
filled by oxides only near the surface (Fig. 6). Since the experiments were conducted
at higher strain ranges and the longest testing time was less than 1500 h (about two
months), it is understandable that the oxidation effect on Stage II crack growth in
austenitic 316 steel is not significant. From the above analyses, the failure mechanism
of creep-fatigue under the current testing conditions can be attributed to early crack
initiation and easy grain boundary crack growth caused by stress relaxation,
oxidation, and most importantly, by multiple minor cracks joining together.
6. Conclusions
(1) Details of the mechanical mechanism of the bending rig, the methods of strain
(2) It is found that the initiation and growth behaviour of individual minor cracks
during the first stage and their subsequent coalescence in the second stage are the
dominant feature in the failure of specimens under creep-fatigue bending conditions at
550oC with 0.9-2.5% strain range. Increasing the strain range causes an increasing number of minor cracks and a promotion of the process of minor crack coalescence.
(3) The different crack morphology and crack length on the two sides of a specimen
indicates that a compression-only dwell is much less dangerous than a tension-only
dwell.
References
1 Maiya P. Mater. Sci. Eng A 1981;47:13. 2 Wareing J. Metall Mater Trans A 1977;8:711.
3 Brinkman CR, Korth GE, Hobbins RR. Nucl. Technol 1972;16:299.
4 Wareing J. In: Fatigue at High Temperature, Applied Science Publishers, London and New York, 1983. p. 135.
5 Forrest PG, Penfold AB. Engineering 1961;192:522.
6 Forrest PG, Armstrong KB. Inst. Mech. Engrs Joint Int. Conf. on Creep, London, 1963. p. 3-1.
7 Dawson RAT. Inst. Metals thermal and High Strain Fatigue Conf., London, 1967. p. 239.
8 Coles A. Inst. Metals thermal and High Strain Fatigue Conf., London, 1967. p. 270. 9 Hill GJ. Inst. Metals thermal and High Strain Fatigue Conf., London, 1967. p. 312. 10 Batt AD, Murphy MC, Stringer MB. Metals Technol 1978;5:405.
11 Wood DS, Banks P. Fatigue Fract. Engng. Mater. Struct. 1990;6:551. 12 Brown MW, Gao N, Miller KJ. Strength of Materials, 2000;32:502.
14 Gao N, Brown MW, Miller KJ. Fatigue Fract. Engng Mater. Struct, 1995;18: 1423.
15 Shaikh Z, Ph.D. Thesis, University of Sheffield, 1991. 16 Gao N, Ph.D. Thesis, University of Sheffield, 1994. 17 Adams WR, Stanley P. J. Phys. E. Sci. Instr., 1974;7:669.
18 Brown MW, Miller KJ. In: Symp. Biaxial/Multiaxial Fatigue, San Francisco, ASTM, 1982.
19 Thomas GB. High Temperature Fatigue Properties and Prediction, Elsevier Applied Science, London and New York, 1987. p. 261.
20 Navarro A, de los Rios E. R. Phil. Mag. 1988;57:37.
21 Plumbridge WJ. Fatigue Fract. Engng. Mater. Struct. 1987;10:385.
22 Plumbridge WJ, Priest RH, Ellison EG. In : Third Int. Conf. on Mechanical Behaviour of Materials, Cambridge, 1979. p. 129.
23 Meyer S, Diegele E, Bruckner-Foit A, Moslang A. Fatigue Fract. Engng. Mater. Struct. 2000;23:315.
24 Kamaya N, Totsuka N. Corrosion Science 2002;44:2333.
25. Soboyejo WO, Knott JF, Fatigue and Fracture of Engineering Materials 1991;14:37.
26 Stokes B, Gao N, Lee KK, Reed PAS. Metall Mater Trans A 2005;36:977. 27. Stolarz J. Mater. Sci. Eng A 1977;234-236:861.
Tables and Figure Captions:
Table 1 Results of bending creep-fatigue tests
Table 2 The number of minor cracks at different strain ranges
Fig. 1 A schematic view of the mechanical mechanism of the bending rig.
Fig. 2 The development of the longest major crack for four different strain ranges.
Fig. 3 Growth and linkage behaviour of cracks associated with the development of five major cracks at 1.43% strain ranges.
Fig. 4 Regression curves of growth pattern of minor cracks at 2.55% strain range (a), and maximum growth pattern of minor cracks at different strain ranges (b).
Fig. 5 Replica studies of minor crack linkage patterns for forming a major crack on the tensile-hold surface at 1.43% strain range.
Fig. 6 Intergranular crack morphology on tensile side of longitudinally sectioned specimens at 1.43% strain range.
Fig. 7 Transgranular crack morphology on compressive side of longitudinally sectioned specimen at 2.55% strain range.
Table 1 Results of bending creep-fatigue tests
Test No. Range of bending moment Range of total strain Range of inelastic strain Range of elastic strain Range of max. surface stress No. of cycles to failure Replicas Y=Yes N=No
ΔM Δεt Δεin Δεe Δσmax Nf
N-m % % % MPa cycles
Table 2 The number of minor cracks at different strain ranges
Total strain range Major cracks Major crack length Maximum number of minor crack Average value of maximum number of minor crack Number of minor crack per unit length
Average of number of
minor crack per unit length
Δεt L nmax nmax L
% Microns (1/mm) (1/mm)
Fig. 1 A schematic view of the mechanical mechanism of the bending rig.
0 1000 2000 3000 4000 5000 6000
10 100 1000 10000
Number of cycles (N)
S
u
rf
ace
c
rack
le
n
g
th
2.55% 2.03% 1.43% 0.92%
(
μ
m)
0 1000 2000 3000 4000 5000 6000
10 100 1000 10000
Number of cycles (N)
S
u
rf
ace
c
rack
le
n
g
th
2.55% 2.03% 1.43% 0.92%
(
μ
m)
[image:26.595.106.450.466.683.2]
0 5 10 15 20 25 30
0 100 200 300 400 500 600
Number of cycles (N)
N
u
mb
er
o
f mi
n
o
r cr
acks
Crack 1 Crack 2 Crack 3 Crack 4 Crack 5
First stage Second stage
0 5 10 15 20 25 30
0 100 200 300 400 500 600
Number of cycles (N)
N
u
mb
er
o
f mi
n
o
r cr
acks
Crack 1 Crack 2 Crack 3 Crack 4 Crack 5
[image:27.595.97.471.95.349.2]First stage Second stage
(μm)
0 5 10 15 20 25 30 35 40 45 50
0 1000 2000 3000 4000 5000 6000 7000
Surface crack length
N u m b er o f m in o r cr acks 2.55% 2.03% 1.43% 0.92%
(b)
0 5 10 15 20 25 30 35 40 45 500 1000 2000 3000 4000 5000
Surface crack le ngth
N u m b er o f m in o r cr a cks
Number of minor cracks n (Average)
n (Maxmum) n (Minimum)
(a)
(μm)
(μm) (μm)
0 5 10 15 20 25 30 35 40 45 50
0 1000 2000 3000 4000 5000 6000 7000
Surface crack length
N u m b er o f m in o r cr acks 2.55% 2.03% 1.43% 0.92%
(b)
0 5 10 15 20 25 30 35 40 45 500 1000 2000 3000 4000 5000 6000 7000
Surface crack length
N u m b er o f m in o r cr acks 2.55% 2.03% 1.43% 0.92%
(b)
0 5 10 15 20 25 30 35 40 45 500 1000 2000 3000 4000 5000
Surface crack le ngth
N u m b er o f m in o r cr a cks
Number of minor cracks n (Average)
n (Maxmum) n (Minimum)
(a)
(μm)
[image:28.595.100.468.130.582.2](μm)
(a) N=108 cycles, N/Nf=0.21, n=15 (b) N=232 cycles, N/Nf=0.44, n=27
(c) N=314 cycles, N/Nf=0.60, n=16 (d) N=523 cycles, N/Nf=1.0, n=1
stress direction
100 µm
100 µm
200 µm
200µm
Crack initiations
Crack linkage
(a) N=108 cycles, N/Nf=0.21, n=15 (b) N=232 cycles, N/Nf=0.44, n=27
(c) N=314 cycles, N/Nf=0.60, n=16 (d) N=523 cycles, N/Nf=1.0, n=1
stress direction stress direction
100 µm
100 µm
100 µm
100 µm
200 µm
200 µm
200µm
200µm
Crack initiations
[image:29.595.89.500.172.515.2]Crack linkage
stress direction
100 μm
Intergranular cracks Wedge crack
stress direction
100 μm
Intergranular cracks Wedge crack
[image:30.595.98.504.90.227.2]Intergranular cracks Wedge crack
Fig. 6 Intergranular crack morphology on tensile side of longitudinally sectioned specimens at 1.43% strain range.
100 μm stress direction
Transgranular cracks
100 μm stress direction
Transgranular cracks
[image:30.595.161.396.352.569.2]0 2 4 6 8 10 12 14 16
0 1000 2000 3000 4000 5000
Number of cycles (N)
N u m b er o f m in o r c racks 0 1000 2000 3000 4000 5000 6000 7000
0 1000 2000 3000 4000 5000
Number of cycles (N)
S u rf a ce cr a ck len g th
550ºC, 60 min
550ºC, 0 min
550ºC, 60 min
550ºC, 0 min
(a)
(b)
( μ m) 0 2 4 6 8 10 12 14 160 1000 2000 3000 4000 5000
Number of cycles (N)
N u m b er o f m in o r c racks 0 1000 2000 3000 4000 5000 6000 7000
0 1000 2000 3000 4000 5000
Number of cycles (N)
S u rf a ce cr a ck len g th
550ºC, 60 min
550ºC, 0 min
550ºC, 60 min
550ºC, 0 min
(a)
(b)
(
μ
[image:31.595.105.496.108.560.2]m)