Beyer, V. and Campbell, Stuart and Ramsey, Gemma and Galloway,
Alexander and Moore, A.J. and McPherson, Norman (2013) Systematic
study of effect of cross-drafts and nozzle diameter on shield gas
coverage. Science and Technology of Welding and Joining, 18 (8). pp.
652-660. ISSN 1362-1718 ,
http://dx.doi.org/10.1179/1362171813Y.0000000143
This version is available at https://strathprints.strath.ac.uk/44912/
Strathprints is designed to allow users to access the research output of the University of Strathclyde. Unless otherwise explicitly stated on the manuscript, Copyright © and Moral Rights for the papers on this site are retained by the individual authors and/or other copyright owners. Please check the manuscript for details of any other licences that may have been applied. You may not engage in further distribution of the material for any profitmaking activities or any commercial gain. You may freely distribute both the url (https://strathprints.strath.ac.uk/) and the content of this paper for research or private study, educational, or not-for-profit purposes without prior permission or charge.
Any correspondence concerning this service should be sent to the Strathprints administrator:
The Strathprints institutional repository (https://strathprints.strath.ac.uk) is a digital archive of University of Strathclyde research outputs. It has been developed to disseminate open access research outputs, expose data about those outputs, and enable the
nozzle diameter on shield gas coverage in MIG
welding
V. Beyer
1, S. W. Campbell
2, G. M. Ramsey
2, A. M. Galloway
2, A. J. Moore
1and
N. A. McPherson
*
3A shield gas flowrate of 15–20 L min
21is typically specified in metal inert gas welding, but is often
adjusted to as high as 36 L min
21by welders in practice. Not only is this overuse of shield gas
wasteful, but uncontrolled high gas flows can lead to significant turbulence induced porosity in
the final weld. There is therefore a need to understand and control the minimum shield gas
flowrate used in practical welding where cross-drafts may affect the coverage. Very low gas
coverage or no shielding leads to porosity and spatter development in the weld region. A
systematic study is reported of the weld quality achieved for a range of shield gas flowrates,
cross-draft speeds and nozzle diameters using optical visualisation and numerical modelling to
determine the shield gas coverage. As a consequence of the study, the shield gas flow has been
reduced to 12 L min
21in production welding, representing a significant process cost saving and
reduced environmental impact with no compromise to the final weld quality.
Keywords:MIG, CFD, Gas shielding, Shadowgraphy, Porosity
Introduction
Effective shielding of the molten metal in the welding process is a prerequisite for good quality welds. The primary purpose of the shielding gas is to shield the metal transfer stream from the effects of atmospheric reoxidation. In Europe, there is a preference for using 80% argon–20% carbon dioxide as shielding gas for structural steel, whereas in the Far East, the preference is 100% CO2.
Cross-drafts can have an effect on the shielding efficiency, and previous studies have been reported. Gibson1measured shield gas coverage using aluminium and titanium, tungsten inert gas (TIG) spot welds for various weld conditions, including different types of shield gas, standoff distances and cross-drafts. Useful guidelines on the extent of gas coverage were deter-mined, but these were not related adequately to weld quality. Schlieren images were obtained during welding for qualitative visualisation of the cross-draft and also without an arc to show qualitatively the effect of joint form on the shield gas flow. Tamaki et al.2 made gas concentration measurements without an arc and estab-lished that the minimum CO2concentration required to
prevent harmful porosity in the weld was 95 vol.-% in the core region. The effect of cross-drafts was also studied, and a value of the ratioVs/Vwwas determined
below which harmful porosity occurred in the weld (where Vs is shielding gas speed, and Vw is the draft
speed). A Schlieren optical system was again used to visualise qualitatively the CO2 shielding stream for a
cold flow. Futamata and Toh3 also measured the CO2
concentration distribution without an arc with cross-drafts (this time as a function of Vw/Vs), although the
measurements were not related to weld quality. The shield gas flow was qualitatively visualised using smoke seeding under cold conditions.
Optical techniques have been used for flow visualisa-tion of the shield gas during welding, although neither the minimum shield gas flowrates nor the effect of cross-drafts were considered. Kiyohara et al.4,5 performed shadowgraphy during TIG welding with a stationary arc on a water cooled copper plate. The boundary of the laminar flow area below the nozzle was found to coincide with 90–99% lines of equiconcentration of the argon shield gas measured by gas chromatography. The shield gas coverage was found to decrease with increasing current due to the plasma jet, e.g. at 20 L min21 the coverage radius reduced from 12 mm
at 0 A to 4 mm radius at 500 A. Dreher et al.6,7,8
measured the oxygen concentration with a lambda sensor from air sampled through a tube in the workpiece next to a stationary TIG arc, although the measure-ments were not related to acceptable weld quality. Computational fluid dynamic (CFD) models showed the 1School of Engineering and Physical Sciences, Heriot-Watt University,
Edinburgh, EH14 4AS, UK
2Department of Mechanical and Aerospace Engineering, University of
Strathclyde, Glasgow, G1 1XQ, UK
3
BAE Systems, Naval Ships, Glasgow, G51 4XP, UK
importance of considering turbulence in the shield gas flow exiting the nozzle and that the plasma jet reduces the shield gas coverage. Schlieren measurements were undertaken to observe the characteristics of the flow rather than obtaining quantitative information. Both groups4–8 observed that optical measurement of the shield gas boundaries for metal inert gas (MIG) welding is more difficult than for TIG due to the rising gases heated by the weld bead.
In this paper, shadowgraphy was used to visualise the shield gas flow profile and coverage from a welding torch during MIG welding at a range of shield gas flowrates (5–18 L min21) for different cross-draft speeds
(from 0 to 8 mph). Additionally, the shield gas flow was visualised with reduced internal diameters of the nozzle to simulate spatter build-up (16, 14 and 11 mm re-stricted diameters). For the first time, shadowgraphy data are analysed quantitatively and compared to radiographic measurements of the welded samples to determine the weld quality. The shadowgraphy results were also used to validate a simplified CFD model of the shield gas flow. The aim of the work was to establish, through shield gas flow visualisation, the minimum flowrates at which weld coverage was lost in the presence of cross-drafts.
Experimental
Welding
Trials were carried out on an automated welding rig that incorporated a stationary MIG welding head aligned perpendicular to the workpiece (welding vertically down), enabling the shadowgraphy equipment and the cross-draft generator to be sited in a static position with respect to the welding torch. A schematic representation of the experimental setup is shown in Fig. 1.
Welding was performed using an 80%Ar/20%CO2
shielding gas, a 1?2 mm diameter seamless flux cored filler wire, a welding travel speed of 3?2 mm s21, with
nominal welding parameters of 210 A and 24?7 V. All welding parameters were logged on a Triton Weld Monitor AMV 3500. The welding nozzle was positioned with a standoff distance of 10 mm to the plate for all tests. Bead on plate welds were produced on DH36 steel plates of dimension 500615068 mm coated with a 17mm layer of paint primer, which is typical of practice in shipyards. At the beginning of each weld, the weld nozzle was cleaned of spatter from any preceding experiments. The welds produced had cap widths of
,15 mm.
Radiography of 200 mm length of each weld, starting at 60 mm from the start of the weld, was used to
evaluate the extent of porosity. A grading system was developed according to the level of defects present: a clear weld free from harmful imperfections (no porosity) would produce a pass, while welds containing detri-mental defect levels (at least one pore) would fail.
The variables to be studied in the welding experiments were as follows.
The shield gas flowrate was measured by the weld monitor. Independent checks were made to validate the shield gas flowrate exiting the welding torch using a flow meter placed over the end of the torch.
Cross-drafts were introduced with a custom made laminar flow device, comprising a diffuser and a flow straightener, connected to a compressed air line. The device was placed 300 mm from the centre of the weld nozzle, and the steady, uniformly distributed, laminar output was directed at 60uto the weld bead so as not to obstruct the shadowgraphy optics (Fig. 1). The cross-draft speed was calibrated at 1, 3, 5 and 7 mph with the velocity of the flow being measured using a hot wire anemometer at a height of 5 mm above a reference plate at 55 different locations around the welding nozzle. The measured cross-draft speeds are shown in Fig. 2, where the cross-draft passes from left to right. The flow is uniform in the test region under the weld nozzle. Some unavoidable disturbance in the flow due to the nozzle is apparent, but this occurs away from the weld region.
The internal diameters of the nozzles were restricted from 16 mm (unrestricted) to 14 and 11 mm using uncoated brass inserts soldered in position at the nozzle exit to simulate spatter build-up (Fig. 3).
Shadowgraphy
The portable shadowgraphy system used a 12 mW helium–neon laser beam that was collimated (diameter of 35 mm with 1 mm increase in beam diameter over 3 m) and directed across the weld region, perpendicular to the weld direction (Fig. 1). The beam was focussed to a high speed camera. Broad band pass (10 nm) and narrow band pass (1 nm) optical filters centred on the laser wavelength (633 nm) and absorptive neutral density attenuating filters were placed in front of the camera in order to match the laser illumination power to the dynamic range of the camera. The unwanted light from the welding arc was effectively eliminated with respect to the laser light. Camera images were recorded at 9000 frames per second and resolution of 256(H)6
128(V) pixels.
The shield gas flow was visualised with shadowgraphy over the full range of shield gas flowrates, cross-draft speeds and internal nozzle diameters. Experiments were performed before welding (i.e. ‘cold’ measurements with
1 Schematic of experimental arrangement (plan view, not to scale)
Beyer et al. Effect of cross-drafts and nozzle diameter on shield gas coverage
the shield gas and cross-draft only, but no weld arc) and during welding (i.e. ‘hot’ measurements). The measure-ments during welding were made on the same specimens that were subsequently radiographed. Before all sha-dowgraphy measurements, a reference (or ‘tare’) image without any shield gas flow was recorded. The tare image was subtracted from every measurement image and the result divided by the tare image in order to normalise the Gaussian illumination intensity profile from the measurement images. Hence, changes in the recorded shadowgraphy intensity were proportional to the second spatial derivative of the refractive index. The
image sequences obtained in this way were averaged to reveal time invariant features in the flow, i.e. the flow profile.
For the hot measurements during welding, the flow is more complex due to heating and spatter, and fewer time invariant features were revealed by averaging the image sequence. Therefore, a new, pixel-wise filtering approach was devised to enhance the visibility of the shield gas. The variation in intensity at each pixel through the time sequence gives a qualitative indication of the turbulence in the flow at that point. Hence, the intensity in the shadowgraphy fluctuates with greater amplitude and frequency close to the weld (where the interaction of the cross-draft and the hot weld gases produce fluctuations in the refractive index) than in regions well away from the weld region. One way to quantify this intensity fluctuation is to calculate the frequency content of the time varying signal from a sequence of images at each pixel. A fast Fourier transform (FFT) was applied to the intensity signal at each pixel from a sequence of images and filtered to eliminate low frequencies (0–252 Hz) and high frequen-cies (1512–4500 Hz). This frequency range was chosen empirically to exclude the dc component (i.e. the flow profile) and tuned to the observed disturbances in the
a1 mph;b3 mph;c5 mph;d7 mph
2 Cross-draft speed distribution: weld nozzle is centred at (0 mm, 300 mm)
shield gas and the surrounding air. The area under the FFT magnitude in the remaining frequency band was calculated at each pixel in order to produce a processed image qualitatively indicating the turbulence at each pixel.
Computational fluid dynamics
In the present study, the inclusion of a simplified CFD model, validated against the shadowgraphy flow visua-lisation and radiographic assessment, is beneficial from a process design perspective: modification of nozzle geometry, shielding gas flowrate or cross draft velocity being instantaneously assessed without the need for further validation.
A multiphysics, three-dimensional transient state model was developed using the CFD software Fluent, with the model geometry first being constructed in Gambit to replicate the set-up of the experimental trials. Three separate models were developed, one for each nozzle diameter, as detailed by Ramsey et al.9 The nozzle was positioned within a volume of fluid of sufficient size that all flow development of interest could be captured. A simplified weld arc plasma was modelled by including a constant temperature hemisphere of gas (of 12 mm diameter) directly beneath the nozzle (Fig. 4). An interface was defined where the hemisphere and the plate surfaces meet, enabling Fluent to compute across this boundary as the respective meshes slide over one another. Clearly, the interactions within the arc plasma are far more complex than this simplification. However, the welding parameters were the same for all welds, and so the influence of the plasma remained constant in each case. In addition, it has been shown that the set shield gas pressure has a negligible effect on the arc pressure distribution,10 from which various forces acting upon the liquid metal can be numerically derived.11 The shadowgraphy flow visualisation was used to determine if this approach was reasonable to model the effect of cross-drafts on the shielding gas flow and the radio-graphic assessments, along with the weld macrographs,
used to develop a grading system that correlated with the experimental results.
The model was meshed using tetrahedral elements, with a finer mesh being applied to the fluid volume adjacent to the nozzle and, in particular, the fluid directly beneath the nozzle outlet. The two inputs of the system, shielding gas flowrate and cross-draft velocity, were defined as a mass flow inlet and pressure inlet respectively (determined through Bernoulli’s theorem), thus allowing the conditions of the experimental trials to be replicated.
Both convective and radiative heat transfer from the ‘heated’ hemisphere to the plate were modelled. The temperature of the hemisphere was chosen to replicate the temperature distribution within the modelled plate to that measured by K type thermocouples in the experimental set-up. Fifteen thermocouples (three banks of five) were distributed along the length and width of the plate to a depth of 4 mm.
The effects of buoyancy, turbulent kinetic energy, rate of dissipation and consequently the turbulent viscosity of the system were all included within the model.
Results
[image:5.595.83.263.50.137.2]Radiography measurements
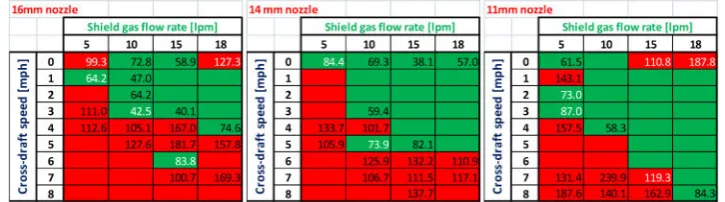
Figure 5 shows the radiographic assessment results, where green indicates an assessment of no porosity and red indicates unacceptable porosity. For each table, i.e. for each nozzle diameter tested, it is apparent that as the shield gas flowrate increases the weld quality is less susceptible to cross draft. It is also apparent that the weld quality for the 11 mm nozzle is less susceptible to cross-drafts than for the standard 16 mm nozzle.
Shadowgraphy measurements without arc
(‘cold’ measurements)
Measurements were made in the same geometrical configuration as for welding but with no welding being performed, i.e. shield gas flow and cross-draft present. The full range of shield gas flowrates (5–18 L min21),
cross-drafts (0–8 mph) and internal nozzle diameters (16, 14 and 11 mm) were introduced. In preliminary studies, no difference was observed in the results recorded for stationary or moving plate due to the slow speed of the plate compared to the gas flow, so results were recorded with the plate stationary.
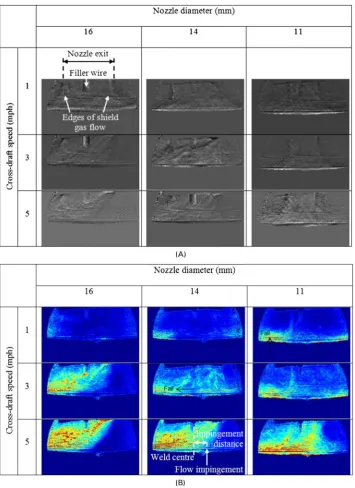
Figure 6a shows a selection of intensity images, produced by the procedure described previously and averaged to reveal time invariant features in the flow, i.e. the flow profile. The extent of the shield gas is delineated
4 Computational fluid dynamic nozzle geometry showing simplified arc plasma
5 Experimental radiography and shadowgraphy measurements indicated by X for three different nozzle diameters and at range of shield gas flowrates and cross-draft speeds; table coloured according to radiography results: no porosity (green) and unacceptable porosity (red)
Beyer et al. Effect of cross-drafts and nozzle diameter on shield gas coverage
[image:5.595.119.478.626.730.2]by two lines at the edge of the nozzle, with a steady, laminar flow covering the weld region between them. For reduced nozzle internal diameters, the extent of flow is reduced and the edge turbulence increases due to the nozzle restriction. The cross-draft, travelling from right to left, introduces turbulence to the weld region and deviates the shield gas flow away from the weld region. For reduced nozzle internal diameters, particularly 11 mm, less turbulence and deviation of the shield gas are caused at a given cross-draft speed.
The small difference in refractive index between the shield gas and the surrounding air at room temperature limits the visibility of shield gas flow. Therefore, the cold measurement image sequences were also processed with the FFT technique, described previously, to show qualitatively regions of turbulence (Fig 6b). The shield
[image:6.595.121.477.48.537.2]gas flow is revealed more clearly, and the position where the flow boundary impinges on the plate surface can be seen. This impingement position was determined from the largest gradient in the FFT signal along the plate surface. The impingement distance, from the centre of the nozzle to the impingement position, gives a measure of shield gas coverage in the presence of cross-drafts. The measured impingement distances are shown in Fig. 7 for the full range of tests, where positive values indicate points to the right of the nozzle centre. The table is shaded green for impingement distances.5 mm and red for smaller values, chosen empirically to obtain consistent agreement in the predicted weld quality with the radiography results.
Figure 8 shows the ratio of cross-draft speed to shield gas speed (both converted to m s21) exiting the nozzle
for the full range of tests. The table is shaded green for ratios ,1?25 and red for larger values, chosen empiri-cally to obtain consistent agreement in the predicted weld quality with the radiography results.
The cold measurements are summarised in Fig. 9, which shows the ratio of cross-draft speed to shield gas speed plotted against the impingement distance. The two criteria for a successful weld from Figs. 7 and 8 are marked, namely impingement distance.5 mm and ratio of cross-draft speed to shield gas speed,1?25. The data points are coloured from the radiography measure-ments, showing no porosity (green) and unacceptable porosity present (red).
Shadowgraphy measurements during welding
(‘hot’ measurements)
The shadowgraphy measurements were recorded from the same weld runs as the radiography results shown in Fig. 5.
Figure 10 shows a selection of images produced by the pixel-wise FFT filtering to reveal regions of disturbance in the shield gas and the surrounding air. These plots do not show as much detail as for the corresponding ‘cold’ measurements due to the highly turbulent nature of the flow, particularly in the region of the weld bead. However, it can be seen that as the nozzle diameter decreases, the extent of flow reduces and the edge turbulence due to the nozzle restriction increases. The arc cone is visible as a dark region, and the area above the weld pool shows a relatively low signal due to the more stable flow in that region.
It is proposed that the low FFT signal in the region of the weld indicates reduced disturbance to the shield gas and therefore a reduced entrainment of air. Air entrainment into the shield gas around the weld was estimated by summing the FFT magnitude at each pixel in a rectangular area 9?7661?12 mm above the weld pool. The rectangular region is indicated in the first image of Fig. 10. A lower signal qualitatively denotes lower turbulence and hence lower entrainment of air and so better resulting weld quality. The summed FFT values are shown in Fig. 11 for the full range of tests. The table is shaded green for values ,95 (in arbitrary units) and red for smaller values, chosen empirically to obtain reasonable agreement in the predicted weld quality with the radiography results. Some discrepancies occur particularly for the 5 L min21shield gas flow due
to the general unpredictability and turbulence of the flow.
7 Impingement distance measured from FFT images in Fig. 6b; table coloured according to impingement distance: .5 mm acceptable (green), otherwise not acceptable (red). Impingement distances shown in white font are discrepan-cies with respect to radiography weld quality predictions (Fig. 5)
8 Ratio of cross-draft speed to shield gas speed. Table coloured according to ratio: ,1?25 acceptable (green), otherwise not acceptable (red). Ratios shown in white font are discrepancies with respect to radiography weld quality predictions (Fig. 5)
9 Comparison of impingement distance (Fig. 7), cross-draft speed to shield gas speed ratio (Fig. 8) and radio-graphy measurements (Fig. 5)
Beyer et al. Effect of cross-drafts and nozzle diameter on shield gas coverage
Computational fluid dynamic model of shield
gas flow
Each nozzle model was subjected to the full range of experimental variables, i.e. shielding gas flowrate (5, 10, 15 and 18 L min21) and cross-draft velocity (0–8 mph),
resulting in 36 simulations for each nozzle configuration. The flow profile in each case was analysed using contour plots of mass concentration of argon; since the shielding gas modelled was 80%Ar/20%CO2, this meant that a
[image:8.595.120.478.50.244.2]contour of 80% argon was equal to 100% shielding gas coverage. A grading system for the flow profile was chosen based on the nominal weld width of 15 mm: profiles with 100% shield gas concentration on the plate surface to a distance of .8 mm on both sides of the weld/nozzle centreline would provide adequate shielding gas coverage and produce a good quality weld.
Figure 12 shows a selection of shielding gas profiles generated by the CFD model. As expected, as the cross-draft velocity increases, the shielding gas column drifts, removing the protection provided by the shielding gas. The arrow on the images indicates one edge of the 16 mm diameter nozzle chosen to indicate good quality weld. Figure 13 shows the weld classifications as obtained through the CFD approach. Although the model simplifications may limit accurate simulation of various weld phenomena, the good agreement between the CFD classification with the shadowgraphy images and radiographic assessments suggests that simplifying
the arc plasma to a constant temperature hemisphere positioned below the welding nozzle is reasonable for modelling the effect of cross-drafts on the shield gas flow for constant weld parameters.
Discussion
The cold shadowgraphy results provide a prediction, before welding, as to whether the weld will be of acceptable quality. Both the impingement distance and the ratio of the cross-draft speed to shield gas speed were shown to provide reliable indicators of the effect of cross-drafts on the weld quality. The impingement distance is independent of the nozzle diameter, and it is possible that it is also independent of the welding geometry (although this has not yet been verified). The ratio of the cross-draft to shield gas speeds is also independent of the nozzle diameter, but it is geometry dependent (for example the standoff distance). The two criteria can be combined (Fig. 9) to increase the reliability of the weld quality indicated.
The FFT results from the hot shadowgraphy mea-surements provided a quantitative indication of the weld quality during welding. The results were noisier than the cold measurements due to the heat of the arc and the weld bead. However, this is the first systematic study using shadowgraphy (or Schlieren) applied during MIG welding and the new FFT technique enabled the first
10 Selection of shadowgraphy measurements during welding (‘hot’ measurements): images processed by FFT technique for closest available experimental conditions to table headings, scaled from blue (low disturbance) through to red (higher disturbance)
[image:8.595.116.479.627.728.2]quantitative prediction of weld quality from shadow-graphy (or Schlieren) for any type of welding.
Overall, the experimental measurements showed that reducing the outlet diameter of the nozzle increases the resilience of the shielding gas coverage to cross-drafts, despite a small increase in turbulence due to the nozzle insert. Spatter build-up on the welding nozzle is unavoidable, although it can be minimised by good control of the welding parameters. The progressive restriction of the nozzle by spatter can therefore be beneficial against the effect of cross-drafts to some extent, provided that the build-up is approximately uniform around the circumference of the nozzle and the overall flow is not excessively restricted.
The experimental measurements also showed the minimum shield gas flowrates necessary for acceptable weld quality in the presence of cross-drafts, which is being applied on a practical basis. In a typical shipyard, BAE Systems Naval Ships were using an average gas flow of 24–26 L min21for the 16 mm weld nozzle tested
in this study, against the process norm of 18 L min21.
The shadowgraphy results established that there was no loss of shield gas coverage, and hence no degradation in the weld quality, at shield gas flowrates of 10 L min21
and above for the worst draft conditions measured in a typical shipyard fabrication hall.
Shield gas flow controllers preset at 12 L min21have
been fitted at BAE Systems Govan shipyard (Fig. 14), removing the welders’ capability to increase the gas flowrate. These changes were initially introduced in a workplace area where a high number of X-rays are taken, and then extended into a steel workshop and the pipe shop. To date, no defects have been found, and the
12 Selection of CFD results at shield gas flowrate of 10 L min21
13 Computational fluid dynamic weld classifications according to 8 mm impingement distance: good coverage (green) and poor coverage (red)
14 Gas flow autocontroller (length 60 mm) installed in wire feed welding unit
Beyer et al. Effect of cross-drafts and nozzle diameter on shield gas coverage
next areas to be targeted are a panel line and a subassembly manufacture area. The 50% reduction in shield gas use (compared to previous actual usage) will yield a predicted cost saving of approximatelyy£300k per annum. The carbon footprint of the welding process is improved directly through reduced CO2 use, plus
reduced energy is required for production and supply of the shield gas. Rollout to other shipyards is planned.
For the future, a further reduction to 10 L min21 is
possible and a reduced nozzle diameter could be introduced as a result of this study. Spatter build-up on an 11 mm diameter nozzle may be a limiting factor, in which case a 14 mm diameter nozzle would seem to be reasonably practical. If a move to 14 mm diameter is judged viable, then a further reduction in flowrate to 9 L min21is also practical.
Conclusions
Experimental radiography, shadowgraphy and CFD showed that there is considerable scope to reduce the shielding gas flowrate used in the MIG welding process compared to that conventionally used in industry, without detriment to the final weld quality. As the shielding gas flowrate is increased and/or the nozzle diameter decreased, the weld quality is more resilient to the adverse effects of a cross-draft. Hence, the design of the welding process requires choosing a minimum shield gas flowrate for the expected maximum cross-draft.
Shadowgraphy was applied successfully to MIG welding to measure flow profiles and regions of turbulence, and a quantitative analysis of the images for welding was undertaken for the first time. Measurements without the welding arc (‘cold’ measure-ments) showed that the impingement distance of the shield gas flow and the ratio of the cross-draft speed to the shield gas speed provide reliable indicators of the effect of cross-drafts on the weld quality before welding. A new pixel-wise Fourier analysis of the intensity fluctuation with time of a sequence of shadowgraphy images was proposed as a qualitative measure of turbulence in the flow, enabling the first prediction of weld quality from shadowgraphy (or Schlieren) during the welding process.
A validated CFD model has been generated to accurately simulate the shielding gas profile during the welding process. The model uses a hemisphere as a simplified arc plasma assumption and has produced an excellent correlation with the shadowgraphy images and radiographic results.
The results, for combinations of the shield gas flowrate, cross-draft speed and nozzle diameters, have enabled a 50% reduction in shield gas usage in a practical welding situation without detriment to the weld quality.
Acknowledgement
The authors wish to thank BAE Systems Naval Ships for financially supporting this work. This project was part funded by the Engineering and Physical Sciences Research Council (grant no. GR/S12395/01). Andrew Moore acknowledges support of AWE through its William Penney Fellowship scheme.
References
1. G. J. Gibson: ‘Gas flow requirements for inert-gas-shielded arc welding’,Weld. J., 1953,34, (4), 198s–208s.
2. K. Tamaki, I. Masumoto and Y. Takahashi: ‘Some observation of the gas shielding conditions of CO2arc welding by the application
of a television system’,J. Jpn Weld. Soc., 1978,47, (5), 37–42 3. M. Futamata and T. Toh: ‘Explanation by the flow visualisation
and analysing the gas concentration’,J. Jpn Weld. Soc., 1978,47, (9), 668–673.
4. M. Kiyohara, T. Okada and H. Yamamoto: ‘Observation of the shielding gas flow pattern during arcing by the use of a laser light source’, in ‘Arc physics and weld pool behaviour’, (ed. W. Lucas), Vol. 1, 203–213; 1980, Cambridge, The Welding Institute. 5. T. Okada, H. Yamamoto and S. Harada: ‘Observation of the
shielding gas flow pattern during arcing by the use of a laser light source’, in ‘Arc physics and weld pool behaviour’, (ed. W. Lucas), Vol. 1, 203–213; 1980, Cambridge, The Welding Institute. 6. M. Dreher, U. Fu¨ssel, M. Schnick and M. Hertel: ‘Numerical
simulation of the shielding gas flow with GMA welding and options of validation by diagnostics’,Int. Doctoral Semin. Proc., 2009, s427–437.
7. M. Dreher, U. Fu¨ssel and M. Schnick: in ‘Numerical optimisation of gas metal arc welding torches using ANSYS CFX’, (ed. M. Koc¸ak), Proc. Int. Conf. on ‘Advances in welding science and technology for construction’, Istanbul, Turkey, 2010, Energy & Transportation, International Institute of Welding, Annual Assembly.
8. M. Schnick, M. Dreher, J. Zschetzsche, U. Fu¨ssel and A. Spille-Kohoff: ‘Visualization and optimization of shielding gas flows in arc welding’,Weld. World, 2012,56, (1–2), 54–61.
9. G. M. Ramsey, A. M. Galloway, S. W. Campbell, N. A. McPherson and T. J. Scanlon: ‘A computational fluid dynamic analysis of the effect of side draughts and nozzle diameter on shielding gas coverage during gas metal arc welding’,J. Mater. Process. Technol., 2012,212, (8), 1694–1699.
10. H.-S. Ham, D. S. Oh and S.-M. Cho: ‘Measurement of arc pressure and shield gas pressure effect on surface of molten pool in TIG welding’,Sci. Technol. Weld. Join., 2012,17, (7), 594–600. 11. H-S. Ham, D. S. Oh and S.-M. Cho: ‘Derivation of current density