Int. J. Electrochem. Sci., 12 (2017) 3109 – 3119, doi: 10.20964/2017.04.40
International Journal of
ELECTROCHEMICAL
SCIENCE
www.electrochemsci.org
Synthesis and Structural Characterization of New Macrocyclic
Ester. Study as an Immobilization Agent for Determination of
Lead by Anodic Stripping Voltammetry
Juan F. Torres1, Andreas Reiber1, Mario Macías1, Olimpo García-Beltran, Edgar Nagles2,* and John Hurtado1,*
1
Department of Chemistry, Universidad de los Andes, Carrera 1 No. 18A-12, Bogotá, Colombia
2 Faculty of Natural Sciences and Mathematics, Universidad de Ibagué, Carrera 22 Calle 67,
Ibagué730001, Colombia
*
E-mail: [email protected], [email protected]
Received: 27 December 2016 / Accepted: 19 February 2017 / Published: 12 March 2017
New macrocyclic ester (L) was yielded through reaction of catechol with isophthaloylchloride and isolated as white solid, air stable at room temperature. L was characterized by melting point, mass spectra, FTIR and NMR (1H, 13C) spectroscopy. The molecular structure was determined by single-crystal X-ray diffraction. The macrocyclic compound was evaluated to determine ultra-trace concentrations of Pb (II) by anodic stripping voltammetry in the presence of Cd(II). The method is based on the formation of a complex between lead and the macrocyclic ester, immobilized on a vitreous carbon electrode, allowing the oxidation of lead by voltammetric scan, using square wave modulation method. Anodic peak current was observed at -0.20 V for Pb(II). Under the best experimental conditions (pH 4.0; L concentration 10.0 mmol L-1; accumulative potential (Eacc) -0.8 V and accumulative time (tacc) of 60 s) anodic peak current was proportional to the Pb (II) concentration up to 80.0 μg L-1, with a detection limit (3σ) of 0.33 μg L-1. The proposed method was validated by determining Pb(II) in model solution with ultra-pure water with satisfactory results.
Keywords: Macrocyclic ester, modified electrode, lead, anodic stripping voltammetry
1. INTRODUCTION
Lead is a highly toxic metal compared to other metals. The Agency for Toxic Substances and Disease Registry classified lead among the ten most dangerous pollutants. This metal can cause increased blood pressure, anemia, and tumors[1]. In addition, lead is dangerous at low concentration (µg L-1
ions. In ultra-trace analysis of metal ions, anodic stripping voltammetry (ASV) has been the most popular electroanalytical technique used due to its quickness, good selectivity, sensitivity, and low instrumentation cost compared to other techniques like inductively coupled plasma mass spectroscopy [2]. Traditionally, mercury [3], bismuth [4],and antimony film electrodes [5] have been widely used as working electrodes to determine Pb (II). Nevertheless, due to the toxicity of these metals (Hg, Bi, Sb) [6],there is increased use of alternative molecules that can be immobilized on the working electrodes and that allow selectivity, sensibility, and quantification of Pb (II). Within this context, macrocyclic crown ethers [7] and conductor polymers [8–10] have been used to determine lead in the presence of other metal ions. Macrocyclic compounds can be employed to modify electrodes and to determine lead, enhance its selectivity and sensitivity [11–13]. The purpose of this study was to report the synthesis and structural characterization of a new macrocyclic ester (L) and posterior application as immobilization agent to determine Pb (II) through ASV. The usefulness of the method presented was evaluated by determining Pb (II) in a model solution doped with Pb (II) 10.0 µg L-1in the presence of Cd, Mo, Ni, Cu, and Zn. To our knowledge, similar results have not yet to be reported.
2. EXPERIMENTAL
2.1. General procedure
All the reagents and solvents were purchased from commercial sources and used without further purification. Dioxane was dried by using sodium and benzophenone as indicator. Fourier Transform Infrared (FTIR) spectra were recorded on a Thermo Nicolet NEXUS FTIR spectrophotometer using KBr pellets. Nuclear magnetic resonance (NMR) spectra were recorded in chloroform-d (CDCl3) on a BrukerAscendTM-400 spectrometer, chemical shifts are reported in δ(ppm),
relative to solvent protons or carbons (H:7.26 ppm, C:77.16 ppm). Mass spectra were obtained by using a GC-SHIMADZU OQ2010 with EI at 70eV. Melting point was determined on a Mel-Temp® 1101D apparatus in open capillary tubes and was reported without corrections. Ultrasound reaction was carried out in a BRANSON M2800H ultrasonic bath (110W, 40KHz ± 6%).
2.1.1 Synthesis of 3,10,18,25-tetraoxapentacyclo[25.3.1.112,16.04,9.019,24]dotriaconta- 1(31),4(9),5,7,12(32),13,15,19,21,23,27,29-dodecaene-2,11,17,26-tetrone(L)
=7.8, 1.2Hz, 2H), 7.56 (t, J(HH)=7.8 Hz, 1H), 7.49 (dd, J(HH)=5.9, 3.7 Hz, 2H), 7.39 (dd, J(HH) =5.9, 3.7 Hz, 2H) ppm. 13C NMR (400 MHz, CDCl3) δ 163, 142, 135, 131, 130, 129, 127, and 123 ppm.
2.1.2 X-ray structure determination
Colorless crystals of the compound suitable for single-crystal X-ray diffraction were grown by slow evaporation of solutions in chloroform. The X-ray intensity data were measured at room temperature (299(2) K) using CuKα radiation (λ=1.54184 Å) in an Agilent Super Nova, Dual, Cu at zero, Atlas four-circle diffractometer equipped with a CCD plate detector. The collected frames were integrated and the data corrected for absorption effectusing the CrysAlisPro Agilent Technologies software package (version 1.171.37.35). In the case of the absorption correction, an empirical methodology using spherical harmonics was performed which is implemented in SCALE3 ABSPACK scaling algorithm. The structure was solved using an iterative algorithm [1] and subsequently completed by difference Fourier map. All the non-hydrogen atoms were refined anisotropically while the hydrogen atoms were generated geometrically and placed in calculated positions (C-H=0.93-1.1 Å) and included as riding contributions with isotropic displacement parameters set at 1.2 times the Ueq value of the parent atom. The crystal structure was refined using the program SHELXL2014 [2]. The graphic material was prepared using the software Mercury 3.8 [3].
2.2. Electroanalytical studies 2.2.1. Reagents
Ultra-pure water used for sample preparation, dilution of reagents, and rinsing purposes was obtained from Merck. All chemicals (nitric acid, acetic acid, sodium hydroxide, etc.) were analytical grade from Merck (Darmstadt, Germany). Standard Pb II) and Cd (II) solutions were prepared by diluting commercial standard containing 1000 mg L-1, Merck (Darmstadt, Germany). Solutions of (L) were prepared by dissolving appropriate amounts in DCM. Acetate buffer solutions (0.1 mol L-1) were used at pH 4.0. Model solutions containing 5.0 mg L-1of Cd (II) and Pb (II) were used for validation studies. No deaeration of the solutions were applied in this study.
2.2.2. Instrumentation
Voltammograms were obtained on DropSens µStat400 using 3-mm diameter glassy carbon electrode. The reference electrode was Ag/AgCl/KCl 3.0 M and the auxiliary electrode was platinum wire. pH was measured with an OhausST3100C-F apparatus.
2.2.3. Voltamperometric procedure
Amounts of 10 mL of deionized water, 0.2 mL of acetate buffer solution (0.1 M) and aliquots of Pb (II) and Cd (II) solution (5.0 µg L-1
measuring procedure was performed by using square wave stripping voltammetry (SWSV); accumulation time of 60s and potential accumulation of -0.80V. At the end of the accumulation time, the stirrer was switched off; after the 3-s equilibration time, a square wave voltammograms (SWV´s) was recorded, while the potential was scanned from -1.0 to 0.20 V with 0.01 V step amplitude, 0.10V pulse amplitude, and 20-Hz frequency. Each voltammograms was repeated three times. The standard additions method was used to determine Pb (II) in the model solution and to check response linearity. All experiments were carried out at room temperature.
2.2.4. Preparation of modified electrode with immobilization of (L) over glassy carbon (GCE-L)
Before each preparation, the glassy carbon electrode was polished by using a polishing pad with 0.05-μm Al2O3 slurry, rinsed with 0.3 mol L-1, HNO3 and water (5 mL). The modified GCE-L
electrode was prepared with a mixture between 0.20 and 8.0 mg of (L) in 1 mL of DCM (pure). A total of 40 µL from the mixture was dispersed on the glassy carbon surface, leading the solvent to evaporate. The modified GCE-L electrode was washed to remove excess solvent and was subjected to five cycles of potential between -0.3 and 0.9 V (100 mV s−1) to obtain a stable, reproducible, and clean surface. The same electrode was used in a series of measurements. Serrano et al., reported the use of lysine to immobilize a crown ether on graphite–epoxy electrode [7]. We did not need to previously modify the glassy carbon surface to immobilize L., the low solubility in water and the presence of functional groups allows easy adsorption on the glassy carbon surface. Electrode preparation is shown in Scheme 1.
Scheme 1. Electrode preparation.
3. RESULTS AND DISCUSSION
3.1 Synthesis and characterization of (L)
chloroform, and dioxane. Synthesis was easy and fast, as well as the purification. Yield is higher than the one obtained for similar compounds synthesized by using conventional conditions and ultrasonic irradiation [17]. The FTIR spectra showed the typical vibration modes expected for ester 1755(C=O), 1298, and 1054 cm-1(C-O-C).
Scheme 2. Synthesis of macrocyclic ester
The NMR chemical shifts were observed between 7 and 10 ppm for 1H and 120 and 170 13C ppm, signals that were assigned with the aid of 1H-1H (COSY), 1H-13C (HSQC and HMBC), signal from (OH-catechol) used as precursor was not observed, indicating that the two hydrogens (O-H) were removed. Mass spectra showedm/zpeaks that can be related tothe fragmentation pattern of macrocyclic ester, as follows: 480, molecular ion [C28H16O8]; 435, [C27H15O6]; 344, [C21H12O5]; 208, [C14H8O2];
104, [C7H4O]; 76, [C6H4]. These results indicate that breakdown is given at C-O bonds.
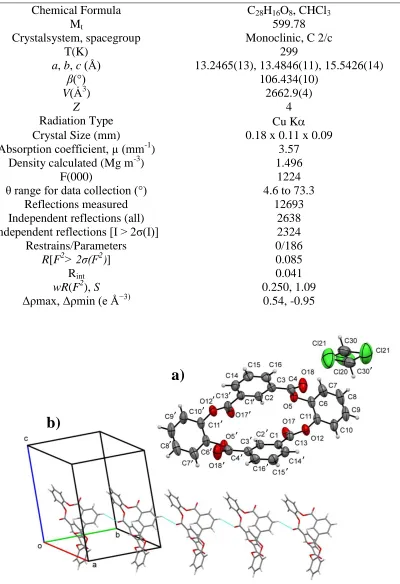
The crystal structure of the synthesized macrocyclic ester was determined (Table 1). The molecule is comprised of four benzene moieties linked cyclically by ester groups playing a role of spacers between the rings describing a boat conformation with tct relative configuration (see Fig. 1a) [18]. The observed conformation may be partly stabilized by intramolecular C2-H2‧‧‧O5 contacts, which also introduces molecular distortion making half of the rings conformationally different. This phenomenon is observed in the dihedral angles between the least square planes through the benzene rings C2-C3-C14-C16-C16-C1’/C6-C7-C8-C9-C10-C11 and C1-C2’-C3’-C4’-C15’-C16’/C6-C7-C8-C9-C10-C11 with values of 75.29(15) ° and 46.29(15) °, respectively.
The structure have a Z’ value of 0.5 which is a result of the coincident symmetry of the molecule with the two fold rotation axis along [010] which falls in the center of the molecule at (1/2,y,1/4).
Table 1.Crystal data and structure refinement details
Chemical Formula C28H16O8, CHCl3
Mt 599.78
Crystalsystem, spacegroup Monoclinic, C 2/c
T(K) 299
a, b, c (Å) 13.2465(13), 13.4846(11), 15.5426(14)
β(°) 106.434(10)
V(Ȧ3
) 2662.9(4)
Z 4
Radiation Type Cu K
Crystal Size (mm) 0.18 x 0.11 x 0.09
Absorption coefficient, µ (mm-1
) 3.57
Density calculated (Mg m-3) 1.496
F(000) 1224
θ range for data collection (°) 4.6 to 73.3
Reflections measured 12693
Independent reflections (all) 2638
Independent reflections [I > 2σ(I)] 2324
Restrains/Parameters 0/186
R[F2> 2σ(F2)] 0.085
Rint 0.041
wR(F2), S 0.250, 1.09
Δρmax, Δρmin (e Å−3) 0.54, -0.95
’ ’ ’ ’
’ ’ ’
’ ’
’ ’ ’
’ ’ ’
’ ’ ’
’
a)
b)
3.2. Determination of Pb(II) in the presence of Cd(II) using modified electrode with L
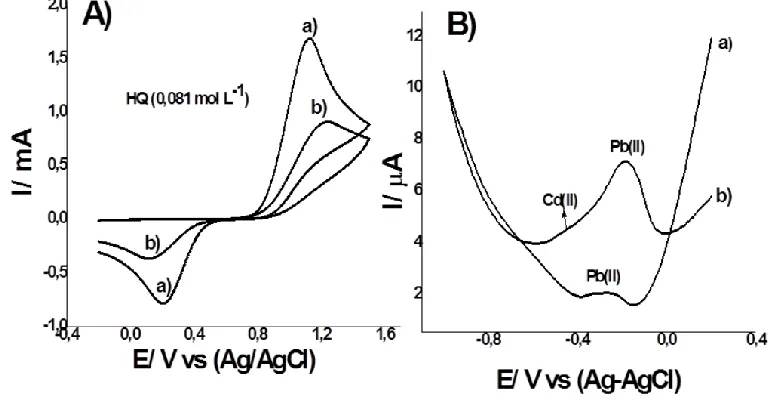
With the objective of verifying (L) immobilized on glassy carbon surface, hydroquinone (HQ), Pb(II) and Cd(II) as model solutions were studied. Figure 2A shows the cyclic voltammograms of HQ (0.081 M) in acetate buffer solution at pH 4.0 (0.1 mol L-1), using a glassy carbon electrode (GCE, curve a) and immobilized macrocyclic ester glassy carbon electrode (GCE-L, curve b). With the electrode without L, the redox peak of the HQ reaction (C6O2H2 → C6O22- + H2+ + 2e-) were found at
1.12 V (anodic peak current) and 0.20 V (cathodic peak current) [15]. However, using GCE-L, the anodic and cathodic peak currents were found near the same potential, but anodic and cathodic currents decreased almost 75%. Electron transfer was affected by the macrocyclic film. We think that Lon the electrode surface possibly acts as a screen that blocks electron transfer of organic molecules. These changes in the voltammograms confirmed that L has been immobilized on the electrode surface. Similar results were reported with the ferrocyanide/ferricyanide systemby using other macrocyclic compounds [7]. One well-developed peak appeared for Pb (II) (4.9 µg L-1) with the GCE-L (curve b, Fig.2B), confirming the formation of the complex. Anodic peak current is higher compared to the unmodified electrode (curve a, Fig.2B). Serrano et al., reported two welldeveloped stripping peaks at -0.80 and -0.53V for Cd (II) and Pb (II), respectively, using crown ether-modified glassy carbon electrode [7]. In our measurements, the oxidation potential for lead was higher because desorption requires more energy. Probably, the complex formed between macrocyclic ester and lead presents high stability.The GCE-L modified electrode prepared ex situ showed greater selectivity for lead and not for cadmium.
Figure 2. Cyclic voltammograms (A) hydroquinone (HQ) 0.081 ,mol L-1; using GCE (curve a) and GCE-L modified electrode (curve b) in acetate buffer (pH 4.0). (B) SWASV’s of Pb (II) and Cd (II) 4.9 µg L-1
[image:7.596.101.485.442.640.2]
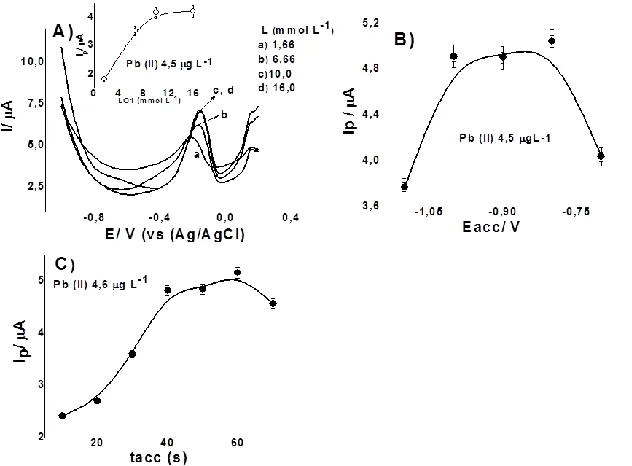
In order to find the optimum conditions (highest sensitivity) for Pb (II) determination using GCE-L, the influence of various parameters, like concentration of (L), tacc, and Eacc on peak current were studied. Concentrations of (L)0.16 to 16.0 mmol L-1 were investigated (Fig.3A). The experimental conditions were: Pb (II), Cd (II) 4.5 μg L-1;pH 4.0 (acetate buffer), tacc 60s, and Eacc -1.0V. Anodic peak current increases when (L) concentration is changed from 0.16 to 10.0 mmolL-1, and at higher concentration it remains constant. An (L) concentration of 10.0 mmolL-1 yields the best sensitivity and was selected for further measurements.
Anodic peak current dependence on accumulation potential for Pb (II) was examined from -0.7 to -1.1 V(Fig. 3B). Anodic peak current was almost constant between -0.7 and -0.9 V. -0.8V providing the maximum anodic peak current and was selected for future measurements. Variation of the accumulation time anodic peak current increased linearly with accumulation time up to 80 s; an accumulation time of 60 s was chosen as optimum (Fig. 3C).
Figure 3. Optimal experimental parameters on anodic peak current for Pb (II) 4.75 μg L-1. A) Effect of concentration of L; B) accumulation potential (Eacc) and C) accumulation time (tacc). Other conditions as in Fig. 2.
3.2.1. Analytical parameters
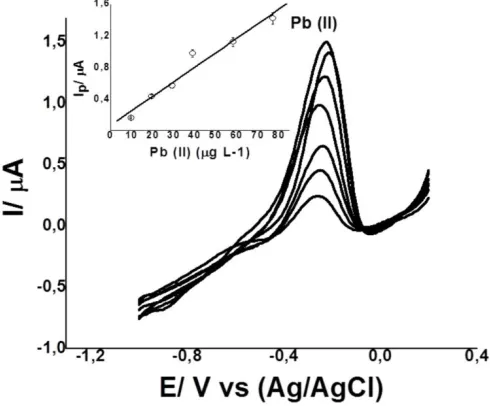
The calibration graph of Pb (II) was obtained under optimized conditions: pH 4.0 (200 μL of 0.1 mol L-1 acetate buffer); (L) concentration 10.0 mmol L-1; tacc 60 s; Eacc-0.80 V. Under these conditions, anodic peak currents were proportional to the concentration of Pb (II) over the 1.0-80.0 µg L-1 range (Fig. 4), with a detection limit (3Sxy/b) of 0.33µg L-1.Where Sxy is the random error in x and
y, and b is the slope [19]. Precision expressed as the relative standard deviation (RSD) was 1.2% for seven successive measurements of the same sample containing 4.5 μg L-1 of Pb(II).
With respect to sensibility at Pb (II) were reported values between 1.5 and 3.3 µg L-1 and 1.2 and 8.0µg L-1
[image:8.596.141.457.291.524.2]
measurements, the sensibility of Pb (II) was equally satisfactory. These reports have been summarized in table 2
[image:9.596.177.422.106.309.2]Figure 4. SWASV and calibration curves for increasing concentrations of Pb (II) and Cd (II) with GCE-L. Conditions: pH 4.0 (acetate buffer); Eads: -0.8V; tads: 60s. Other conditions as in Fig. 2.
Table 2. Detection limit for lead using others ligand and electrodes.
Technique Electrode Ligand DoL (µg L-1)
1.30 1.65 ˂100
20 0.33
Reference
ASV GCE CB-18-crown-6 and
CB-15-crown-5
7
ASV SPCE Crown-ethers nature 20
ASV CPE 18-crown-6 11
ASV CPE 18-crown-6 13
ASV GCE L This work
GCE: glassy carbon electrode; CPE: carbon paste electrode; CB-18-crown-6: 4-carboxybenzo-18-crown-6; CB-15-crown-5: 4-carboxybenzo-15-crown-5; SPCE: screen-printed carbon electrode; Crown-ethers nature: dibenzo-24-crown-8 and tetrathiacyclododecane 12-crown-4; 18-crown-6; dibenzo-18-crown-6, L: New macrocyclic ester.
3.2.2. Interference studies and validation of the method
The usefulness of the present method was evaluated by determining Pb (II) in a model solution doped with Pb (II) 10.0 µg L-1
in the presence of Cd, Mo, Ni, Cu, and Zn (100 mg L-1). An aliquot of 20 μL of the model solution sample and aliquots of standard Pb(II) (5 mg L-1
) were added into the electrochemical cell. Pb (II) was quantified by standard addition method, obtaining 12.0 ± 0.4 and 11.8 ± 0.3 μgL-1
[image:9.596.44.504.410.535.2]
presence of Cd (II) because their reduction potentials are close to that of Pb (II); however, in this case in the presence of Cd (II) no signal was observed.
3.2.3. Real samples analysis
The developed electrode was applied to the determination of Pb(II) in commercial mineral and river waters and tap water without previously treatment. Pb(II) concentration was 0.9 ± 0.1 μg L−1 In the other samples of water was not detected, possibly the concentration of Pb (II) was below the of detection limited.
4. CONCLUSIONS
In summary, we synthesized and characterized a new air stable macrocyclic ester formed by reacting catechol with isophthaloyl chloride. The molecular structure of L was confirmed through X-ray diffraction. The present work shows that this new macrocycle ester can be explored to modify electrode surface to improve its surface area, conductivity, and selectivity toward quantification of lead.
SUPPLEMENTARY DATA
Crystallographic data has been deposited with the Cambridge Crystallographic Data Centre, CCDC numbers 1477667, copies of this information may be obtained free of charge from CCDC, 12 Union Road, Cambridge, CB2 1EZ, UK (fax: 44-1223-336-033; e-mail: [email protected] or www: http://www.ccdc.cam.ac.uk).
ACKNOWLEDGEMENTS
The authors express their gratitude to Universidad de los Andes in Colombia for financial support from the Interfaculty project, and J. H. acknowledges the FAPA and Semilla projects at the Faculty of Sciences. E. N. acknowledges the financial support from Universidad de Ibagué (Projects 15-343-INT and 15-376-INT and 16-416-INT).
References
1. Á. Duarte, A. Borges, A. Zmozinski, M. Dessuy, B. Welz, J. de Andrade, M.G.R. Vale, Talanta. 146 (2016) 166.
2. H. Lachas, R. Richaud, A. Herod, D. Dugwell, R. Kandiyoti, K. Jarvis, Analyst. 124 (1999) 177. 3. J. Hardcastle, C. West, R. Compton, Analyst. 127 (2002) 1495.
4. J. Wang, J. Lu, S. Hocevar, P. Farias, B. Ogorevc, Anal. Chem., 72 (2000) 3218. 5. S. Hocevar, I. Švancara, B. Ogorevc, K. Vytřas, Anal. Chem., 79 (2007) 8639.
6. V. Guzsvány, H. Nakajima, N. Soh, K. Nakano, T. Imato, Anal. Chim. Acta. 658 (2010) 12. 7. N. Serrano, A. González-Calabuig, M. del Valle, Talanta. 138 (2015) 130.
8. Z. Wang, E. Liu, X. Zhao, Thin Solid Films. 519 (2011) 5285.
9. S. Anandhakumar, J. Mathiyarasu, K. Phani, V. Yegnaraman, Am. J. Anal. Chem., 2 (2011) 470. 10.P. Manisankar, C. Vedhi, G. Selvanathan, P. Arumugam, Microchim. Acta. 163 (2008) 289. 11.S. Prabhu, R. Baldwin, L. Kryger, Electroanalysis. 1 (1989) 13.
13.V. Ijeri, A. Srivastava, Anal. Sci., 17 (2001) 605.
14.L. Palatinus, G. Chapuis, J. Appl. Crystallogr., 40 (2007) 786. 15.G. Sheldrick, Acta Cryst., C 71 (2015) 3.
16.C. Macrae, I. Bruno, J. Chisholm. P. Edgington, P. McCabe, E. Pidcock, L. Rodriguez-Monge, R. Taylor, J. van de Streek, P. Wood. J. Appl. Cryst,. 41 (2008), 466.
17.G. Zbancioc, O. Florea, P. Jones, I. Mangalagiu, Ultrason. Sonochem., 19 (2012) 399. 18.K. He, X. Wang, X. Meng, H. Zheng, S. Suye, Sens. Actuators B Chem., 193 (2014) 212. 19.J. Miller, J.C. Miller, Estadistica y Quimiometria Para Quimica Analitica, Pearson Educacion,
(2005) Madrid.