Workplace Violence: Differences in perceptions of nursing work between those exposed and those not exposed – a cross sector analysis.
Desley Hegney, RN, PhD
Alice Lee Centre for Nursing Studies, The National University of Singapore and The University of Queensland, University of Queensland and Blue Care Research and Practice Development Centre, Queensland
Address: Block E3A, Level 3, Engineering Drive 1, Singapore 117574 Email: [email protected]
Telephone: +65 65163109 Fax: + 65 67767135
Anthony Tuckett, RN, MA, PhD
The University of Queensland, University of Queensland and Blue Care Research and Practice Development Centre, Queensland 4064
Address: PO Box 1539 Milton BC Queensland 4064 Email: [email protected]
Telephone: +61 7 3720 5405 Fax: + 61 7 3720 5332
Deborah Parker, RN, BA, MSocSci, PhD
The University of Queensland, University of Queensland and Blue Care Research and Practice Development Centre, Queensland 4064
Address: PO Box 1539 Milton BC Queensland 4064 Email: [email protected]
Telephone: +61 7 3377 3310 Fax: + 61 7 3720 5332
Robert M Eley, BSc(Hons), MSc, PhD
The University of Southern Queensland, Centre for Rural and Remote Area Health, Queensland, Australia, Queensland 4350
Address: West Street Toowoomba Queensland 4350 Email: [email protected]
Telephone: +61 4631 5477 Fax: +61 4631 5452
Acknowledgement: This and previous studies were funded by the Queensland Nurses‟ Union. We wish to thank all the members who responded to this survey for their participation.
Corresponding Author: Desley Hegney, RN, PhD
Alice Lee Centre for Nursing Studies, The National University of Singapore and The University of Queensland, University of Queensland and Blue Care Research and Practice Development Centre, Queensland
Address: Block E3A, Level 3, Engineering Drive 1, Singapore 117574 Email: [email protected]
ABSTRACT
Nurses are at high risk of incurring workplace violence during their working life. This paper reports the findings on a cross sectional, descriptive, self-report, postal survey in 2007. A stratified random sample of 3,000 of the 29,789 members of the Queensland Nurses Union employed in the public, private and aged care sectors resulted in 1192 responses (39.7%). This paper reports the differences: between those nurses who experienced workplace violence and those who did not; across employment sectors. The incidence of workplace violence is highest in public sector nursing. Patients/clients/residents were the major perpetrators of workplace violence and the existence of a workplace policy did not decrease levels of workplace violence. Nurses providing clinical care in the private and aged care sectors experienced more workplace violence than more senior nurses. While workplace violence was associated with high work stress, teamwork and a supportive workplace mitigated workplace violence. The perception of workplace safety was inversely related to workplace violence. With the exception of public sector nursing, nurses reported an inverse relationship with workplace violence and morale.
Keywords
INTRODUCTION
In 2007, a study of members of the Queensland Nurses‟ Union (QNU) was undertaken to
identify what factors impact upon nursing work in Queensland and how satisfied nurses were
with their work. The participants were registered (RNs), enrolled nurses (ENs) and assistants
in nursing (AINs). In Queensland, the work of registered and enrolled nurses is regulated by
the Queensland Nursing Council. Assistants in nursing (also known as carers, personal care
attendants) are unregulated providers of nursing care. The work of AINs and ENs is directly
or indirectly supervised by RNs. Approximately 80% of ENs and RNs are members of the
industrial union – the QNU. With no workforce numbers collected on AINs, the percentage
of membership is unknown.
Study respondents were asked to indicate if they had experienced workplace violence
(defined as: aggression and/or workplace harassment/bullying) within the last three months.
Those indicating workplace violence were then asked five further questions: the source/s of
the violence (clients/patients, visitors/relatives, other nurses, nursing management, other
management, doctors, allied health professionals, others); if their workplace had a policy for
dealing with aggressive behaviour of other staff (defined as nurses, management, doctors,
allied health professionals) and, if answering „yes‟ the adequacy of this policy (never or very
seldom, seldom, sometimes, mostly, always or nearly always); if the workplace has a policy
for dealing with aggressive behaviour of patients/clients/visitors and, if answering „yes‟ the
adequacy of this policy (never or very seldom, seldom, sometimes, mostly, always or nearly
always).
In the current literature, workplace violence is describe within the parameters of
physical or verbal assault or physical and non-physical violence.1 2 The definition used for
this study complies and is taken as physical or verbal violence which includes harassment.3
The source of workplace violence is primarily from patients or their relatives 3-10 however,
there is also a large proportion of workplace violence (known as horizontal violence) from
other health care professionals, particularly nurses.11-14
There is debate about the actual incidence of workplace violence towards nurses. This
debate exists because of under-reporting and lack of consistency in the definition of
workplace violence. However, there is international agreement that nurses are at high risk of
incurring workplace violence during their working life, regardless of the context in which
Employers are obliged to provide a safe place of work 15, 21, 22 and there have been
attempts to address the issue of workplace violence. Various initiatives have come from
government (legislation, zero tolerance policies), organisations (policies/procedures,
environmental design, education of workers), and industrial bodies (zero tolerance).11, 15, 17, 19,
20
Most programs, however, have focused on the individual rather than the climate of
workplace violence (in the community as well as the organisation).7, 9, 10, 12, 23 While large
scale evaluations have not been carried out on the major initiatives to reduce workplace
violence, research suggests that strategies such as organisation policies and procedures, the
„Zero Tolerance‟ policy and workplace training have been unsuccessful 8, 19, 21, 23-26
or have
given the wrong message 5, 23, 25 and that rather than declining, reports of workplace violence
have increased. This apparent increase in workplace violence reporting may be the result of a
greater knowledge by workers of workplace violence and a decrease in under-reporting rather
than an increase per se in workplace violence itself.3, 23
The consequences of workplace violence include physical (personal injury, physical
health) and psychosocial outcomes (post traumatic stress disorder, anxiety, fear, helplessness,
substance abuse, relationship problems, sick leave,) for the individual nurse 1, 4, 9-12, 14, 18, 24,
27-32
as well as costly implications (poor staff retention, property damage, poor attendance rates,
workers compensation costs, decreased productivity) for employers of nurses. 1, 5, 12, 14, 18, 27, 33
Workplace violence and its outcomes also have an impact on the quality of care delivered to
patients/clients/residents. 5, 16, 27, 31
At a time of nursing shortages, considerable attention has focused on the effects of
workplace violence on workforce recruitment and retention. 4, 14, 29, 32 Variables linked to lack
of job satisfaction such as workload, poor skill mix, poor communication between staff, poor
management support and low morale have all been found to impact the incidence of
workplace violence. 2, 3, 14-16, 20, 29, 34 Further, nurses who find themselves short staffed, forced
to rush care, increase the dissatisfaction of patients and their families on the care they receive
so increasing the likelihood of workplace violence. 20 Compounding the issue is the lack of
funding available for health care, thus increasing waiting times for services and increasing the
frustration of patients and their relatives. This frustration is often then directed at the
providers of health care (particularly nurses) 5, 10, 15, 30 who are often attempting to provide
The results of the analysis of workplace violence data from two similar studies (2001,
2004) into the incidence of workplace violence amongst Queensland nurses have been
published previously. 3 This paper reports on the results of a similar study to those conducted
in 2001 and 2004 35, 36 that was undertaken in 2007 which asked the same questions about
exposure to workplace violence and policies in place to deal with this. The focus of this
paper, not reported previously, is the analysis of these 2007 data from the perspective of
those nurses who reported experiencing workplace violence in the previous three months
compared with those who did not. Similar to the previous studies, the data are also analysed
according to the context of practice (in this case the sector of employment – public sector
(acute hospitals and community nursing), private sector (acute hospitals and domicillary
nursing) and aged care [public and private]).
METHOD Aim of the study
The overall aim of the 2007 study was to ascertain the factors impacting nursing work and to
compare the 2007 data with the data collected in 2001 and 2004. The results of this analysis
would then inform the strategic planning of the QNU.
The specific aims of this paper are to ascertain if there are any differences between:
- Those nurses who report exposure to workplace violence compared to those who do not and to report on these differences; and
- To ascertain if these perceptions differ across employment sectors.
-Research design
This cross sectional study is a descriptive, self-report, postal survey of members of the QNU
undertaken in October and November 2007.
The study was stratified to enable determination of differences across the sectors of nursing.
To achieve this goal data were gathered using a mail-out over three nursing sectors (public
acute plus community; private acute, aged care [public and private]). There were 29,789
members in the QNU database in 2007. Of these, 69.5% were from the public sector, 15.9%
from the private sector and 14.6% aged care. To ensure adequate levels of precision in
estimating key measures a total of 3000 questionnaires were distributed to 1000 randomly
selected nurses in each sector. There were 1192 responses constituting a response rate of
39.7%.
Survey Instrument
The questionnaire utilised in this study was almost identical to that used in 2001 and 2004
surveys of QNU members. Only minor changes were incorporated to the original
questionnaires. Piloting of the instrument was unwarranted because the data collection
process was unchanged from that used for the previous studies. The few items modified or
added to were pre-tested by independent experts.
The questionnaire containing 75 questions was divided into eight sections – „Your
Current Employment, Your Working Hours, Your Responsibilities Outside Work, Your
Professional Development, Perceptions of Work and Nursing Work, the Nursing Work Index,
About You and, You and Nursing Work‟. The 12 questions reported herein fell in the
sections on Your Working Conditions and Perceptions of Work and Nursing Work. Answers
to the questions were categorical nominal (yes or no; n=3), continuous interval from Never to
Always (n = 2) or continuous interval from Extremely True to Extremely False (n = 6). A
free choice of offered options was available for one question.
Procedure
The researchers were provided with coded listing of QNU members. From these, using
random numbers, 1000 participants were selected from each of the three sectors, resulting in
a total sample of 3000. The survey, along with a Plain Language Statement and Reply Paid
envelope was mailed to these participants by the QNU. Three weeks after the first mail out, a
addresses of the membership. The participants were provided with a reply paid envelope in
which to return the questionnaire directly to the research team. At no time has the QNU
access to any identifiable data. Data on completed questionnaires were scanned into the
software program Verity TeleForm (v9.0 Verity Inc, Sunnyvale, CA, USA) and exported
after clearing into SPSS.
Data Analysis
Analyses were undertaken using SPSS Version 15. 5. Data are nominal and non parametric
and comparisons were undertaken on an item-by-item basis. Comparisons were undertaken
within and across sectors by cross tabulations. Differences assessed by chi-squared testing
with an alpha level of 0.05 required for significance.
Limitations of the study
The results reported in this paper apply to nurses who were financial member of the QNU in
October and November 2007. Non-response bias was a potential limitation to the study.
Checks where made against the QNU database regarding the distributions of sector of
employment, sex, age and job designation. No differences were determined for sex or age or
job. However if QNU membership is taken into consideration, a limitation of this sampling
method is under-representation of nurses in the public sector while there is an
over-representation of nurses from the private and aged care sectors.
Ethics
The study was approved by the Human Research and Ethics Committees of the University of
Queensland, Brisbane and the University of Southern Queensland, Toowoomba, Australia.
RESULTS
Respondents were asked if they had experienced workplace violence in the last three months.
Of the 1143 respondents to this question 522 (45.7%) indicated “yes”. There are significant
sector effects with less violence experienced in the private acute 35.8% of 360 respondents
than in the public acute (53.4%, n=309) and aged care (49.7%; n = 348) sectors (2 = 23.723,
df =2, p<.001).
Sources of workplace violence
Those who said “yes” to the previous question were asked to identify the perpetrators of the
violence from a list (Table 1). Respondents could identify more than one perpetrator.
Clients/patients/residents were the greatest source of violence. There were highly significant
effects across sectors in sources of that violence. “Clients/patients/residents”, “other management”, “visitors/relatives” and “other nurses” were less likely to be the source of
workplace violence in the private sector and “doctors” the least in the aged care sector.
Demographics and workplace violence experience
There were no significant differences in reported workplace violence with nurses‟ sex (2 =
.571, df = 1, p = .45) or age (2 = 7.987, df=5, p=.157). Nor was their any difference
associated with job level (AIN, EN, RN) in public employment (2 =16.840, df = 11, p =
.113). However, there were statistically significant differences with the level of nurse in
private employment (2 =16.297, df = 8, p=.039) with those nurses employed as AINs and
ENs more likely to report experiencing workplace violence than any level of RN. These
results were the same for the public acute and private acute sectors. There were insufficient
numbers of aged care nurses throughout the job range in public employment for analysis,
however comparison of AIN with RN1 in the private aged care indicated that AIN were more
likely to report violence than RN1 (57.4%, n = 66 versus 43.2%, n = 32) (2 =3.610, df = 1,
p=.057
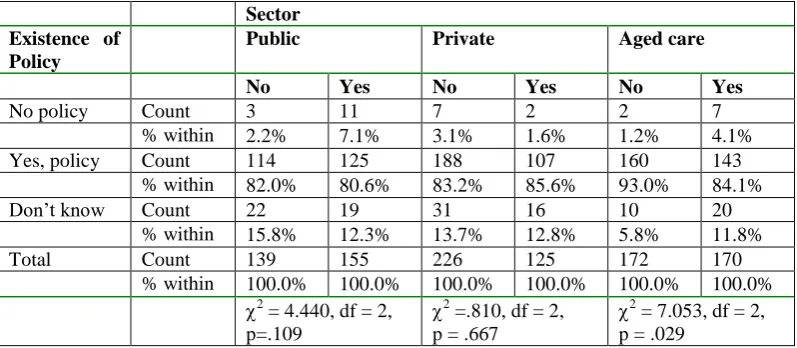
There was no difference in the known existence of a policy for managing workplace violence
by staff between those that said that they had experienced workplace violence (83.3%) and
those that had not (86.0%, 2 = 1.881, df =2, p=.390). Nor was there any sector effect (2 =
4.551, df = 4, p = .337). However, within sectors there was a significant effect with 8.9%
fewer aged care nurses who had experienced violence knowing if there was a policy in place
and 6% more not knowing if there was a policy than among the aged care nurses who have
not experienced violence (Table 2).
Table 2 here
Of those who did experience workplace violence 39.3% stated that their workplace policy for
violence from other staff was “never, very seldom or seldom” adequate. This compared to 7.2% of those who didn‟t experience violence. There were no differences among sectors (2
=
12.542, df = 10, p=.250), however, within all sectors there were large differences between
those who answered “yes” and “no”. The perceived adequacy of policy by those who had
experienced workplace violence was much smaller (Table 3).
Table 3 here
Workplace policy and the adequacy of this for workplace violence by patients/clients/residents
Similar results were seen for the existence of workplace violence policy by clients/ patients/
residents/ visitors. Overall there was no difference between those who did and didn‟t
experience violence (2 = 1.487, df 2, p=.475) nor sector effect for those that did experience
violence (2 = 8.947, df = 4, p=.062). Within sectors there was a difference for aged care (2
= 9.697, df = 2, p = .008) but not for the public (2 = 8.080, df = 2, p=.018) or private (2 =
1.131, df = 2, p = .568) acute sectors. In aged care only 74.7% of nurses who reported this
source of violence knew of a policy compared to 86.6% of those who reported no violence.
Among all nurses there were sectors differences in the perceptions of the adequacy of the
policy for violence perpetrated by patients/clients/residents/families (2 = 52.745, df =10,
p<.001). The main effect was in the private acute sector where respondents perceived that
policies were more adequate. However, when only those who experienced violence were
compared there were no sector differences (2 = 9.703, df = 10, p = .467) and 29.2% of this
those who didn‟t experience violence. Within each sector there were significant effects with
the adequacy of the policy being perceived to be far less in those who had experienced
violence (see Table 4).
Table 4 here
Further analysis of perceptions of nursing and nursing work was undertaken comparing
responses of nurses who had and had not experienced violence in the past three months both
across and within sectors.
Nursing work is emotionally challenging
There were no sector differences (2 = 9.618, df = 10, p = .475) among the “yes” cohort of
nurses where 81.2% said the job was “extremely” or “quite” emotionally challenging. This
figure compared to 67.9% for those nurse who reported no experienced violence. Among
these “no” respondents there were sectors differences (2
28.764, df 12, p = .004) with 77.1%
of the aged case sector considering the job to be emotionally challenging compared to 63.9%
and 63.5% for the public and private acute sectors, respectively. Within sectors there were
also highly significant differences between “yes” and “no” respondents for both acute sectors
(Table 5).
Table 5 here
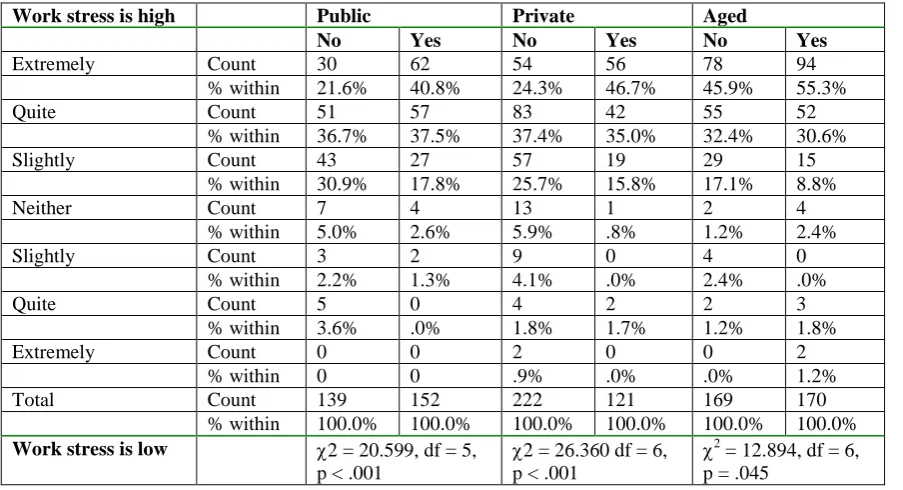
Work stress is high
Over 80% of the “yes” cohort considered work stress to be “extremely” or “quite” high
compared to 65% in the “no” group. Across sectors there were differences in both the “yes”
(2 = 23.663, df = 12, p = .023) and “no” group (2 = 39.918, df 12, p<.001) with aged care
sector respondents perceiving the highest levels of work stress in both instances. Within each
sector the perceived stress was significantly higher among those who said “yes”. (Table 6)
Table 6 here
Workplace lacks teamwork and support from colleagues.
There were no sector differences (2 = 12.885, df = 12, p = .377) in perception of teamwork
and support for “yes” respondents and overall 32% of these nurses thought that teamwork
equivalent figure was 15.6%. However in this “no” group there with highly significant sector
difference (2 = 40.732, df 12, p<.001) with more aged care sector nurses agreeing with the
statement compared to the acute sectors Within sectors there were significant effects between
“yes” and “no” respondents in the private acute and aged care sectors with the teamwork
perceived to be more lacking among the nurses who had experienced work place violence
(public acute 2 = 10.828, df = 6, p = .094, private acute 2 = 31.543 df = 6, p < .001, aged
care 2 = 19.295, df = 6, p = .004).
Workplace is safe
Among nurses who had experienced violence only 43% considered their workplace to be
extremely safe or quite safe. There were no sector differences (2 = 25.329, df = 12, p = .013)
in this group with the public sector nurses considering their work sector to be less safe than
the two other sectors. Among nurses who had not experienced workplace violence 63.2%
thought it to be extremely safe or quite safe and there were sectors differences (2 = 27.466,
df 12, p=.007) with the lowest perception of safely also in the public acute sector. Within
sectors both the public acute and aged care sectors showed differences in perceptions
between the “yes” and “no” groups (Table 7)
Table 7 here
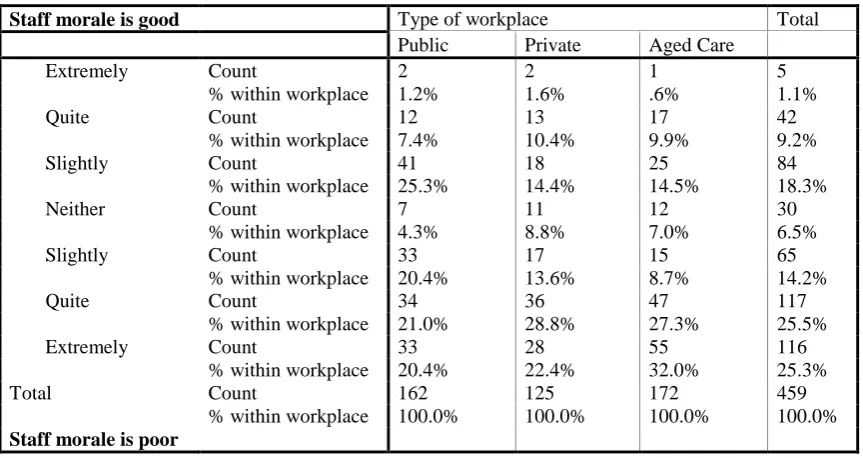
Nursing staff morale.
Among nurses who had experienced violence only 10.3% considered nursing staff morale to
be extremely or quite good (Table 8). There were sector differences (2 = 25.651, df = 12, p <
.012) with public sector nurses considering their workplace morale to be the highest. In
comparison 30.2% of nurses who had not experienced violence considered morale to be
“extremely” or “quite” good and there were no differences among sectors (2
= 17.509, df =
12, p < .131). Highly significant effects were found within each sector in morale. Those who
had experienced workplace violence were more likely to consider morale to be poorer than
those and had not (public acute 2 = 30.784, df = 6, p < .001, private acute 2 = 38.245 df = 6,
p < .001, aged care 2 = 34.085, df = 6, p < .001).
Table 8 here
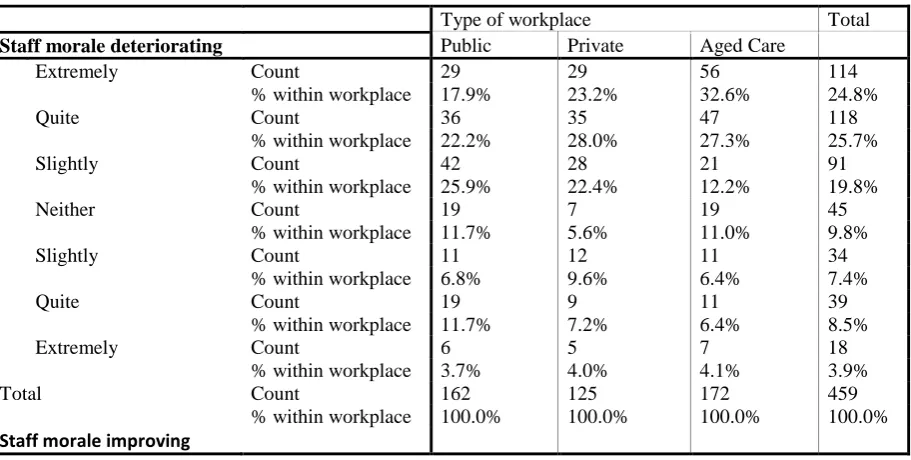
Among nurses who had experienced workplace violence 50% considered staff morale to be
deteriorating “extremely” or “slightly (Table 9) and more aged care nurses noted “extreme”
deterioration (2 = 24.521, df = 12, p < .017). In contrast among nurses who had not
experienced workplace violence only 28.6% considered morale to be deteriorating
“extremely” or “quite”. However, there was also a significant effect for the “no” cohort (2 =
30.183, df = 12, p=.003) with the largest perceived deterioration in the aged care sector.
Table 9 here
Within sectors there were significant differences between those who had and had not
experienced violence (public acute2 = 17.317, df = 6, p = . 008; private acute 2 = 36.665, df
= 6, p < .001; aged care 2 = 26.560, df = 6, p < .001). In each case those who had
experienced violence considered the morale to be deteriorating more than those who had not.
DISCUSSION
Levels and sources of workplace violence
While nursing is recognised as a high risk occupation, the international data do not provide a
consistent view of the incidence of workplace violence among nurses because no one study
has used a consistent definition of workplace violence. Where there have been attempts to
quantify the extent of workplace violence among nurses it appears that the incidence of
workplace violence is rising 3, 37. There are many causes postulated for this increasing level of
workplace violence including:
a) The focus on workplace violence (for example the „Zero Tolerance policy) has raised
the awareness of nurses and they are more likely to report workplace violence.3, 37
However, elsewhere nurses continue to under-report workplace violence. 6, 13, 17, 32, 34.
The main cause of under-reporting violence nurses receive from
patients/clients/residents, is accepting it as normal in their nursing work 6, 26, 29, 34.
Other reasons for under-reporting incidences of workplace violence include: poor or
unknown reporting mechanisms 17, 34; fear of reprisals by senior management 6, 34;
no action will be taken 17, 25; an increase in victimisation from bullies within the
workplace (particularly if they are subject to horizontal violence) 11, 17, 25; and their
gender (male). 38
b) The society in which we live has increasingly become more violent and/or more
tolerant of violence.23
c) Within many workplaces there is a climate which encourages workplace violence.7, 9, 11
The results of the 2007 study show a lower incidence of workplace violence than a
previous Australian study 20. Furthermore, the data do indicate that there is no net increase in
workplace violence in the members of the Queensland Nurses Union who have responded to
this survey in 2001, 2004 and 2007. Rather, it appears that levels of workplace violence have
decreased from a higher level in 2004. However the results clearly show that the levels of
violence are still high and require greater attention. While the 2007 findings appear to be
inconsistent with reports of rising incidents of workplace violence internationally, the
international increase could be the result of other factors (as aforementioned) rather than an
actual increase in violence.
Similar to many previous studies into the sources of workplace violence, the major
source of workplace violence was from patients/clients/residents. 3, 5-8, 18, 22, 24, 30-33, 39
Policies for the control of workplace violence from other staff and patients/relatives The majority of the respondents here noted a policy in place to prevent and/or manage
workplace violence from other staff and/or from patients/relatives. This is consistent with
international best practice which suggests workplaces should have policy for the prevention
and management of workplace violence. 15, 17, 30 It is therefore consistent that those
respondents who had experienced workplace violence within the last three months were more
likely to believe that their workplace policy was ineffective.
Of interest is the finding that awareness of policy did not differ between those who had
and had not experienced workplace violence. This suggests that policies do exist and it is not
previous statements which have linked the presence of policies with decreased levels of
workplace violence and lower levels of reporting. 8, 11, 19, 24
A major finding here is that in the public sector, with its single overarching corporate
policy, the incidence of workplace violence is highest. This finding suggests that it may not
be the presence or absence of a policy on workplace violence which decreases workplace
violence. Rather, it is the local work climate (or context) in which the policy is put into place
which has a greater effect. 11 Many contend that the existence of a policy is insufficient and
that there needs to be a multi-focal approach to successfully address workplace violence. 5, 6,
19, 22
Demographics of nurses and workplace violence
While there has been a focus on organisational initiatives, there is also a large body of work
that links the individual characteristics of nurses (e.g. age, experience in nursing, gender,
personality traits) to their level of experienced workplace violence. 2, 20, 22, 29, 31 This study
reported here did not measure the personality traits of nurses and analysis of the demographic
data of the participants did not find any significant association between gender, age of the
nurse, experience of the nurse and their reports of workplace violence. 24, 31, 33 Findings on the
job level of nurses were inconsistent between the sectors, with no difference in experience of
workplace violence and level of nurse in the public sector. However, in the private and aged
care sectors, those nurses who provide the most clinical care (RN level 1, ENs and AINs)
experienced more workplace violence than more senior RNs.3
The emotionally challenging nature of nursing work and work stress
Similar to our previous studies, this study found that nurses perceive nursing work to be
emotionally challenging.40 The findings also suggest that those nurses who find nursing most
emotionally challenging are more likely to report higher levels of workplace violence.
Similarly, those nurses who reported high levels of work stress were also those who reported
workplace violence. While there have been no studies which have linked perceptions of the
emotionally challenging nature of nursing work to workplace violence, there have been
is unclear if the work stress is created by the workplace violence or if the high level of stress
is caused by other factors (such as insufficient staff, high workload) and that this stress then
increases the incidence of workplace violence. 4, 6, 10, 12, 14 Regardless, those environments
with greater levels of work stress also experience greater levels of workplace violence.
Teamwork and support within the workplace
A supportive team within the workplace has been found to mitigate workplace violence. 14, 23
Similarly, working within a team which is unsupportive and where the nurse may experience
harassment and bullying has been associated with high levels of workplace violence. 14, 29
This study has found that nurses who perceive high levels of teamwork and support within
their workplace are less likely to have experienced workplace violence.
Safety of the Workplace
The findings of the 2007 study reflect those of our previous study and Spector et al‟s study
which found the perceived degree of workplace safety was inversely related to the incidence
of reported workplace violence. 3, 9 Additionally, the public sector nurses (who experienced
the highest level of violence) were more likely to believe their workplace was unsafe. This
finding has also been noted by other authors who believe that those nurses who perceive the
workplace to be unsafe are more likely to have experienced workplace violence. 2, 22, 30, 39
Morale
Nurses in this study who experienced workplace violence were more likely to believe that
morale was low and decreasing. The effect of workplace violence on morale has previously
been identified. 4, 11, 16, 27 These researchers linked low morale to the experience of workplace
violence. However here, public sector nurses (who had the highest levels of workplace
Arguably, whether the incidence is one percent or seventy percent, the long-term
consequences for the individual, the profession and the employer are well documented and
supported by the findings of this study. 15, 29 The personal costs are demonstrated by the high
levels of levels of workplace stress, the lack of feeling supported and/or being a member of a
team, perceptions of an unsafe workplace and lower perceptions of morale within the
workplace.
The impact of workplace violence on the profession of nursing is large. Previous
studies have shown that exposure to workplace violence can influence how a student would
perceive their future career. 4, 13 The aforementioned factors also impact on the profession if
both experienced and inexperienced nurses continue to exit the profession because employers
do not provide a physical and emotional safe place in which to work. 18
The context of practice
The higher level of workplace violence from patients/families in this study in the public
sector is consistent with the view that „state government workplaces are more likely to
experience workplace violence from patients/families‟.7 Elsewhere in Australia and here,
nurses in private hospitals were less likely to be exposed to workplace violence than nurses in
the public sector. 20 However, it is apparent that there are differences in the incidence of
workplace violence within a sector. For example, not all nurses working for the state
government (public sector) believed policies were effective despite working under the same
policy. This would reflect local differences impacting on the implementation of the policy.
Peek-Asa and colleagues found when evaluating the implementation of a standard policy
across workplaces that implementation differed (i.e. larger hospitals were more likely to have
implemented more aspects of the policy than smaller hospitals). 8 Similar to our previous
studies, these data highlight the challenges of nurses employed in the aged care sector. Data
revealed regardless of exposure to workplace violence, nurses in the aged care sector are
more likely to highlight the emotional challenges of this work and continue to perceive
morale to be deteriorating. In these cases, exposure to high levels of workplace violence
From an organisational perspective, this study clearly shows the impact of the local context
on the reported exposure to nurses to workplace violence. It appears that nurses employed in
the public sector, the majority of which perceive their policies to be adequate, have a greater
exposure to workplace violence than nurses in the other sectors. Employers must continue to
focus on prevention and management at the local level. A „one size fits all‟ policy which may
not take into consideration local nuisances is insufficient to address this major workplace
issue. Results suggest that workplace violence impacts on factors which influence job
satisfaction and therefore while workplace violence factors remain unaddressed there will
continue to be unnecessary attrition from the nursing workforce. 41
CONCLUSION
This study reveals that there was no net increase in workplace violence in the members of the
Queensland Nurses Union (Australia) who responded to a self-port postal survey in 2001,
2004 and 2007. Rather, it appears that levels of workplace violence in fact decreased from a
higher level in 2004. Nevertheless, results clearly suggest that the levels of violence are still
high and require greater attention. Exposure to workplace violence has implications for
individual nurses, the profession and the employer. Although the data demonstrate
consistencies and inconsistencies with other studies and do not provide any clearer picture on
the incidence of workplace violence among the nursing workforce, a caveat is required: a
focus on measuring accurately the incidence risks taking away from the need to control the
REFERENCES
1. Ferns T. Violence in the accident and emergency department - an international perspective.
Accident and Emergency Nursing 2005; 13: 180-185.
2. Gallant-Roman M A. Ensuring Nurses' Safety in Violent Workplaces. AAOHN Journal 2008; 56: 51-52.
3. Hegney D, Eley R, Plank A, Buikstra E, Parker V. Workplace violence in Queensland, Australia: the results of a comparative study. International Journal of Nursing Practice 2006; 12: 220-231. 4. Happell B. Putting all the pieces together: exploring workforce issues in mental health nursing. Contemporary Nurse 2008; 29: 43-52.
5. Hodge A N, Marshall A P. Violence and aggression in the emergency department: a critical care perspective. Australian Critical Care 2007; 20: 61-67.
6. Luck L, Jackson D, Usher K. Survival of the fittest, or socially constructed phenomena? Theoretical understandings of aggression and violence towards nurses. Contemporary Nurse 2006; 21: 251-263.
7. McPhaul K M, London M, Murrett K, Flannery K, Rosen J, Lipscomb J. Environmental Evaluation for workplace violence in healthcare and social sciences. Journal of Safety Research 2008; 39: 237-250.
8. Peek-Asa C, Casteel C, Allareddy V, et al. Workplace violence prevention programs in psychiatric units and facilities. Archives of Psychiatric Nursing 2009; 23: 166-176.
9. Spector P E, Coulter M L, Stockwell H G, Matz M W. Perceived violence climate: a new construct and its relationship to workplace physical violence and verbal aggression, and their potential consequences. Work & Stress 2007; 21: 117-130.
10. St-Pierre I, Holmes D. Managing nurses through disciplinary power: a Foucauldian analysis of workplace violence. Journal of Nursing Management 2008; 16: 352-359.
11. Hutchinson M, Vickers M H, Jackson D, Wilkes L. 'They stand you in a corner; you are not allowed to speak': Nurses tell of abusive indoctrination in work teams dominated by bullies.
Contemporary Nurse 2006; 21: 228-238.
12. Speedy S. Workplace violence: The dark side of organisational life. Contemporary Nurse 2006; 21: 239-250.
13. Hinchberger P A. Violence against female student nurses in the workplace. Nursing Forum 2009; 44: 37-46.
14. Rocker C F. Addressing nurse-to-nurse bulling to promote nurse retention. OJIN: The Online Journal of Issues in Nursing 2008; 13.
15. Armstrong F. Keeping nurses safe: an industry perspective. Contemporary Nurse 2006; 21: 209 - 211.
16. Carmody M. No longer 'a private matter': Collective action against the manifestations of violence. Contemporary Nurse 2006; 21: iii - iv.
17. Clements P T, DeRanieri J T, Clark K, Manno M S, Kuhn D W. Workplace violence and corporate policy for health care settings. Nursing Economics 2005; 23: 119-124.
18. Cubit K, Farrell G. Aggression in nursing: A time to look closely at aged care? Contemporary Nurse 2006; 21: 264-266.
19. Farrell G, Cubit K. Nurses under threat: a comparison of content of 28 aggression management programs. International Journal of Mental Health Nursing 2005; 14: 44-53.
20. Farrell G A, Bobrowski C, Bobrowski P. Scoping workplace aggression in nursing: findings from an Australian study. Journal of Advanced Nursing 2006; 55: 778-787.
21. Warne S, Walters H. Pressure rising against violence. Australian Nursing Journal 2006; 14: 21-24.
23. Paterson B, Leadbetter D, Miller G. Beyond Zero Tolerance: a varied approach to workplace violence. British Journal of Nursing 2005; 14: 810-815.
24. Hills D. Relationships between aggression management training, perceived self-efficacy and rural general hospital nurses' experiences of patient aggression. Contemporary Nurse 2008; 31: 20-31.
25. Holmes C. Violence, zero tolerance and the subversion of professional practice. Contemporary Nurse 2006; 21: 212 - 227.
26. Maguire J, Ryan D. Aggression and violence in mental health services: categorizing the experiences of Irish nurses. Journal of Psychiatric and Mental Health Nursing 2007; 14: 120-127. 27. Oztunc G. Examination of incidents of workplace verbal abuse against nurses. Journal of Nursing Care Quality 2006; 21: 360-365.
28. Jackson D, McMurray A. Epilogue. Contemporary Nurse 2006; 21: 324-326.
29. Camerino D, Estryn-Behar M, Conway P M, van Der Heijen B I J M, Hasselhorn H-M. Work-related factors and violence among nursing staff in the European NEXT study: A longitudinal cohort study. International Journal of Nursing Studies 2008; 45: 35-50.
30. Catlette M. A descriptive study of the perceptions of workplace violence and safety strategies of nurses working in Level I trauma centres. journal of emergency nursing 2005; 31: 519-525.
31. Lundstrom M, Saveman B-I, Eisemann M, Astrom S. Prevalence of violence and its relation to caregivers' demographics and emotional reactions - an explorative study of caregivers working in group homes for persons with learning disabilities. Scand J Caring Sci 2007; 21: 84-90.
32. Robinson K M, Tappen R M. Policy recommendations on the prevention of violence in long-term care facilities. Journal of Gerontological Nursing 2008; 34: 10-14.
33. Lin Y-H, Liu H-E. The impact of workplace violence on nurses in South Taiwan. International Journal of Nursing Studies 2005; 24.
34. Ericksen A B. Violence in the workplace. RN 2008: 39-42.
35. Tuckett A, Parker D, Eley R, Hegney D. I love nursing but .. qualitative findings from Australian aged-care nurses about their intrinsic, extrinsic and social work values. international Journal of Older People Nursing in press.
36. Henwood T, Eley R, Parker D, Tuckett A, Hegney D. Regional Differences Among Employed Nurses: a Queensland Study Australian Journal of Rural Health in press.
37. Paterson B, Miller G, Leadbetter D, Bowie V. Zero tolerance and violence in services for people with mental health needs. Mental Health Practice 2008; 11: 26-30.
38. Findorff M J, McGovern P M, Wall M M, Gerberich S G. Reporting violence to a health care employer: a cross-sectional study. AAOHN Journal 2005; 53: 399 - 406.
39. King L A, McInerney P A. Hospital workplace experiences of registered nurses that have contributed to their resignation in the Durban metropolitan area. Curationis 2006: 70-81.
40. Hegney D, Eley R, Plank A, Buikstra E, Parker V. Workforce Issues in Nursing in Queensland, Australia: 2001 and 2004. . Journal of Clinical Nursing 2006; 15: 1521-1530. .
Table 1 Sources of workplace violence by sector
Public acute Private acute Aged care
Number of nurses 144 231 175
Number of perpetrators 313 365 355
Identity of perpetrators Percentage of responses
Clients/patients/residents** 35.5% 20.0% 36.3%
Other nurses* 21.4% 14.2% 21.7%
Visitors/relatives** 24.3% 11.8% 17.7%
Nursing management 14.1% 10.7% 15.2%
Doctors** 10.9% 12.6% 2.0%
Other staff 4.5% 2.2% 8.7%
Other management* 2.2% .5% 4.5%
Allied health professionals 2.2% .8% .3%
Other 1.0% .5% .6%
* p<.01, ** p< .001
Table 2 Workplace policy for violence by other staff: sector analysis Sector
Existence of Policy
Public Private Aged care
No Yes No Yes No Yes
No policy Count 3 11 7 2 2 7
% within 2.2% 7.1% 3.1% 1.6% 1.2% 4.1% Yes, policy Count 114 125 188 107 160 143
% within 82.0% 80.6% 83.2% 85.6% 93.0% 84.1%
Don‟t know Count 22 19 31 16 10 20
% within 15.8% 12.3% 13.7% 12.8% 5.8% 11.8%
Total Count 139 155 226 125 172 170
% within 100.0% 100.0% 100.0% 100.0% 100.0% 100.0% 2
= 4.440, df = 2, p=.109
2
=.810, df = 2, p = .667
2
[image:20.595.73.472.376.550.2]Table 3 Perceptions of the adequacy of the workplace policy by previous exposure of violence (YES) or no violence (NO) in the last three months: by sector.
Adequacy of Policy Public Private Aged Care
No Yes No Yes No Yes
Never/ Very seldom Count 3 30 2 22 5 29
% within 2.7% 23.3% 1.1% 20.8% 3.2% 19.9%
Seldom Count 5 27 9 20 8 22
% within 4.4% 20.9% 4.7% 18.9% 5.1% 15.1%
Sometimes Count 27 31 27 24 26 51
% within 23.9% 24.0% 14.2% 22.6% 16.6% 34.9%
Mostly Count 45 20 64 24 70 26
% within 39.8% 15.5% 33.7% 22.6% 44.6% 17.8%
Always Count 13 6 33 2 36 9
% within 11.5% 4.7% 17.4% 1.9% 22.9% 6.2%
Don‟t know Count 20 15 55 14 12 9
% within 17.7% 11.6% 28.9% 13.2% 7.6% 6.2%
Total Count 113 129 190 106 157 146
% within 100.0% 100.0% 100.0% 100.0% 100.0% 100.0% 2
= 49.559, df = 5, p < .001
2
= 73.063, df = 5 p < .001
2
= 68.077, df = 5, p < .001
Table 4 Adequacy of the policy for control of workplace violence from patients/clients/residents/families by sector and by previous exposure of violence (YES) or no
violence (NO) in the last three months.
Adequacy of Policy Public Private Aged Care
No Yes No Yes No Yes
Never/Very seldom Count 3 15 1 10 5 17
% within 2.7% 11.6% .6% 11.4% 3.4% 12.4%
Seldom Count 4 22 11 14 12 25
% within 3.6% 17.1% 6.5% 15.9% 8.1% 18.2%
Sometimes Count 36 33 19 27 31 49
% within 32.1% 25.6% 11.2% 30.7% 20.8% 35.8%
Mostly Count 41 34 57 21 64 32
% within 36.6% 26.4% 33.7% 23.9% 43.0% 23.4%
Always Count 14 11 40 6 32 10
% within 12.5% 8.5% 23.7% 6.8% 21.5% 7.3%
Don‟t know Count 14 14 41 10 5 4
% within 12.5% 10.9% 24.3% 11.4% 3.4% 2.9%
Total Count 112 129 169 88 149 137
% within 100.0% 100.0% 100.0% 100.0% 100.0% 100.0% 2 = 20.508, df = 5,
p = .001
2 = 49.047, df = 5, p < 001
[image:21.595.66.515.122.351.2] [image:21.595.67.506.442.670.2]Table 5 Nursing work is emotionally challenging: by exposure to workplace violence by sector and by previous exposure of violence (YES) or no violence (NO) in the last three
months.
Workplace challenging Public Private Aged Care
No Yes No Yes No Yes
Extremely Count 29 54 40 36 51 69
% within 21.2% 35.5% 18.0% 29.8% 30.5% 40.8%
Quite Count 59 71 100 63 77 69
% within 43.1% 46.7% 45.0% 52.1% 46.1% 40.8%
Slightly Count 35 20 49 19 30 25
% within 25.5% 13.2% 22.1% 15.7% 18.0% 14.8%
Neither Count 2 3 15 1 2 1
% within 1.5% 2.0% 6.8% .8% 1.2% .6%
Slightly Count 8 1 9 0 1 2
% within 5.8% .7% 4.1% .0% .6% 1.2%
Quite Count 4 3 8 2 4 3
% within 2.9% 2.0% 3.6% 1.7% 2.4% 1.8%
Extremely Count 0 0 1 0 2 0
% within .0% .0% .5% .0% 1.2% .0%
Total Count 139 152 222 121 169 170
% within 100.0% 100.0% 100.0% 100.0% 100.0% 100.0%
Workplace unchallenging 2 = 17.785, df = 5, p = .003
2 = 19.659 df = 6, p = .003
[image:22.595.65.540.140.398.2]2 = 6.391, df = 6, p = .381
Table 6 Perceptions of work stress by sector and by previous exposure of violence (YES) or no violence (NO) in the last three months
Work stress is high Public Private Aged
No Yes No Yes No Yes
Extremely Count 30 62 54 56 78 94
% within 21.6% 40.8% 24.3% 46.7% 45.9% 55.3%
Quite Count 51 57 83 42 55 52
% within 36.7% 37.5% 37.4% 35.0% 32.4% 30.6%
Slightly Count 43 27 57 19 29 15
% within 30.9% 17.8% 25.7% 15.8% 17.1% 8.8%
Neither Count 7 4 13 1 2 4
% within 5.0% 2.6% 5.9% .8% 1.2% 2.4%
Slightly Count 3 2 9 0 4 0
% within 2.2% 1.3% 4.1% .0% 2.4% .0%
Quite Count 5 0 4 2 2 3
% within 3.6% .0% 1.8% 1.7% 1.2% 1.8%
Extremely Count 0 0 2 0 0 2
% within 0 0 .9% .0% .0% 1.2%
Total Count 139 152 222 121 169 170
% within 100.0% 100.0% 100.0% 100.0% 100.0% 100.0%
Work stress is low 2 = 20.599, df = 5,
p < .001
2 = 26.360 df = 6, p < .001
[image:22.595.66.518.468.713.2]Table 7 Perceptions of safety of the workplace by sector and by previous exposure of violence (YES) or no violence (NO) in the last three months
Workplace is safe Public Private aged
No Yes No Yes No Yes
Extremely Count 8 1 34 9 38 18
% within 5.8% .7% 15.3% 7.4% 22.8% 10.7%
Quite Count 65 50 103 48 86 66
% within 46.8% 32.9% 46.4% 39.7% 51.5% 39.1%
Slightly Count 25 28 29 21 15 23
% within 18.0% 18.4% 13.1% 17.4% 9.0% 13.6%
Neither Count 13 17 18 10 11 22
% within 9.4% 11.2% 8.1% 8.3% 6.6% 13.0%
Slightly Count 14 24 20 12 7 18
% within 10.1% 15.8% 9.0% 9.9% 4.2% 10.7%
Quite Count 12 21 14 15 10 14
% within 8.6% 13.8% 6.3% 12.4% 6.0% 8.3%
Extremely Count 2 11 4 6 0 8
% within 1.4% 7.2% 1.8% 5.0% .0% 4.7%
Total Count 139 152 222 121 169 170
% within 100.0% 100.0% 100.0% 100.0% 100.0% 100.0% 2 = 18.878, df = 6,
p = .004
2 = 11.856 df = 6, p = .065
2 = 28.621, df = 6, p < .001
Workplace is unsafe
Table 8 Perceptions of the morale of the workplace among nurses who had experienced violence in the previous three months: sector analysis
Staff morale is good Type of workplace Total
Public Private Aged Care
Extremely Count 2 2 1 5
% within workplace 1.2% 1.6% .6% 1.1%
Quite Count 12 13 17 42
% within workplace 7.4% 10.4% 9.9% 9.2%
Slightly Count 41 18 25 84
% within workplace 25.3% 14.4% 14.5% 18.3%
Neither Count 7 11 12 30
% within workplace 4.3% 8.8% 7.0% 6.5%
Slightly Count 33 17 15 65
% within workplace 20.4% 13.6% 8.7% 14.2%
Quite Count 34 36 47 117
% within workplace 21.0% 28.8% 27.3% 25.5%
Extremely Count 33 28 55 116
% within workplace 20.4% 22.4% 32.0% 25.3%
Total Count 162 125 172 459
% within workplace 100.0% 100.0% 100.0% 100.0%
[image:23.595.78.516.121.387.2] [image:23.595.72.504.458.687.2]Table 9 Perceptions of the movement of morale in the workplace among nurses who had experienced violence in the previous three months: sector analysis
Type of workplace Total
Staff morale deteriorating Public Private Aged Care
Extremely Count 29 29 56 114
% within workplace 17.9% 23.2% 32.6% 24.8%
Quite Count 36 35 47 118
% within workplace 22.2% 28.0% 27.3% 25.7%
Slightly Count 42 28 21 91
% within workplace 25.9% 22.4% 12.2% 19.8%
Neither Count 19 7 19 45
% within workplace 11.7% 5.6% 11.0% 9.8%
Slightly Count 11 12 11 34
% within workplace 6.8% 9.6% 6.4% 7.4%
Quite Count 19 9 11 39
% within workplace 11.7% 7.2% 6.4% 8.5%
Extremely Count 6 5 7 18
% within workplace 3.7% 4.0% 4.1% 3.9%
Total Count 162 125 172 459
% within workplace 100.0% 100.0% 100.0% 100.0%
[image:24.595.77.533.121.351.2]