Spatially
Enablement
of
NRM
Communities
through
Spatial
Knowledge
and
Information
Network
Development
Dev Raj Paudyal, Kevin McDougall and Armando Apan
Faculty of Engineering and Surveying
Australian Centre for Sustainable Catchments
University of Southern Queensland, Australia
[email protected]; [email protected]; [email protected]
Abstract
A spatially enabled society (SES) is an emerging concept to make spatial information
accessible and available for the benefit of society. It is a concept where location, place
and other spatial information are available to government, community and citizens.
This is an important extension to the generational development and progression of
Spatial Data Infrastructure (SDI) as it seeks to contribute to wider societal benefits and
sustainable development objectives. This research paper investigates the social
dimension of SDI and the theoretical foundation for spatially enablement of catchment
communities. Two social science theories, namely, actor network theory (ANT) and
social network theory are utilized to better understand the relationships in spatial
information sharing and knowledge sharing across catchments. A network perspective
of SDI was explored through a case study of the Queensland Knowledge and
Information Network (KIN) project. Spatial information sharing processes among
regional Natural Resource Management (NRM) bodies were analyzed using an object
oriented modelling technique to assess the impact on catchment management
outcomes. The relationships among the knowledge network stakeholders and the
influence of these relationships to spatial information and knowledge sharing was
analyzed using social network analysis. The findings from this study suggest that a
network perspective of SDI assists in understanding the spatial information
management issues of catchment management and the broader goal of spatially
enablement of society.
K
EYWORDS:
Spatial data infrastructure, spatial information sharing, catchmentSpatially Enablement of NRM Communities through Spatial Knowledge and Information Network
Development
82
1.
Introduction
Spatial data infrastructure (SDI) and spatial technologies are now used routinely in
decision making to address some of the world’s most pressing societal problems. SDI
is now recognized by many countries as an essential modern infrastructure such as
information communication technology (ICT), electricity or transportation
(Ryttersgaard, 2001; Williamson et al., 2003). SDI application areas and custodianship
of spatial information are changing with the emerging technologies and the societal
needs. However, the overall objective of SDIs is it’s economic, social, and
environmental benefits to society with the emerging application areas now also
becoming part of the solution (Masser, 2011). The creation of economic wealth, social
stability and environmental protection can be facilitated through the development of
products and services based on spatial information collected by all levels of society
including governments, private sector and citizens (Rajabifard et al., 2010). These
objectives can be realized through the development of a spatially enabled community,
government and society.
Spatial enablement requires data and services to be accessible and accurate, well‐
maintained and sufficiently reliable for use by the majority of society which may not
be spatially aware (Williamson et al., 2010). Traditionally, the mapping and spatial data
infrastructure development was accomplished by government agencies, particularly
national/state mapping agencies. However, this is now not the case, with all sectors of
society increasingly becoming spatially enabled and contributing to the development
of SDI. The readily accessible and available spatial products such as Google Earth,
hand‐held navigation systems (Including smart phones, GPS, etc.), web 2.0 technology,
and social media has opened the way for spatial data collection and management and
is contributing towards the next generation of SDI development and a spatially
enabled society.
Within the SDI community there are differences in the understanding of SDI and its
potential benefits (Grus et al., 2007). Current progress of SDI initiatives shows that SDI
is viewed, defined and interpreted differently by different practitioners. However, SDI
has a common intent; to create an environment in which all stakeholders can
cooperate with each other and interact with technology to better achieve their
objectives at different political/administrative levels (Rajabifard et al., 2003). SDI is
about the facilitation and coordination of the exchange and sharing of spatial data
between stakeholders in the spatial data community. Traditionally, SDIs were
considered in a hierarchical context in which high levels of SDI (global, regional,
national) built upon lower levels (regional, local) (Rajabifard et al., 2003). The concept
came with the top‐down government approach where the custodians of spatial data
were the mapping agencies which led the building of SDI. Now, the concept of more
Spatially Enabling Government, Industry and Citizens
83
management and SDI development (Budhathoki et al., 2008; Paudyal et al., 2009). The
custodianship of spatial data is also no longer totally controlled by mapping agencies.
The hierarchical concept of SDI is now also being challenged and may not be an
appropriate model where all sectors of society are contributing for SDI design and
development. The social network analysis by Omran and Van Etten (2007) revealed
that a hierarchical structure could put serious constraints on spatial data sharing
where providers and users are contributing for SDI development. Another approach is
to view and examine SDIs from a network perspective. SDI practitioners (Crompvoets
et al., 2010; Omran, 2007; van Oort et al., 2010; Vancauwenberghe et al., 2009;
Vancauwenberghe et al., 2011) have examined SDI from network perspectives. Table 1
summarizes the main contributors of network perspective of SDI and their findings.
Contributor s
Study focus Strength Limitations
Omran and
van Etten
(2007)
Examined motivations for
spatial data sharing from
network topology
perspectives
The collective
properties of spatial
data sharing in
organizations was
investigated using
social network
analysis
Complex
interactions that
exist between
information type,
network structure,
and individual
behaviour, were
not explored
van Oort et al. (2010)
Examined how the network
can be used for sharing of
metadata, requests for help,
feedback on product quality,
innovative ideas, and so on
The findings
contributed to
methodological
research on
monitoring SDI
programmes
Only three
categories of
linkages between
users were studied
Vancauwen‐
berghe et al.
(2011)
Investigated SDI as the
collection of arrangements
that give shape to a network
of spatial data exchanges
Social network
analysis was used to
explore hierarchical
characteristics of the
Flemish SDI
Study was only
focused on four
types of spatial data
exchanges in formal
arrangements
Table 1. Main contributors of network perspective of SDI
Onsrud (2011) defined SDI as a network‐based solution to provide easy, consistent,
and effective access to geographic information and services to improve decision
making in the real world in which we live and interact. However, the principal
objective of SDI has not changed. It is to facilitate access to the geographic information
assets that are held by a wide range of stakeholders with a view to maximising their
overall usage (Masser, 2011). Existing studies on network perspective of SDI have
focussed on the spatially enablement of government agencies have only partially
[image:11.454.67.383.240.457.2]Spatially Enablement of NRM Communities through Spatial Knowledge and Information Network
Development
84
enablement of catchment communities with a particular emphasis on the user’s
perespectives.
The aim of this chapter is to explore the social dimension of spatial data infrastructure
and its theoretical foundation from a network perspective in a catchment
management context. This concept is examined through a case study of the
Queensland Knowledge and Information Network (KIN) project. Two research
approaches, namely, business process analysis and social network analysis are utilized
to explore the spatially enablement of catchment communities and examine
catchment SDI through these network perspectives.
2.
Theoretical
Framework:
Social
Science
Theories
There are many social theories which can contribute to spatial data infrastructure
design and development including actor‐network theory (Harvey, 2001); the theory of
planned behaviour (Wehn de Montalvo, 2003); social learning process (Rodriguez‐
Pabon, 2005) as cited in (Masser, 2011) and social network theory (Vancauwenberghe
et al., 2011). In the following sections, two social theories relevant to the network
perspective of SDI development and useful to contributing to spatially enabled society
are explored.
2.1 ANT and SDI Networking
Actor‐network theory (ANT) is a social theory, also known as the sociology of
translation, which emerged during the mid‐1980s, primarily with the work of Bruno
Latour (1987), Michel Callon (1986), and John Law (1992). ANT is a conceptual
framework for investigating society‐technology interactions and its primary building
blocks which are interactions between actors. It considers the whole world as
patterned networks of heterogeneous entities containing both human and non‐human
elements. Harvey (2001) defined actor networks as “the traces of relationships
between people, institutions, and artefacts connected by agreements and exchanges”.
Shi (2008) has used ANT for analysing and understanding the social and technical
nature of the watershed management process and decision tools.
The relevance of ANT theory for SDI development and GIS projects has been explored
by a number of authors (Crompvoets et al., 2010; De Man, 2006; Harvey, 2000;
Harvey, 2001; Reeve and Petch, 1999). Reeve and Petch (1999) argue that the success
of GIS projects depends upon the consideration of socio‐organizational contexts i.e.
actor‐network theory. Harvey (2001) puts the actor‐network of the professional GIS‐
user at the centre of the technology proliferation process. His approach incorporates
all network activities, including the technological ones. Based on research in
Switzerland, he asserts that actor networks and technology (GIS technology in this
case) affect one another. Data exchange stimulates the emergence of effective inter‐
organizational de facto standards and assists in maintaining actor networks, while
Spatially Enabling Government, Industry and Citizens
85
De Man (2006) argues that the process of developing networked assemblies is viewed
by ANT as interplay between heterogeneous actors‐technological and social elements
tied together in actor‐networks. The actor‐network perspective views SDIs as resulting
from continuous ‘translations’ between heterogeneous actors and, hence, as
potentially unstable. Alliances may be locked into collaboration but generally only
temporarily. He concludes that the actor‐network perspective identifies the dilemma
of how to navigate between the need for authority and some form of central control,
and active involvement (participation) in developing SDI initiatives. Crompvoets (2010)
argued that spatial data infrastructure is a complex actor‐network and the value of
spatial data can be added through complex value added network processes. Their
value is added through the translations between the different actors. Therefore, the
value of spatial data can be assessed realistically only when the interests, beliefs and
values of the individual actors are taken into account. This theory can be useful for
spatially enablement of community, government and society.
2.2 Social Network Theory and VGI
The social network theory is a social science concept that discusses the connection and
relationship in a social structure (Kadushin, 2004). According to Brass (1992), a social
network is a set of nodes or actors that are connected by a set of social relationships.
It views social relationships in terms of nodes and ties. Nodes are the individual actors
within the networks, and ties are the relationships between the actors. The actors can
be all types of social entities, for example, individuals, groups, organizations, or nation‐
states (Wasserman and Faust, 2008). The outputs from social network analysis can be
presented in a graphical or mathematical way (Keast and Brown, 2005). Graphical
analyzes concern the map of all of the relevant ties between the nodes and are often
displayed in a social network diagram, where nodes are the points and ties are the
lines. Mathematical analyzes involve advanced calculations (measure of centrality and
density of network or actors) and statistical analysis of the data.
Social network theory is being increasingly utilized for spatial data sharing and SDI
related research. Omran (2007) used social network theory and social network analysis
to explain spatial data sharing (SDS) behaviour. He used social network analysis to map
organizational networks and to determine the actual SDS behaviour. His study was
directed at understanding motivations for data sharing and how this was related to
network topology. Van Oort et al. (2010) utilized social network analysis to study
spatial data sharing across organizational boundaries. This study was focused on how
the network can be used for the purpose of sharing of metadata, requests for help,
feedback on product quality, innovative ideas, and so on. Vancauwenberghe et al.
(2011) argued that SDI can be viewed from network perspective and social network
analysis can be used as a method for SDI research. The case consisted of a sub‐national
SDI in Flanders and used social network analysis to analyze Flemish spatial data
Spatially Enablement of NRM Communities through Spatial Knowledge and Information Network
Development
86
A number of authors (Coleman, 2010; Elwood, 2008b; Goodchild, 2007, 2008; Kuhn
2007; McDougall, 2010) have begun to explore the application of social networking
theory to volunteered geographical information (VGI) and spatial information sharing.
The term VGI was first used by Michael Goodchild to describe the diverse practices of
observing, collecting and producing geographic information by citizens with no formal
expertise in the area (Goodchild, 2007). The first research specialist meeting on VGI
was organized under the auspices of NCGIA, Los Alamos National Laboratory, the Army
Research Office and The Vespucci Initiative and brought researchers around the globe
to discuss potential of VGI for spatial information management. Coleman (2010)
explored how the concept of VGI fitted within SDI. The utilization of VGI for spatial
information collection and updating is now widely used by OpenStreetMap, TeleAtlas,
NAVTEQ and Google Maps. Government organizations have now also realized the
power of VGI and crowd sourcing and are interested in utilising these technologies for
SDI development. The U.S. Geological Survey was an early examiner of this technology.
State governments in Victoria (Australia) and North‐Rhine Westphalia (Germany) are
two exemples of employing volunteered input to their mapping programs in the
government sector (Coleman, 2010).
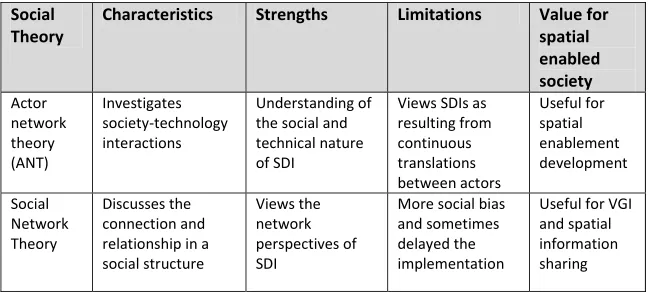
Table 2 summarizes the characteristics, strengths, and limitations of these two social
theories and their possible contribution to spatially enabled society.
Social Theory
Characteristics Strengths Limitations Value for
spatial enabled society Actor network theory (ANT) Investigates
society‐technology
interactions
Understanding of
the social and
technical nature
of SDI
Views SDIs as
resulting from
continuous
translations
between actors
Useful for
spatial enablement development Social Network Theory
Discusses the
connection and
relationship in a
social structure
Views the
network
perspectives of
SDI
More social bias
and sometimes
delayed the
implementation
Useful for VGI
and spatial
information
[image:14.454.64.388.327.474.2]sharing
Table 2. Social science theories and their contribution to spatial enabled society
2.3 Social Network Analysis
Social Network Analysis (SNA) is a research methodology that focuses on identification
of relationships between and among social entities, and on the patterns and
implications of these relationships (Scott, 2000). It is often applied to understand
network structures and identify operational efficiencies. There is a body of literature
on quantitative methods in social network analysis (Hanneman and Riddle, 2005;
Spatially Enabling Government, Industry and Citizens
87
Social networks relations can be analyzed for structural patterns that emerge among
actors. Thus, an analyst of social networks looks beyond attributes of individuals to
also examine the relations among actors, how actors are positioned within a network,
and how relations are structured into overall network patterns (Scott, 2000;
Wasserman and Faust, 1994). The ties are based on conversation, affection, friendship,
kinship, authority, economic exchange, information exchange, or anything else that
forms the basis of a relationship. In a network, flows between objects and actors and
exchanges, which might contain an advice, information, friendship, career or
emotional support, motivation, and cooperation, can lead to very important ties
(Kadushin, 2004 ).
There are various types of relationships which exist as suggested by Knoke and
Kuklinski (1982) including communication relations, boundary penetration relations,
instrumental relations, sentiment relations, authority/power relations, kinship and
descent relations. In social network analysis, a number of measures have been defined
to quantify and classify these relationships. Terms such as centrality, closeness,
betweenness and degreeness have been developed to better describe these
relationships (Freeman, 1979). These measures can assist in defining where an actor
sits within a network, where weak links exist or understanding the level of trust that
may be associated with a particular actor. These measures may be used to determine
if a user will share or diffuse their information or be willing to grant access to their
information (McDougall, 2010). The concept of centrality is widely used in the resource
management (Bodin et al., 2006) and network analysis (Vandenbroucke et al., 2009).
3.
Methods
In this paper, two analysis techniques have been utilized. First, business process
analysis using object‐oriented modelling techniques was undertaken on the
information sharing process within the knowledge network study. Secondly, social
network analysis was used to analyze the network perspectives of various actors
within the management of catchment spatial data infrastructure.
3.1 Study Area Description and Institutional Arrangement
The case study location of the Knowledge and Information Network (KIN) project is the
State of Queensland, Australia (Figure 1). Queensland has 14 regional natural resource
management (NRM) bodies spread from the far‐northern region of Torres Strait to the
New South Wales (NSW) border at southern end. These groups develop regional NRM
Spatially Enablement of NRM Communities through Spatial Knowledge and Information Network
Development
[image:16.454.65.379.86.286.2]88
Figure 1. Location Map of KIN Project Areas
The Queensland Regional Groups Collective (RGC) is the lead body for regional NRM
bodies in Queensland and represents the interests with the 14 regional natural
resource management (NRM) bodies in the state. It is quite a young organization
formed in 2002 and is dedicated to improving statewide NRM outcomes. The overall
aim of the KIN project was to understand how regional NRM knowledge and spatial
information can be better shared across Queensland. The funding for this project was
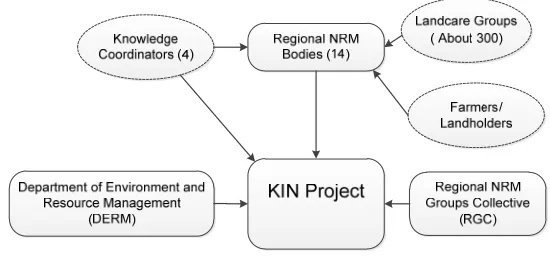
supported by both commonwealth and state governments. The main stakeholders of
KIN project were RGC, regional NRM bodies and Department of Environment and
Resource Management (DERM) as shown in Figure 2. The project was managed by RGC
and four knowledge coordinators. DERM was the state agency responsible for funding
support and overall coordination. Apart from these organizations/professionals, there
were about 300 landcare groups which were not directly involved in KIN project,
however regional NRM bodies also shared spatial information with these groups. The
landcare groups often create spatial data for their own use by utilising both
government data (authoritative data) and freely accessible spatial products (e.g.
Spatially Enabling Government, Industry and Citizens
[image:17.454.87.362.85.213.2]89
Figure 2. Institutional Settings
3.2 Business Process Analysis of the Spatial Information Sharing in the KIN
Project
Both primary as well as secondary data were collected in order to investigate spatial
information sharing between regional NRM bodies and state government organization
(DERM). Existing project documents/reports, data share agreements and published
papers were collected and studied to understand the current spatial information
sharing processes. Semi‐structured interviews were conducted with all 14 regional
NRM bodies, state government representatives and RGC staff. Both telephone and
face‐to‐face interviews were conducted. The staff involved in KIN project who were
experienced in spatial and knowledge management activities were interviewed.
The unified modelling language (UML) which is based on the object oriented (OO)
concept and standardized by the object management group (OMG) was used to
understand the spatial information sharing process. The unified modelling language
(UML) is a modelling tool for specifying, visualizing, constructing, and documenting the
artefacts of a system‐intensive process (Radwan et al. 2001). An UML use‐case
diagram was used to explore and demonstrate the spatial information sharing process.
Basically, the use‐case identifies the actors and activities which consist of three
elements: the actors, use‐cases and the system boundaries. In UML, the relationships
between actors and use‐cases can be shown using the concepts such as generalization,
‘uses’ and ‘extents’. Six main actors and nine use‐cases were identified for spatial
information sharing process and the use‐case analysis of spatial information sharing.
The characteristics and business process analysis of the spatial information sharing in
the KIN project is presented in section 4.1.
3.3 Social Network Analysis of KIN Project
The primary reason for undertaking the social network analysis was to measure the
Spatially Enablement of NRM Communities through Spatial Knowledge and Information Network
Development
90
this network analysis was 18 stakeholders consisting of six categories of
organizations/professionals including DERM, RGC, regional NRM bodies, landcare
groups, landholders/farmers, and knowledge coordinators. An online questionnaire
was constructed and questions were framed in order to specifically target and
measure responses regarding other stakeholders. The questionnaires were distributed
to a non‐random and purposive sample of representatives from regional NRM bodies,
DERM and RGC. Three questions were asked to quantify the frequency of interaction,
exchange of spatial information, and role of organization to achieve KIN goal.
Data were analyzed using UCINET 6 and NetDraw 2.11 programmes. Initially the data
was analyzed using the UCINET programme and visualized through NetDraw
programme. The value of InDegree centrality was used to measure the relationships
between project participants. Three variables which were used for this analysis were
frequency of interaction, rate of flow of spatial information and role of organization
(see Table 3).
Level of Analysis
Measure Relationship Variable used
Network Analysis InDegree Centrality Communication relationship
Frequency of Interaction
InDegree
Centrality
Transactional relationship Rate of flow of spatial
information
InDegree
Centrality
Authority‐power
relationships
[image:18.454.64.388.262.353.2]Role of organization
Table 3. Measures, relationship and variables used for social network analysis
The organizations were differentiated by different node shapes and node position,
node size and line width was used to show the interaction between organizations in
the network analysis. The results from social network analysis of KIN project is
described in section 4.2
4.
Results
4.1 Characteristics and Business Process Analysis of the Spatial Information
Sharing in the KIN Project
Prior to the KIN project, the NRM data hub scoping project was conducted for
Queensland’s NRM science panel to identify the characteristics of data sharing
between regional NRM bodies and state government organizations (Jones and
Norman, 2008). These characteristics were also confirmed during the interview
process. It was confirmed that the key characteristics of spatial information sharing
Spatially Enabling Government, Industry and Citizens
91
Current data sharing is not an organizational priority: In the current NRM
business environment, it was not in the interest of individual organizations to
share data and information, even though it was in the collective interest.
Sharing led by dedicated sections: Data sharing was mostly led by organizations
with dedicated sections funded and resourced to share information.
Lack of metadata: People do not know what information and data exists including
within their own organization. Significant amounts of unpublished or
uncatalogued spatial data exist with regional NRM bodies.
Willing to share but lack of trust: People were willing to share data/information
when asked, but didn’t promote the fact that they have information available.
They fear that if they put landholder’s information in the public domain that it
might be misused.
Data sharing through personal contact: Where sharing occurred it was done on a
person‐to‐person and immediate need basis. Much sharing was conducted via
personal contacts rather than organizational processes.
Institutional issues are more complex than technical ones: Many IT solutions
have been developed to solve data sharing problems; however, most have not
demonstrated long‐term success or realized their potential. These normally
require or assume that people will willingly format and package data sets for
sharing with others, and then maintain those data or information sets in a suitable
format.
No incentive for sharing: The cost of data sharing is being rationally avoided by
publishers of information.
Data sharing benefits are known: The benefits of data sharing and its reduction of
costs are desired by all NRM organizations.
The spatial information sharing characteristics demonstrated that the main concerns
were related to the institutional and cultural areas of data sharing and not the
technical areas such as the actual data hub portal. The study identified the importance
of improving the institutional and cultural part of the data sharing mechanism. The KIN
project was initiated to improve access and sharing of NRM information between
regional NRM bodies and DERM. A single licensing agreement was made between RGC
and DERM which covered the interest of all 14 regional NRM bodies. A framework was
endorsed by RGC and the project is in the implementation phase. Six main actors and
nine use‐cases were identified for spatial information sharing process and spatially
Spatially Enablement of NRM Communities through Spatial Knowledge and Information Network
Development
92
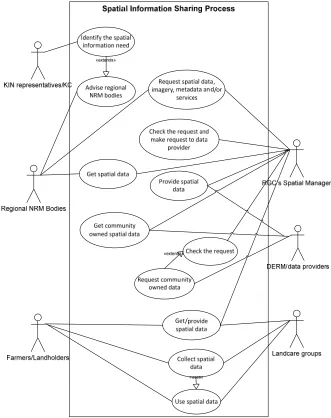
case process. As shown in Figure 3, six actors are interacting with nine use‐cases in a
[image:20.454.68.399.116.534.2]system whose system boundary is defined by the ‘Spatial Information Sharing Process’.
Figure 3. Use‐case diagram of spatial information sharing process
Spatially Enabling Government, Industry and Citizens
93
KIN representative/knowledge coordinators: The KIN representative or
knowledge coordinators (KC) identify the spatial information needs for
catchment management and advise regional NRM bodies to make requests
for the particular spatial information.
Regional NRM Bodies: Regional NRM Bodies request spatial information,
imagery, metadata and/or any spatial information services to RGC’s spatial
manager.
Spatial Manager (RGC): RGC’s spatial manager checks the request from
regional NRM bodies and makes requests to a spatial information provider.
They know how and who to approach to access and obtain spatial
information.
DERM/Spatial Information Provider: DERM provides spatial information to
the RGC’s spatial manager. If DERM or other government agencies need
community owned spatial data, they request the data through RGC’s spatial
manager.
Farmers/Landholders: Farmers/landholders receive spatial information
through RGC’s spatial manager. They also collect large scale spatial
information and provide this to regional NRM bodies through RGC’s spatial
manager. RGC’s spatial manager checks the request and facilitates the access
of community owned spatial information to government agencies and other
external bodies.
Landcare groups: Landcare groups also receive spatial information through
RGC’s spatial manager from spatial information providers. They also collect
large scale spatial information and make this data available to regional NRM
bodies through the RGC’s spatial manager. The RGC spatial manager makes
this community owned spatial information available to government agencies
and other external bodies.
4.2 Results from Social Network Analysis of KIN Project
4.2.1 Frequency of interaction
The frequency of interaction was used to measure communication relationship
between catchment communities and state government organization. The value of
Spatially Enablement of NRM Communities through Spatial Knowledge and Information Network
Development
[image:22.454.76.381.82.262.2]94
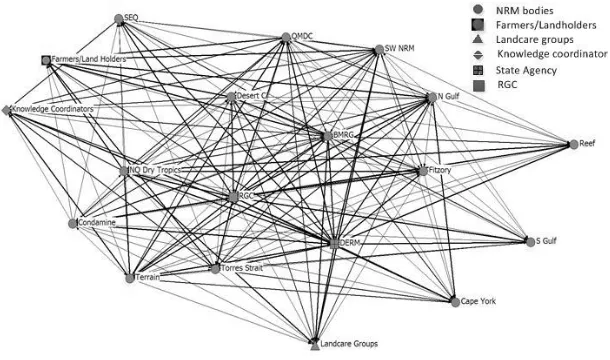
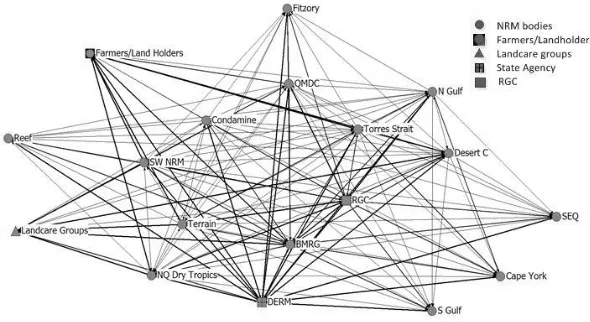
Figure 4. Frequency of interaction
Figure 4 shows the frequency of interaction between regional NRM bodies and
other organizations. Six types of organizations were directly or indirectly
contributing to the KIN project. The different shape node represents the
organization type. The thickness of lines and node size depict the frequency of
communication. The network position shows the importance of each organization
with respect to the communication.
It was observed that regional NRM bodies had the most frequent interactions with
farmers/land holders and landcare groups though these groups were not directly
involved in the KIN project. Regional NRM bodies also had frequent
communication with knowledge co‐ordinators, RGC, and DERM. RGC appeared at
the centre of the network with a high InDegree centrality value in communication
and could be viewed as a good mediator in the process of spatial information
sharing. There was little communication between DERM and landcare
groups/farmers. The communication between regional NRM bodies also varied.
There were greater levels of communication among adjacent regional NRM bodies
compared to geographically distant bodies. However, it was found that if groups
had common environmental concerns (common interest) and good professional
relationships they had more communication. Further, the regional NRM groups
had more communication with external organizations (DERM, landcare groups,
etc.) in comparison to internal regional NRM bodies). RGC and DERM both appear
at the centre of the network which shows their importance to maintaining
Spatially Enabling Government, Industry and Citizens
95
4.2.2 Flow of spatial information
The value of InDegree centrality was used to measure the flow of spatial information
between organizations. The amount of flow of spatial information was used as a unit
to measure transactional relationships between organizations.
[image:23.454.87.382.164.325.2]
Figure 5. Flow of spatial information
Figure 5 shows the amount of flow of spatial information and spatial information
exchange between regional NRM bodies and other organizations. There are five
different categories of organizations involved in spatial information sharing and the
organizations are differentiated by different node shapes. As discussed earlier, there
were both spatial information providers and users in the network and they had varying
capacities for spatial information collection and management. NRM bodies provide
spatial information to community groups such as Landcare groups and farmers/land
holders. The community owned spatial information is also provided to government
(namely DERM). RGC is at the centre of the network so again it could be perceived that
RGC is a key mediator and facilitator of the spatial information sharing process.
Further, it was found the amount of flow of spatial information with adjacent regional
NRM bodies is higher than those that are more distant.
4.2.3 Role of organizations in achieving the KIN goal
The value of InDegree centrality was used to measure the role of organization in
achieving the KIN goal. Participants were asked to rate the importance of the role of
Spatially Enablement of NRM Communities through Spatial Knowledge and Information Network
Development
[image:24.454.95.377.97.249.2]96
Figure 6. Role of organization in achieving the KIN goal
Figure 6 shows the role of organizations in achieving the KIN goal. The importance of
the role is demonstrated by the size of the node. Three organizations are identified as
having important roles in achieving the KIN goal. As RGC is at the centre of the
network, it has the greatest role. Knowledge coordinators also have a very important
role. The role of regional NRM bodies vary, however, RGC could be seen as having a
coordination role in bringing all the regional NRM bodies together. This is a statewide
project and DERM has provided the funding, so it has also an important role in the
network. This network analysis demonstrated that intermediary organizations and
professionals have very important roles in achieving the KIN’s goal.
5.
Discussion
Although technical solutions (spatial information portals) for spatial information access
and sharing between regional NRM bodies and government agencies exist, the
government led knowledge information network requires further development in
order to be effective for catchment communities. The traditional concept of SDI has
been conceived with government organizations as the primary custodians of spatial
information. In this model, the catchment decisions rely on public sector data and
regional NRM bodies are just the users of spatial information. Now, this concept has
changed and the regional NRM bodies are also becoming spatially enabled and
collecting a significant amount of large‐scale spatial information which has social and
environmental value. A recent national survey with 56 regional NRM bodies
demonstrated that about 80% of regional NRM bodies were both spatial data
providers and users. In Queensland, 13 out of 14 organizations identified themselves
as both spatial information providers and users. This work also identified the main
Spatially Enabling Government, Industry and Citizens
97
the community organizations such as Landcare groups and landholders/farmers.
Spatial technology and products like Google Earth, hand‐held navigation systems, web
2.0 technologies, and social media are not only spatially enabling regional NRM bodies,
but also empowering grass‐root level communities and citizens.
Budhathoki et al. (2008) argue that it is increasingly difficult to differentiate data
‘producers’ and ‘users’ in an environment where many participants function in both
capacities. The so‐called users are now becoming more important and powerful for
spatial data infrastructure design and development. The spatial information sharing
between government agencies and natural resource management bodies is now also
reflecting this trend. The significant amounts of unpublished or uncatalogued spatial
data that exist with regional NRM bodies could be more effectively utilized as a
resource for the sector. Additionally, the study found that regional NRM bodies are not
willing to publicize their spatial information because they do not believe that it is a
current organizational priority and will attract additional time and effort. However,
most of the interviewees indicated that they were willing to share spatial information
if they were asked. However, they were suspicious of government agencies and
thought that their data may be misused.
Mostly, the sharing of spatial information occurs through a data sharing agreement or
ad hoc process (informally) rather than organizational process. Some form of
collaboration with respect to spatial information and knowledge sharing was desired
by regional NRM bodies as a form of knowledge and information transfer. As with
many similar organizational arrangements, the data sharing culture is not well
practised among regional NRM bodies. The single licensed agreement between RGC
and DERM was a useful process to facilitate the spatial information sharing. Although
the RGC is a quite young organization, it has gained the trust of government
organizations and community groups. It has also achieved a good level of co‐ordination
and promoted spatial knowledge and information sharing across the various
catchments.
The social network analysis proved to be a useful tool to measure transactional
relationships, communication relationships and authority‐power relationships
between project partners. Regional NRM bodies had their most frequent
communication with farmers/land holders and land care groups, although these
groups were not a formal part of KIN project. Regional NRM bodies also had frequent
communication through knowledge coordinators, RGC, and DERM. With respect to
spatial information exchange, the analysis indicated that RGC played an important
role. There was also a positive two‐way flow of spatial information between regional
NRM bodies and the state government organizations. The analysis also highlighted the
fact that NRM bodies generally work within their defined catchment boundaries so
there was little need for sharing spatial information with other NRM bodies.
SDI practitioners (Budhathoki et al., 2008; Elwood, 2008b; Goodchild, 2007) have
recognized the power of user and grass‐root citizens for the next generation of spatial
Spatially Enablement of NRM Communities through Spatial Knowledge and Information Network
Development
98
how these citizens and grass‐root groups may also be generating spatial data that is
useful to government officials. This research identified the role of regional NRM bodies
and grass‐root level community groups for spatially enablement through spatial
knowledge and information sharing. Social network analysis and business process
analysis demonstrated and qualified the spatial information sharing processes and
relationship between stakeholders. It was also evident that there was an increasing
utilization of web 2.0 technology and open source models for catchment SDI
development activities. Volunteered contributions of spatial information prompted by
environmental concerns will continue to grow.
6.
Conclusions
This chapter has contributed to the current body of knowledge by exploring the social
science theoretical framework for the next generation of SDI development particularly
the network perspective of SDI. The two theories, namely, the actor network theory
and social network theory were found useful in understanding or describing the spatial
enablement of community and society. The case study on the spatial knowledge and
information network project provided some insights into the spatial information
sharing arrangements between catchment communities and the state government
organization. The business process analysis of spatial information sharing revealed the
role of some intermediary organizations/professionals such as the RGC and knowledge
coordinators can assist or facilitate community spatial enablement and spatial
information sharing.
The social network analysis was found to provide some useful measures to understand
and visualize the various relationships including the communication relationship
(frequency of interaction), transactional relationship (spatial information exchange),
and authority‐power relationships (role of organization) in collaboration and
networking. It was clear there is growing utilization of open models and social media
for spatial information management and knowledge sharing at the community level.
Spatial knowledge sharing is also emerging as an important process for achieving
better catchment outcomes and SDI will be a critical underlying infrastructure. There is
no doubt that spatial knowledge and information network development can
contribute towards spatially enablement of catchment communities. The findings from
this study suggest that the network perspective of SDI is useful to understanding the
spatial information management issues for NRM bodies and to achieve the broader
goal of spatially enabled society (SES).
References
Bodin, O., Crona, B., and Ernstson, H., (2006), WHAT you know is WHO you know?
Spatially Enabling Government, Industry and Citizens
99
Brass, D.J. (1992), Power in Organization: A Social Network Perspective" in G Moore
and JA Whitt (Eds) Research in Politics and Society, JAI Press, Greenwich, 295‐323.
Budhathoki, N., Bruce B., and Nedovic‐Budic, Z., (2008), Reconceptualizing the role of
the user of spatial data infrastructure, GeoJournal 72(3): 149‐60.
Callon, M., (1986), Some Elements of a Sociology of Translation: Domestication of the
Scallops and the Fishermen of St. Brieuc Bay, in J Law (Ed) In Power, Action,
and Belief: A New Sociology of Knowledge?, London, Routledge & Kegan Paul.
Coleman, D.,( 2010), Volunteered geographic information in spatial data
infrastructure: An early look at opportunities and constraints, in A Rajabifard,
J Crompvoets, M Kanantari and B Kok (Eds) Spatially Enabling Society:
Research, Emerging Trends and Critical Assessment, Leuven University Press,
Leuven, Belgium, Leuven.
Crompvoets, J., De Man, W.H.E. and Macharis, C., (2010), Value of Spatial Data:
Networked Performance beyond Economic Rhetoric. International Journal of
Spatial Data Infrastructures Research 5(96‐119).
De Man, W.H.E., (2006),Understanding SDI : complexity and institutionalization.
International journal of geographical information science (IJGIS) 20 (3): 329‐
43.
Elwood, S., (2008a), Grassroots groups as stakeholders in spatial data infrastructures:
challenges and opportunities for local data development and sharing.
International Journal of Geographical Information Science 22(1): 71‐90.
Elwood, S., (2008b), Volunteered geographic information: key questions, concepts and
methods to guide emerging research and practice, GeoJournal 72(3): 133‐5.
Freeman, L.C., (1979), Centrality in social networks. Conceptual clarifications, Social
Networks 1(3): 215‐39.
Goodchild, M.F. (2007), Citizens as voluntary sensors: Spatial data infrastructures in
the world of Web 2.0, International Journal of Spatial Data Infrastructure
Research 2(24–32).
Goodchild, M.F. (2008), Commentary: whither VGI? GeoJournal 72(239–44).
Grus, L., J. Crompvoets and A. Bregt. 2007. Multi‐view SDI Assessment Framework.
International Journal of SDI Research 2(33‐53).
Hanneman, R.A. and Riddle, M. (2005), Introduction to social network methods.
Spatially Enablement of NRM Communities through Spatial Knowledge and Information Network
Development
100
Harvey, F., (2000),The social construction of geographic information systems.
International Journal of GIS 14(8): 711‐3.
Harvey, F.,( 2001), Constructing GIS: Actor Networks of Collaboration. 4 October 2011,
<http://www.urisa.org/files/HarveyVol13no1‐3.pdf>.
Jones, A. and Norman, P. (2008), NRM Data Hub Scoping Project, Queenslands NRM
Science Panel, Queensland.
Kadushin, C. (2004), Chapter 2: Some basic network concepts and propositions,
Introduction to social network theory.
Keast, R. and Brown, K. ,(2005),The network approach to evaluation: Uncovering
patterns, possibilities and pitfalls South Bank, Brisbane, 10‐12 October 2005.
Knoke, D. and Kuklinski, J.H., (1982), Network Analysis. Sage Publications, Inc.
Kuhn, W., (2007), Volunteered Geographic Information and GIScience, Proceedings of
Position Paper for the NCGIA and Vespucci Workshop on Volunteered
Geographic Information, Santa Barbara, CA, December 13‐14, 2007.
Latour, B., (1987), Science in Action: How to Follow Scientists and Engineers through
Society. Harvard University Press, Cambridge, MA.
Law, J., (1992), Notes on the Theory of Actor‐Network: Ordering, Strategy and
Heterogeneity. Systems Practice 5:379–93.
Masser, I.,( 2011), Emerging Frameworks in the Information Age: The Spatial Data
Infrastructure Phenomenon, in TL Nyerges, H Couclelis and R McMaster (Eds)
The SAGE handbook of GIS and society, SAGE, London.
McDougall, K.,( 2010), From Silos to Networks – Will Users Drive Spatial Data
Infrastructures in the Future?, Proceedings of FIG Congress 2010: Facing the
Challenges – Building the Capacity, Sydney, Australia, 11‐16 April 2010
Omran, E.E., (2007), Spatial Data Sharing: From Theory to Practice. Wageningen
University.
Omran, E.E. and van Etten J.,( 2007), Spatial Data Sharing: Applying social network
analysis to study individual and collective behaviour. International Journal of
Geographical Information Science 21(6): 699‐714.
Onsrud, H.,( 2011), Afterword in N‐B Zorica, J Crompvoets and Y Georgiadou (Eds)
Spatial Data Infrastructure in Context: North and South, Taylor & Francis, CRC
Spatially Enabling Government, Industry and Citizens
101
Paudyal, D.R., McDougall, K. and Apan, A. (2009), Building SDI Bridges for Catchment
Management, in B van Loenen, JWJ Besemer and JA Zevenbergen (Eds) Spatial
Data Infrastructure Convergence: Research, Emerging Trends, and Critical
Assessment, Netherland Geodetic Commission (NGC), Delft, The Netherlands,
265‐79.
Radwan, M.M., Onchaga, R. and Morales, J., (2001), A Structural Approach to the
Management and Optimization of Geoinformation Processes, European
Organization for Experimental Photogrammetric Research (OEEPE).
Rajabifard, A., Feeney M.‐E.F. and Williamson, I., (2003), Spatial Data Infrastructures:
Concept, Nature and SDI Hierarchy, in I Williamson, A Rajabifard and M‐EF
Feeney (Eds) Developing Spatial Data Infrastructures: From Concept to
Reality, Taylor & Francis, London, UK. 17‐40.
Rajabifard, A., Crompvoets, J., Kalantari, M. and Kok B., (2010), Spatially Enabled
Societies in A Rajabifard, J Crompvoets, M Kalantari and B Kok (Eds) Spatially
Enabling Society Research, Emerging Trends and Critical Assessment, GSDI
Association and Leuven University Press, Belgium, Leuven.
Reeve, D.E. and Petch, J.R.,(1999), GIS organizations and people: a socio‐technical
approach. Taylor and Francis, London,
Rodriguez‐Pabon, O., (2005), Cadre theoretique pourl’evaluation des infrastructures
d’information geospatiale Canada. Laval University.
Ryttersgaard, J.,( 2001), Spatial Data Infrastructure‐Developing Trends and Challenges,
Proceedings of CODI‐2, Addis Ababa, 4–7 September
Scott, J., (2000), Social Network Analysis: A handbook. Sage, London.
Shi, Y., (2008), Virtual organization based distributed environmetal decision support
systems: Applications in watershed management. Michigan State University.
van Oort, P., Hazeu, G., Kramer, H., Bregt A., and Rip, F., (2010), Social networks in
spatial data infrastructures. GeoJournal 75(1): 105‐18.
Vancauwenberghe, G., Crompvoets, J., Bouckaert, G. and Vandenbroucke , D.,( 2009),
A network perspective on Spatial Data Infrastructures: SDI as support to e‐
government", Proceedings of GSDI11, Rotterdam, The Netherlands
Vancauwenberghe, G., Crompvoets, J., Bouckaert G., and Vandenbroucke D., (2011),
Social Network Analysis of the SDI in Flanders in Z Nedovic‐Budic, J
Crompvoets and Y Georgiadou (Eds) Spatial Data Infrastructures in Context:
North and South CRC Press, Taylor and Francis Group, Boca Raton, London,
Spatially Enablement of NRM Communities through Spatial Knowledge and Information Network
Development
102
Vandenbroucke, D., Crompvoets, J. , Vancauwenberghe, G., Dessers, E. and Van
Orshoven, J., (2009), A Network Perspective on Spatial Data Infrastructures:
Application to the Sub‐national SDI of Flanders (Belgium). Transactions in GIS
13(105‐22).
Wasserman, S. and Faust, K., (1994), Social Network Analysis: Methods and
Applications Cambridge University Press, Cambridge, England.
Wasserman, S. and Faust, K., (2008), Social Network Analysis: Methods and
Applications Cambridge University Press, Cambridge, England.
Wehn de Montalvo, U., (2003), Mapping the determinants of spatial data sharing.
Ashgate Publishing Ltd, Aldershot, England.
Williamson, I., Holland, P. and Rajabifard, A., (2010), Spatially Enabled Society,
Proceedings of FIG Congress 2010, Facing the Challenges ‐ Building the
Capacity, Sydney, Australia, 11‐16 April 2010
Williamson, I.P., Rajabifard, A. and Feeney, M.‐E.F., (2003), Developing spatial data