Using linkography to compare creative
methods for group ideation
G. Hatcher, W. IonandR. Maclachlan, Design Manufacture and Engineering Management, University of Strathclyde, G1 1XJ Glasgow, UK
M. Marlow, English, University of Strathclyde, Glasgow, UK
B. Simpson, Strategy and Organisation, University of Strathclyde, Glasgow, UK
N. WilsonandA. Wodehouse, Design Manufacture and Engineering Management, University of Strathclyde, G1 1XJ Glasgow, UK
This paper compares a new creative design method, based on the principles of drama improvisation, with brainstorming. The evolution and development of the Design Improv method is reviewed, and the results of an evaluation of both methods in controlled team ideation sessions are documented. The creative characteristics relevant to their quantitative and visual interpretation are analysed using linkography, identifying the most prominent variations in performance with respect to inter-connectedness, parallel thinking and idea diversity. We describe an adapted and expanded process for robust linkograph development and reflect on the value, challenges and limitations of both the linkograph creation and the perceptive insights they can provide.
Ó2018 The Author(s). Published by Elsevier Ltd. This is an open access article under the CC BY license (http://creativecommons.org/licenses/by/4.0/).
Keywords: collaborative design, conceptual design, creativity, design methods, linkography
D
esign ideation research is continually evolving. A number of studies have fuelled debate over the influences of different factors and inter-ventions such as individual or group work; working environment; creative stimuli; and different processes for generating and recording ideas, for example (Faure, 2004; Howard, Culley, & Dekoninck, 2011; Knight & Baer, 2014; McMahon, Ruggeri, K€ammer, & Katsikopoulos, 2016; Vidal, Mulet, & Gomez-Senent, 2004). Studies often involve a comparison of two or more ideation methods, with measurements of their creative outputs as the key discussion points. Some use a simple quantity and/or originality mea-surement as an evaluation while others use more detailed creativity metrics such as those outlined byShah, Smith, and Vargas-Hernandez (2003).However, measuring creative output does not provide the full story. For example, some have argued that while studies show group ideation to be less productive than individual, there are additional benefits that should not be dismissed such as improved organisational memory, building and pooling
Corresponding author: R. Maclachlan
r.maclachlan@strath. ac.uk
www.elsevier.com/locate/destud
of designer knowledge and skills; and creating an attitude of support (Kohn, Paulus, & Choi, 2011; McMahon et al., 2016; Sutton & Hargadon, 1996). Furthermore, the outputs of ideation approaches intended for use in the early phase of the design process may not contain the level of embodiment and detail required to adequately utilise more in-depth creativity metrics. These require quantitative inputs and weightings of multiple functional attributes, which is simply not possible for the brief and discrete (yet potentially significant) ideas typically expressed during an early phase group ideation.
This phase therefore requires other ways to determine whether a particular ideation method is fostering creativity. By looking at the ideation process it-self, we can gain insights into the style and quality of creative thinking, and in the case of group ideation, the style and quality of collaboration.
‘Linkography’ has become an established method for visualising and analysing design processes (Roozenburg, 2016). Originally developed by Gabriela Gold-schmidt to evaluate the creative processes of individual designers (Goldschmidt, 1995). Further developments such as those byvan der Lugt (2000) have enabled linkography to be effectively applied to the evaluation of group ideation in a product design and design engineering context through links that emerge as ideas are developed. While several accounts of this method exist in the literature, published accounts do not usually share the level of detail that would enable others to replicate the full link coding process effi-ciently and effectively.
Using data from a recent study on the application of improvisation techniques, developed for drama and comedy performance, to design ideation (Hatcher et al., 2018) this paper demonstrates the use of linkography to trace the devel-opment of ideas in a group ideation process, while also revealing the analytical power of this method when used to compare two alternative ideation methods. The new Design Improv method draws on the referents (rules) of improvised comedy aiming for collaborative divergence to overcome barriers that often prevent the full potential of group idea generation being realised. We present a detailed account and provide guidance on our adapted and expanded process for producing a robust set of linkographs for both methods, and discuss the various new and refined insights they provide when analysed both numerically and visually. These highlight the key differences between the ideation methods. We then reflect on the value, challenges and limitations of both the linkogra-phy creation process and its perceptive insights.
1
Design Improv: its evolution and characteristics
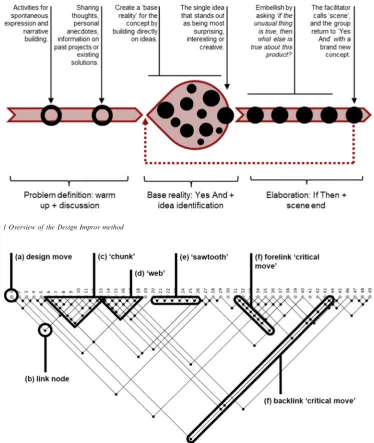
warm-up and brief discussion of the design challenge, teams build up a ‘base reality’ for a concept using the ‘Yes And’ technique e where the premise offered by others is accepted and built upon to create a shared narrative. A sin-gle idea that stands out as being most surprising or unusual is then heightened using the ‘If Then’ technique to embellish it further, allowing that single idea to be pushed to its limits (seeFigure 1).
2
Linkography
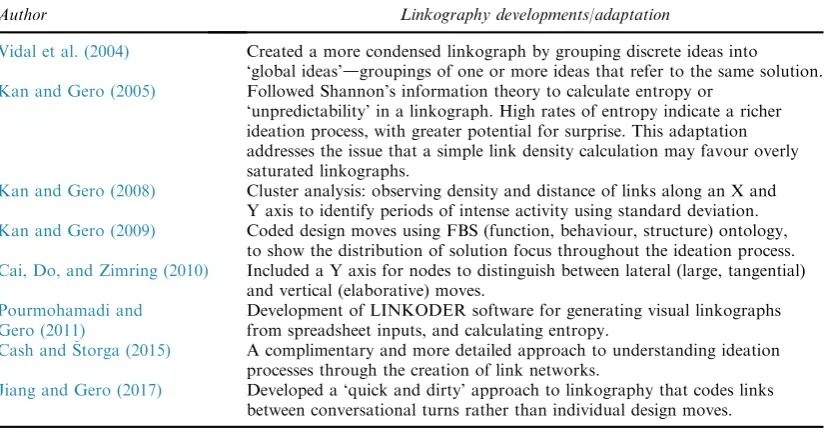
Linkography is a protocol analysis method developed byGoldschmidt (1990) that codes and visualises the links between the ‘design moves’ expressed during an ideation session. A linkograph has several common features, as shown in the annotated example in Figure 2. Firstly, each design move (a) identified in the data is numbered in sequential order along the horizontal axis (1e49 inFigure 2).Goldschmidt (2014)describes a design move as ‘a step, an act or an operation in the process that changes the situation’.van der Lugt (2000) goes further by stating that a design move‘requires communication with an indi-cation that the idea was transmitted to and received by the group’and‘must be related to the task at hand and providing some kind of solution’.‘Nodes’ (b) denote a link between two design moves assessed through a process of judging whether each move is linked to any other move that precedes it (Goldschmidt, 1995). For instance, the highlighted link node inFigure 2represents a link be-tween design moves 1 and 10. Goldschmidt’s approach to link-coding relies on ‘common sense’, and clarifies that‘a link between two moves is established when the two moves pertain to the same, or closely related, subject matter(s), such as a particular component of the designed entity, its properties and functions, a concept or a design strategy’ (Goldschmidt & Weil, 1998).The density of these nodes alone can provide insights into the inter-connectivity of the ideation process. Too sparse, and the process could be considered sporadic and poorly structured. Conversely, a very dense linkograph may imply design fixation ( El-Khouly & Penn, 2014).
‘Critical moves’ (f) are design moves with a high number of backlinks (links to preceding moves) or forelinks (links to subsequent moves). A high number of backlinks means the design move drew upon and/or consolidated lots of pre-vious moves, while a high number of forelinks indicates that the move inspired lots of future design moves, and was therefore instrumental in the progression of the ideation session. A linkograph with a high proportion of backlink crit-ical moves suggests a gathering together of ideas as convergent thinking,
Figure 1 Overview of the Design Improv method
whereas forelink critical moves suggest the generative spinning out of diver-gent thinking (Goldschmidt, 2014).
2
.1 Adaptations and applications of linkography
As linkography gains recognition and popularity, it is increasingly being used in a variety of research contexts, from cybersecurity (Mitchell, Fisher, Watson, & Jarocki, 2017) to the evaluation of comics and animation (H.-W. Chou, Chen, & Chou, 2014; S.-B. Chou, Chou, & Chen, 2013). It was initially devel-oped for analysing the cognitive creative processes of individual designers, and there are several examples in the literature of this being put into practice, for example (El-Khouly & Penn, 2014; Kan & Gero, 2008; Salman, 2014). Link-ography has also been used more extensively in the study of design engineering teams and processes.van der Lugt (2002)used the aforementioned adapted approach to compare two different ideation methods: ‘brainsketching’ and brainstorming. By analysing the link density and link types, it was observed that while brainstorming resulted in a higher quantity of ideas, brainsketching led to more connections between ideas and more incremental ideas-building. From this it could be concluded that brainsketching had certain advantages over brainstorming, an observation that would not have been made by assess-ing quantity of ideas alone.Vidal et al. (2004)adopted a similar approach in a comparison of brainstorming through verbal communication, sketching and quick prototyping. However, they condensed the protocol further by only cod-ing the links between ‘global ideas’. This of course is only possible if all the ideas within a global idea are expressed sequentially. By analysing linkographs they were able to reveal that although verbal ideation produced the highest quantity of ideas, quick prototyping showed greatest inter-connectivity.Lee (2014)used both link density and entropy to determine the rate of creative collaboration between multi-disciplinary design groups. The study found that teamwork was enhanced by shared terminologies, a diverse range of expe-rience and strong leadership. Furthermore, linkographs have been used to identify frequent shifts of divergent (equated to forelinking of moves) and convergent thinking (equated to backlinking of moves) through the ideation process (Goldschmidt, 2016), suggesting this characteristic should be consid-ered as a measure or indicator in analysis of creative thinking.
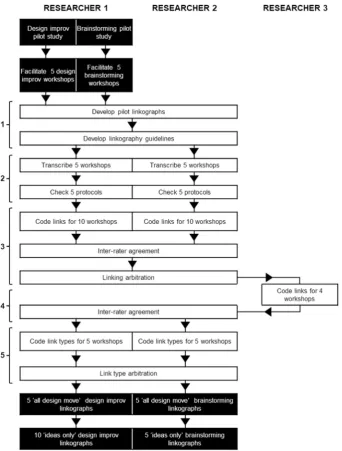
To gain additional insights and to meet specific project needs, further adapta-tions and analysis techniques have been added in recent years to the linkogra-phy literature. Some key examples are summarized inTable 1.
2
.2 Use in our context
Investigating the links between ideas only, because according to van der Lugt, in early divergent phase it is difficult to assess the‘relative state of the design situation’, and therefore identify other design moves.
Improved guidelines for determining the presence of a link between two ideas, including verbalizations, looking actions and gestures.
A method for coding the type of links present: supplementary, modify and tangential.
This approach has been adopted for analysis of the Design Improv method, with further adaptations made as outlined below.
3
Method: benchmarking against brainstorming
[image:6.544.70.484.72.288.2]Brainstorming represents the dominant method paradigm for group ideation. It is the most explicitly used ideation method in industry (Geschka, 1996), the most studied group creativity technique (Williams, Runco, & Berlow, 2016) and is a generic descriptor for group idea generation. The original rules continue to be promoted as the base technique; 1. Aim for quantity, 2. Avoid criticism, 3. Build on ideas, and 4. Wild ideas are welcome (van Boeijen, Daalhuizen, Zijlstra, & van der Schoor, 2014). Studies of the fundamental technique have given rise to the development of descriptive socio cognitive models (Glaveanu, 2011) which explain that group activities can extend con-centration on idea generation beyond the period of time typically spent by an individual. However, this potential benefit is often not evidenced as ex-pected with an increased quantity of ideas. Participants’ fear of judgement, un-equal contribution, premature rejection of ideas, idea fixation and production Table 1 Linkography developments presented in the literature
Author Linkography developments/adaptation
Vidal et al. (2004) Created a more condensed linkograph by grouping discrete ideas into ‘global ideas’dgroupings of one or more ideas that refer to the same solution. Kan and Gero (2005) Followed Shannon’s information theory to calculate entropy or
‘unpredictability’ in a linkograph. High rates of entropy indicate a richer ideation process, with greater potential for surprise. This adaptation addresses the issue that a simple link density calculation may favour overly saturated linkographs.
Kan and Gero (2008) Cluster analysis: observing density and distance of links along an X and Y axis to identify periods of intense activity using standard deviation. Kan and Gero (2009) Coded design moves using FBS (function, behaviour, structure) ontology,
to show the distribution of solution focus throughout the ideation process. Cai, Do, and Zimring (2010) Included a Y axis for nodes to distinguish between lateral (large, tangential)
and vertical (elaborative) moves. Pourmohamadi and
Gero (2011)
Development of LINKODER software for generating visual linkographs from spreadsheet inputs, and calculating entropy.
Cash andStorga (2015) A complimentary and more detailed approach to understanding ideation processes through the creation of link networks.
blocking appear to induce terminal velocity for the method and group work. The enduring nature of brainstorming along with the sense that the true poten-tial of group creativity has yet to be realised, means that it is the natural choice of comparative datum for a new ideation method.
The development of Design Improv was initiated through proposals that improvisation approaches from performance art forms (theatre, comedy, mu-sic and dance) could be applied in ideation for heightened group cohesion and creativity. Theories of improv align with brainstorming where participants follow a ‘referent’ set of rules, but the referent emphasis is on reducing cogni-tive loading and facilitating shared mental models between participants to-wards a collaborative divergence (Magerko et al., 2009; Stevens & Leach, 2015).
To undertake benchmarking of the 2 methods, ten experimental workshops were conducted with groups of 3e5 participants, all of whom were either se-nior undergraduate or postgraduate design students with experience of work-ing in creative teams. Five groups used the Design Improv method developed as part of the research, while the other five used the brainstorming method, following the rules ‘aim for quantity, defer judgement, build on ideas; and wild ideas are welcome’. The workshops lasted approximately 1 h, and began with a short warm-up period. This incorporated of activities tailored towards the assigned design method (word-association improv activities or a short informal brainstorm), followed by a consistent introduction to the design chal-lenge by the facilitator. Design Improv groups would spend up to 5 min having an informal discussion about the challenge, as this is highlighted as a key aspect of preparation for effective improvisation. Each group was then required to use their assigned ideation method for 20 min to address a design challengedeffective delivery of packages by drone at the point of customer interaction. The groups were encouraged to consider drop-off mechanisms, er-gonomics, security and safety. Apart from the method differences, as many steps as possible were taken to ensure variables across the ten workshops re-mained consistent.
3
.1 Linkography production process
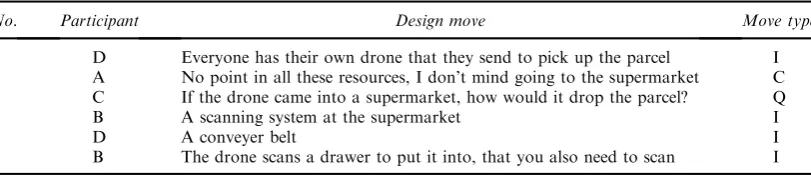
The experimental workshop was conducted by a researcher who had previ-ously developed the Design Improv method through exploratory and iterative workshops. The researcher also participated in coding the linkographs. Ac-cording to Goldschmidt, linkographs should be produced by at least three judges, and arbitrated by at least two (Goldschmidt, 2014). Therefore, a sec-ond researcher was recruited for the linkography process who was not previ-ously involved in the research; and a third researcher independently produced four linkographs from the same set of design moves following a period training.Figure 3illustrates the judging process.
3
.1.1 Develop guidelines through pilot study
The linkography approach detailed in this section was first completed using the two pilot study workshops. These enabled Researchers 1 and 2 to gain an understanding of the approach and to develop guidelines that would ensure consistency in the subsequent analysis. These guidelines were informed by pre-vious literature on the linkography process and updated based on common discrepancies noted during researcher comparison and discussion. The guide-lines informed the transcription of the workshops (i.e. determining what should be considered a ‘design move’), the coding of links between design moves and the coding of link types.
3
.1.2 Workshop transcription
Before the linkographs could be produced, the audio recordings of the work-shops had to be transcribed. As per the guidelines outlined byGoldschmidt (2014), these were not word-for-word transcriptions; rather each line of the protocol represented a design move. Researchers 1 and 2 each transcribed five sessions, which were then checked by the other researcher to improve ac-curacy and agreed through discussion where necessary. An excerpt of a link-ography transcript is shown inTable 2. In this study, design moves included all ideas but also included other contributions that moved (or had the potential to move) the ideation session forward. The decision to include these arose from an interest in whether such ‘supplementary’ design moves had any influ-ence on the creative process and outcomes. The original linkography tran-scripts included segments that were coded as one of the following types:
Idea (I): a new solution or partial solution relating to the design challenge, e.g.‘a windowsill delivery box’.No judgement was made on the quality of these ideas.
Specification (S): statements concerning design requirements or perceived requirements e.g. ‘the propellers shouldn’t cut people’s hands’.
Knowledge (K): when a participant shared knowledge that could inspire ideas or steer the ideation in a particular direction, for example information about existing solutions, or relevant personal experiences e.g. ‘I’ve seen similar services in supermarkets’.
[image:9.544.99.442.54.506.2]Comment (C): any other statements that contained new information that had the potential to inspire ideas e.g.‘that idea could also help people with mobility issues’.
Instances where the discussion did not move the ideation session forward were not included, for example basic repetition of ideas, statements of general agreement or facilitation-related discussion. Within the transcript, each design move was numbered sequentially and coded according to its type. Segments were also coded with the participant who contributed them, to enable contri-bution and collaboration to be analysed later in the process.
3
.1.3 Code nodes linking design moves
Researchers 1 and 2 both independently coded links for all 10 workshops, us-ing the guidelines that were developed from the pilot study data. These guide-lines were based upon those found in the linkography literature, with additions and elaborations based on the experience of coding and consolidating the pilot study linkographs. A link coding excerpt from one of the brainstorming work-shops is shown inTable 3.
Links were recorded when one or more of the following criteria were met:
Participants relate directly to earlier ideas when verbalising their own ideas (van der Lugt, 2000).E.g. 5 links to 4 as the discussion focuses on scanning barcodes.
There are visible indications such as hand gestures (van der Lugt, 2000). There are functional, behavioural or structural similarities (van der Lugt,
2000).E.g. 6 links to 2 as both discuss landing places at residential locations. Design moves occur sequentially and are within the same chain of thought, building an image of a single concept or solution.E.g. 4 links to 3 as the con-versation is focussed on how the drone will land and deposit the parcel. The same basic idea is applied in a different context.E.g. 11 links to 4 as one
refers to the drone using unique codes, the other refers to the user having a unique code.
[image:10.544.73.479.69.158.2]Nevertheless, the link coding process is subjective. To help improve consis-tency across the ten linkographs additional guidelines were produced during the pilot study phase to help determine whether two design moves should be coded as linked or not:
Table 2 Example transcript from workshop with design moves coded
No. Participant Design move Move type
1 D Everyone has their own drone that they send to pick up the parcel I 2 A No point in all these resources, I don’t mind going to the supermarket C 3 C If the drone came into a supermarket, how would it drop the parcel? Q 4 B A scanning system at the supermarket I
5 D A conveyer belt I
Repeated words alone do not necessarily mean there is a link.E.g. 15 and 1 do not link, despite the common word ‘notify’. 1 discusses notifications when the drone in on route to a specified delivery location, while 15 notifies the customer when the parcel is ready to be delivered so a destination can be set. Links between design moves that have a large number of intervening moves can be coded if the related idea has not occurred between these moves.E.g. if idea 70 discussed the use of landing plinths, it will be linked to idea 3, despite a large gap between the re-occurrence of the idea within the protocol. If idea 40 also discussed landing plinths, idea 70 would be linked to 40.
Where elements of an idea reoccurred multiple times within the transcript, segments were only linked back to the first time the idea was presented, un-less a new element was introduced in a subsequent move that would pro-duce a new link. E.g. if the use of codes to release parcels re-occurs later in the transcript, the later idea would be linked back to 4 rather than 11. The exception would be if QR scanners specifically were discussed, in this case the link would be to 11.
If there is uncertainty about non-sequential links being connected, put the design moves together without intervening moves.E.g. 9 links to 7 as it ad-dresses the issue raised of what happens when the drone arrives and no one is home. Both 9 and 7 link to each other if idea 8 is removed, therefore a link is present.
[image:11.544.67.476.69.246.2]Both researchers 1 and 2 followed these guidelines when independently coding links for each workshop, then their consistency was established by calculating the inter-rater agreement for each set of linkographs. A confusion matrix (van der Lugt, 2001) was used to record the ratio of agreement and disagree-mentdthe number of instances where both researchers agreed there was a link, where only one researcher found a link, and where neither researcher Table 3 Example transcript with links coded
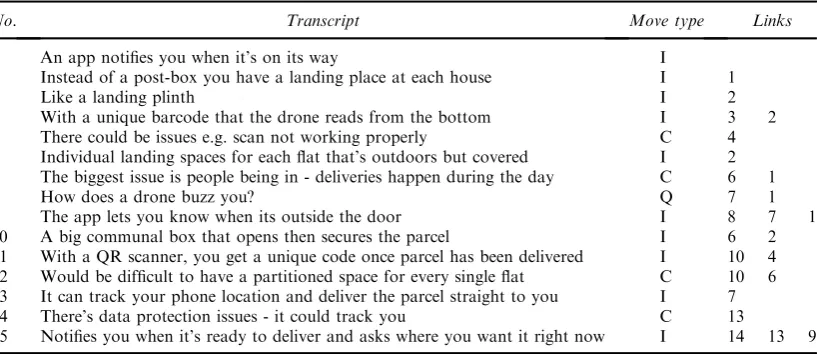
No. Transcript Move type Links
1 An app notifies you when it’s on its way I
2 Instead of a post-box you have a landing place at each house I 1
3 Like a landing plinth I 2
4 With a unique barcode that the drone reads from the bottom I 3 2 5 There could be issues e.g. scan not working properly C 4 6 Individual landing spaces for each flat that’s outdoors but covered I 2 7 The biggest issue is people being in - deliveries happen during the day C 6 1 8 How does a drone buzz you? Q 7 1 9 The app lets you know when its outside the door I 8 7 1 10 A big communal box that opens then secures the parcel I 6 2 11 With a QR scanner, you get a unique code once parcel has been delivered I 10 4 12 Would be difficult to have a partitioned space for every single flat C 10 6 13 It can track your phone location and deliver the parcel straight to you I 7 14 There’s data protection issues - it could track you C 13
found a link. Fleiss’ Kappa (Fleiss, Levin, & Paik, 2003) was then calculated. Inter-rater agreement was calculated as ‘high’ to ‘excellent’, ranging from 0.7 to 0.82. Where disagreements occurred, the final linkographs were determined through a discussion between the two researchers, where each explained their reasoning and came to a mutual decision.
3
.1.4 External judge
As recommended byGoldschmidt (2014), a third researcher joined the process to enhance confidence in the linkographs. Following a two-day training period, the third researcher coded links for four randomly selected workshops (two Design Improv, two brainstorming). Four was considered sufficient, given the limited time available, to establish whether the link coding could be considered consistent and reliable. As before, inter-rated agreement was calculated between Research 3 and Researcher 1 and 2’s consolidated linko-graph. The agreement for all four was rated as ‘fair’, between 0.4 and 0.54. A lower rate of agreement was expected as Researcher 3 had spent less time with both the project and the linkography method.
3
.1.5 Link type coding
It was of interest to categorise the types of design links to indicate the type of thinking taking place.van der Lugt (2000)suggests three categories where all design moves are ‘ideas’: supplementary, modification and tangential. van der Lugt states that ‘This division into link types is still somewhat ambiguous. As the three link types are segments of the same adaptor-innovator scale, there are bound to be difficulties at the borders of the types.’ (p. 74). Through the pilot studies these difficulties were experienced, but clear distinctions were noted be-tween links that might have been classified together as ‘modification’ and ‘sup-plementary’. ‘As the protocols in this study contained design moves other than ideas (a key differentiator between brainstorming and Design Improv), it was decided that additional categories were necessary to appropriately code all the link types. The link type coding used within this research is outlined in Figure 4. At this stage it was only necessary to code links associated with design moves classified as ideas; it was only of interest to understand the type of thinking that was taking place that led to the emergence of new solu-tions, and furthermore the link type categories did not lend themselves to the coding of the design moves that do not link to ideas.
4
Results
ideas-only linkographs enabled a more accurate reflection of ideas-building across each workshop.
Table 4illustrates the measurements that can be drawn from linkographs, and the mean results and standard deviations for the Design Improv and brain-storming workshops, which will be discussed in more detail throughout this section.
Coding the types of links between ideas creates a picture of the prominent thinking styles used by designers to generate new solutions. For example, a high level of tangential thinking signifies a process that is rich in novel combi-nations (van der Lugt, 2000). This may be desired in the early ideation stages, when novel, innovative solutions are required. In the later stages, when con-cepts are being developed, a high level of tangential thinking may indicate a lack of focus, while alternative and incremental thinking indicate progressive development towards a solution.
Each link associated with an idea was coded using the parallel, incremental, new, alternative and tangential (PINAT) guidelines outlined inTable 4. The index for each link type (LTI) is calculated by dividing the number of links of the selected type by the total number of design moves.
[image:13.544.86.456.55.224.2]There was not a significant difference (p>0.005) in the mean number of ideas produced by each method. Number of ideas is often a quick initial measure of the performance of an ideation session, but it would be misleading to propose that Design Improv, having the higher mean score, does create more ideas; it is not a significant result (p>0.05), the values are close between methods and there is a higher SD across the 5 improv sessions than for brainstorming
Table 4 Critical moves, link type and linking indexes across workshops
Method Design Improv M SD Brainstorming M SD p
Workshop 1b 4b 6b 7b 9b 2b 3b 5b 8b 10b
Team size (inc facilitator)
5 4 4 5 5 5 4 5 6 5
Creativity Divergence Forelinks
%CM4 12.33 9.68 10.20 9.68 11.11 10.6 1.13 1.85 8.70 7.14 5.80 5.08 5.71 2.29 0.008 %CM5 5.48 8.06 6.12 6.45 6.35 6.5 0.95 e 4.35 1.79 4.35 1.69 2.44 1.31 0.005
%CM6 4.11 8.06 4.08 4.84 6.35 5.5 1.71 e e e 1.45 e e e e
%CM7 2.74 3.23 4.08 1.61 3.17 3.0 0.90 e e e e e e e e
%CM8 1.37 1.61 4.08 1.61 1.59 2.1 1.14 e e e e e e e e
%CM9 1.37 1.61 2.04 1.61 e 1.3 0.28 e e e e e e e e
%CM10 e e e 1.61 e 0.3 0.72 e e e e e e e e
Convergence Backlinks
%CM4 1.37 0 0 1.61 1.59 0.9 0.84 0 0 0 1.45 0 0.3 e e
%CM5 0 0 0 0 0 e e 0 0 0 1.45 0 0.3 e e
Link types Parallel LI 0.02 0.00 0.00 0.00 0.01 0.01 0.01 0.07 0.07 0.05 0.09 0.01 0.06 0.03 0.014 Incremental LI 0.41 0.52 0.43 0.51 0.56 0.49 0.06 0.29 0.31 0.31 0.30 0.34 0.31 0.02 0.002 New LI 0.02 0.05 0.04 0.03 0.14 0.06 0.05 0.34 0.30 0.29 0.27 0.26 0.29 0.03 <0.000 Alternative LI 0.20 0.12 0.21 0.17 0.15 0.17 0.04 0.19 0.22 0.20 0.18 0.29 0.22 0.04 0.110 Tangential LI 0.36 0.31 0.32 0.29 0.14 0.28 0.08 0.11 0.10 0.16 0.16 0.18 0.14 0.03 0.018 Unpredictability Forelink Entropy 0.24 0.23 0.26 0.26 0.24 0.25 0.01 0.21 0.25 0.23 0.21 0.2 0.22 0.02 0.047 Backlink Entropy 0.31 0.29 0.34 0.32 0.27 0.31 0.02 0.22 0.34 0.26 0.2 0.25 0.25 0.05 0.101 Horizonlink
Entropy
0.09 0.11 0.11 0.11 0.11 0.11 0.01 0.07 0.15 0.09 0.08 0.08 0.09 0.03 0.457
Productivity Fluency Design moves 79 74 59 78 73 72.60 8.02 121 90 93 107 89 100.00 12.33 0.009 Ideas 73 62 49 62 63 61.80 8.53 54 46 56 69 59 56.80 7.47 0.376 % moves: ideas 92.41 83.78 83.05 79.49 86.30 85.00 4.80 44.62 51.11 60.22 64.49 66.29 57.30 8.25 0.001 Collaboration LDI (design moves) 1.53 1.57 1.49 1.56 1.55 1.54 0.03 1.39 1.71 1.72 1.49 1.26 1.51 0.18 0.783 LDI (ideas) 1.52 1.44 1.31 1.47 1.32 1.41 0.09 0.85 1.28 1.09 1.00 1.00 1.04 0.14 0.002 Self-link ‘norm’ 0.20 0.25 0.25 0.20 0.20 0.20 0.25 0.20 0.17 0.20
SLI (design moves) 0.14 0.16 0.16 0.16 0.23 0.17 0.03 0.30 0.24 0.28 0.22 0.35 0.28 0.05 0.005 SLI (ideas) 0.12 0.19 0.17 0.15 0.20 0.17 0.03 0.39 0.31 0.33 0.26 0.44 0.35 0.07 0.002
140
Design
Studies
Vol
58
No.
C
suggesting the higher value is unlikely a pattern. However, a significantly (p<0.005) higher proportion of the design moves in Design Improv work-shops were ideas.
Entropy calculations reflect the link pattern’s ‘unpredictability’, i.e. it’s ability to generate surprising outcomes (Kan & Gero, 2005). Forelink and backlink entropy, as well as horizonlink entropy (the lateral space between links) was calculated using the LINKODER software (Pourmohamadi & Gero, 2011). Although there were not great differences between the scores, Design Improv produced higher mean results on all three counts, with forelink entropy signif-icantly so (p<0.05).
We have identified four critical areas where there were differences: inter-connectedness, progressiveness, diversity and productivity. These are exam-ined in more detail with the use of linkography below.
5
Discussion
We have embodied the linkography method to form a comprehensive compar-ison between the creative processes of two group ideation methods. In the following sections we will reflect upon the process that was followed to pro-duce the linkographs, and the value (and limitations) of using linkography to analyse the creativity of design methods.
5
.1 Inter-connectedness: linkography structures
The link density index (LDI) indicates the interconnectedness between ideas, providing greater insight into the quality of Design Improv as a creative pro-cess. LDI is calculated by dividing the total number of links by the total num-ber of design moves (Goldschmidt, 2014). We calculated LDI for all design moves and for ideas only. When all design moves were considered, the two methods produced similar link densities, indicating similarly inter-connected creative processes. However, Design Improv produced a significantly (p < 0.005) higher mean LDI when only ideas were considered; non-idea moves are removed. This suggests that Design Improv resulted in a more inter-connected idea-building process. Standard deviation for LDI shows greater variation between brainstorming teams.
brainstorming chunk has a low link node count for its first move), indicating a less structured approach, despite similar link index results.
Self-linking is another means to interpret collaboration: it occurs when a participant builds upon their own design move rather than responding to the ideas of others. Self-links were recorded during the link coding phase, using the participant labelling of each design move to note whether a participant was building on their own idea. It was of most interest to record self-linking be-tween ideas only. The self-link index (SLI) is calculated by dividing the number of self-links by the total number of ideas (van der Lugt, 2000). Some self-linking is always expected in a group ideation session. For example, in a group of four, we may expect a SLI of around 0.25, while a group of five would expect a SLI of around 0.2. Higher self-linking indicates a more individual approach to problem solving, while lower SLIs indicate more collaborative ideation. In our study the mean SLI for Design Improv was significantly (p<0.005) lower than that of brainstorming.
[image:16.544.92.461.59.346.2]Observing the linkographs provides a more in-depth understanding of this phenomenon. Self-linking has been highlighted in the Design Improv
linkograph excerpt shown inFigure 6. Self-links often show instances where individuals have ‘championed’ their own ideas, often at the expense of input from less dominant participants. However, it should be noted that the linko-graphs also show areas where one participant contributed an idea that was then built on collectively by the whole group. In these cases, self-linking was in the context of group development, rather than the fixation of one group member on their own idea. This style of self-linking was most common in the Design Improv linkographs, again indicating a more collaborative approach.
5
.2 Progressiveness: critical moves
[image:17.544.101.441.485.614.2]It was found that Design Improv resulted in more tangential (p<0.05) and incremental (p<0.005) ideas. This can be related to the number of critical moves which were identified in the linkographs. Critical moves provide in-sights into the ideation process, with a higher number of critical moves showing a more productive and coherent process. The number and ratio of backlink critical moves to forelink critical moves can also provide insights into a method’s levels of divergent and convergent thinking. The criteria for what constitutes a critical move varies depending on the study, but should typically amount to no more than 10e12% of the total number of moves (Goldschmidt, 2014). Based on these guidelines, critical moves in our study were established as having at least four backlinks or forelinks. They were re-corded using ideas-only linkographs ensure an accurate reflection of the diver-gent or converdiver-gent ideation process. For example, in the ‘all moves’ linkographs multiple responses to a question appeared to denote a critical move. Table 4 starkly reveals that brainstorming sessions rarely contained moves with more than 5 forelink connections suggesting that ideas were less often developed by the brainstorming groups. In light of this, it is interesting to reflect on the influence of the explicit brainstorming rule that encourages ‘building on the ideas of others’.
While this information is useful in highlighting particularly significant issues, or turning points in the conversation, these ‘critical moves’ do not represent divergent or convergent idea-building. Design Improv on average created significantly more forelink critical moves (p<0.05), in addition to a greater number of links within those critical moves. Neither method produced signif-icant numbers of backlink critical moves, indicating that both are largely divergent ideation approaches; the ultimate aim of ideation is divergence and the results align with findings of van der Lugt (2000). Goldschmidt (2016)proposes that a creative design process should demonstrate a balance of forelinks and backlinks, the backlinks potentially signifying that ‘the designer reserves some attention to evaluative activity and affirm (or question) what has already been done.’ (p. 120). There then might be some concern about the absence of backlinks in sessions that aim for creativity. However, at least the sessions in our study are intended to reflect approaches suitable for early design process phases and are facilitated with method referents that aim to focus all attention on new idea generation.
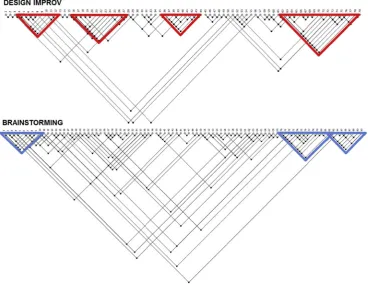
The linkograph provides a visual identification and further insights of critical moves (Figure 7). In the Design Improv example, it is clear that critical moves result in distinct ‘chunks’, indicative of a more productive ideation process. There is less structure visible within the brainstorming linkograph, as the fore-link critical moves do not generally result in obvious clustering of ideas.
5
.3 Diversity: link types
5
.4 Productivity: design moves
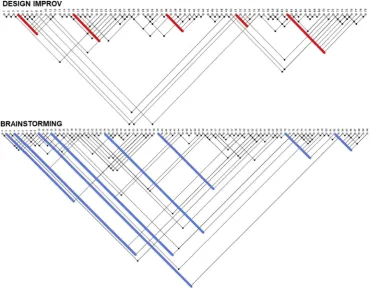
[image:19.544.84.456.58.348.2]Figure 9shows linkographs for each ideation approach highlighting the differ-ence between linkographs based on all design moves, and for ideas only included. This was useful to help understand the productivity and efficiency of the two methods. The linkograph for Design Improv shows little variation between the two linkographs, as 75 of 79 design moves were ideas. Brain-storming however shows clear differences, with 90 design moves reduced to just 46 when only ideas were included. The same move coding introduced in the transcription section and exemplified in Table 2, is used again in Figure 9to give an example of the distribution of non-idea moves within a ses-sion. On average, brainstorming linkographs reduced in size by 43% when other design moves were removed, compared to 15% for Design Improv linko-graphs. There is therefore valuable insight to be gained from considering all design moves, as not doing so would result in the loss of half the content of the brainstorming ideation session. By including these design moves, we were able to make observations regarding the influence that specifications, questions and comments have on the solution-finding process. On the other hand, including all design moves may not always paint a true picture of the fluency and efficiency of a method. Looking at the ‘all design moves’
linkographs inFigure 7, one might assume the two methods produce a similar level of productivity, when this is clearly not the case. Including all design moves may also make ideas-building look more divergent than it really is, for example when critical moves emerge from multiple responses to a question, or a debate surrounding a comment, rather than the development or elabora-tion of an idea.
6
Insights for the linkography process
[image:20.544.91.457.61.336.2]Linkography not only created a visualisation of the structure of each ideation process, it also facilitated quantitative measures of qualitative transcript data that provided insights into process efficiency, inter-connectivity of ideas, group collaboration, and ideation thinking styles. These results could then be explored in more detail by revisiting the linkographs, observing structural shapes and patterns to draw further insights into the nuances of each method. In addition to the findings we have made on the creative processes through the linkogrpahy analysis, there are a range of reflections on its practical applica-tion that are of use for those interested in conducting linkography in other research contexts.
6
.1 Transcription
In our study, all relevant design moves that progressed the ideation were included in the linkography transcript. This included ideas, specifications, questions, comments, and participant knowledge, which is in contrast to pre-vious studies (van der Lugt, 2000; Vidal et al., 2004), where only ideas were considered. While the majority of the content of the Design Improv workshops was ideas, a large proportion of the brainstorming workshops were made up of supplementary discussion surrounding the design problem. Coding the links between these moves showed that much of this discussion helped to progress the group towards exploring new issues and solution spaces. It was therefore relevant to include such content in the linkographs to create a more represen-tative comparison of how new ideas were being formed with each method.
[image:21.544.81.460.60.366.2]We found it beneficial to create linkographs for both conditions and to note the differences as part of the method productivity measures. There were, however, challenges. The transcribing and coding phases of linkography are by their
Figure 9 Back to back comparative linkographs for the Design Improv and brainstorming methods illustrating all design moves and ideas only
nature highly subjective, based on what the researcher defines as a design move or link. We found that for brainstorming workshops in particular, it was chal-lenging to determine what content should be kept and what should be removed, as these workshops included more discussion around the design problem scat-tered throughout. This additional discussion made it harder to determine what comments, questions, etc. either progressed or had the potential to progress the ideation. For a comparison to be made, the most important factor at this stage was consistency across the transcribing of all workshops. Having two re-searchers agree upon the transcripts improved reliability in this respect.
6
.2 Link identification
Identification of links is a subjective activity. Utilising multiple judges is said to increase the reliability of the technique (Goldschmidt, 2014), however, we noted that disagreements could occur not only between researchers, but also between decisions made by the same researcher over time, depending on what perspective was adopted when assessing the design move. We found that while it was beneficial to review links one or two times prior to compar-ison, it was also important to accept the consolidated linkograph as final and not be tempted to continually alter the links during analysis. Working closely together throughout the linkography process created a shared understanding that was reflected in the high-excellent inter-rater agreement. It was also noted that it was more difficult to accurately identify design moves that were not ideas. While still rated as high, agreement for brainstorming workshops was typically lower (around 0.7e0.75), while Design Improv (which mostly con-sisted of ideas) showed slightly more consistency between researchers with reli-ability agreement typically around 0.75e0.82. It was found to be easier to determine clear links between design ideas, where elements from one idea could be traced back to previous ideas. When reviewing brainstorming work-shops, it proved more challenging to link comments, questions and specifica-tions as core elements were not as easily defined.
6
.3 Judges
the previous section, link coding is subjective and context-dependent, and an interpretivist viewpoint suggests that there is no ‘correct’ linkograph, only re-flections of each researcher’s understanding of the creative process. Therefore, a consolidation of linkographs from completely independent judges is unlikely to be any more accurate or representative than the linkograph on one single researcher. So while there were clear benefits to having multiple minds develop a shared understanding of the transcript and how it should be coded, the value of ‘external’ judges in linkography is more limited.
6
.4 Link type coding
Coding the link types provides another level of insight into the ideation pro-cess, specifically how new ideas were being formed. We adapted van der Lugt’s (2000)coding guidelines to accommodate links between ideas and other design moves, as well as repeated ideas that had been applied to a new context. This enabled assessment of the importance of discussion in an ideation session. The Design Improv method was very ideas-focussed whereas the brain-storming workshops allowed more room for questions, comments and knowledge-sharing throughout. In the brainstorming workshops, ‘N’ links (new ideas in response to a question or comment) were the second most com-mon after ‘I’ (incremental), suggesting these additional design moves had a sig-nificant influence on the direction of the ideation.
7
Conclusion
In this paper we have shown in detail how 2 ideation methods may meaning-fully differ beyond measures of the quantity of ideas produced. Brainstorming is the familiar datum against which the new Design Improv method is compared. Design Improv had a higher link density and less self-linking which suggesting an interconnected and collaborative ideation process. Design Im-prov also produced considerably higher numbers of critical moves interpreted as showing higher levels of divergence and, together with more incremental and tangential idea link types, we propose indicative of a progressiveness. Brainstorming displayed a higher number of design moves, but more of Design Improv’s moves were ideas. We related this difference to productivity and ef-ficiency of the idea methods. With brainstorming having more design moves, that were not ideas, participants were more likely to generate what were coded as ‘new idea links’; idea moves inspired by non-idea moves (questions, state-ments etc). Brainstorming linkographs also contained more parallel links which was considered to indicate that participants were more likely to re-state ideas in new contexts. In contrast Design Improv had considerably more tangential links types which was indicative of participants maintaining themes and contexts, and developing ideas within these.
process for robust linkograph development. We have provided a detailed ac-count of the steps followed to produce linkographs ready for analysis, and re-flected on both the value and challenges of developing guidelines, producing transcripts, coding links and link types and involving external judges in the process. We have also reflected on the interpretation of linkographs, contrast-ing the insights provided by includcontrast-ing all design moves and ideas only, and by analysing the visual structure of linkographs and quantitative measurements drawn from them.
We did not utilise the full suite of measurements and notation styles discussed; we selected those which provided a comprehensive comparison of the two design methods within the resources and factors of interest of our study. One of the benefits of linkography is its versatility, although there is a need for better guidance on which methods and measurements to select and how to carry these out most effectively. This paper is intended to contribute toward the further development of improved linkography guidelines.
Acknowledgements
The authors would like to thank all workshop participants for their contribution to this research and the reviewers for their thorough and constructive comments. This work was collaboratively supported by the Engineering and Physical Sci-ences Research Council (EPSRC) and the Arts and Humanities Research Coun-cil (AHRC), grant number EP/N00597X/1. The research data associated with this paper is available from the University of Strathclyde KnowledgeBase at: https://doi.org/10.15129/7a8c5e1e-988b-4f32-ba9a-0ad8c01c0dc6.
References
van Boeijen, A., Daalhuizen, J., Zijlstra, J., & van der Schoor, R. (2014).Delft design guide: Design methods. BIS publishers.
Cai, H., Do, E. Y.-L., & Zimring, C. M. (2010). Extended linkography and dis-tance graph in design evaluation: An empirical study of the dual effects of inspiration sources in creative design.Design Studies, 31, 146e168.
Cash, P., & Storga, M. (2015). Multifaceted assessment of ideation: Using net-works to link ideation and design activity.Journal of Engineering Design, 26, 391e415.
Chou, H.-W., Chen, Y.-L., & Chou, S.-B. (2014). A method for evaluating the creativity of comic strips.Thinking Skills and Creativity, 14, 11e19.
Chou, S.-B., Chou, H.-W., & Chen, Y.-L. (2013). Entropy of Linkography: Eval-uating the creativity of short animation. Creativity Research Journal, 25, 33e37.
El-Khouly, T., & Penn, A. (2014). On an integrated analytical approach to describe quality design process in light of deterministic information theory. InDesign computing and cognition ’12(pp. 451e470). Springer.
Faure, C. (2004). Beyond brainstorming: Effects of different group procedures on selection of ideas and satisfaction with the process. Journal of Creative Behavior, 38, 13e34.
Geschka, H. (1996). Creativity techniques in Germany.Creativity and Innovation Management, 5(2), 87e92.
Glaveanu, V. P. (2011). How are we creative together? Comparing sociocognitive and sociocultural answers.Theory & Psychology, 21(4), 473e492.
Goldschmidt, G. (1990). Linkography: Assessing design productivity. In Cyber-betics and system ’90, proceedings of the tenth european meeting on cybernetics and systems research(pp. 291e298). World Scientific.
Goldschmidt, G. (1992).Criteria for design evaluation: A process-oriented para-digm. In:Evaluating and predicting design performance67e79.
Goldschmidt, G. (1995). The designer as a team of one. Design Studies, 16, 189e209.
Goldschmidt, G. (2014).Linkography: Unfolding the design process. Cambridge, Massachusetts: The MIT press.
Goldschmidt, G. (2016). Linkographic evidence for concurrent divergent and convergent thinking in creative design. Creativity Research Journal, 28, 115e122.
Goldschmidt, G., & Weil, M. (1998). Contents and structure in design reasoning. Design Issues, 14, 85e100.
Hatcher, G., Ion, W., Maclachlan, R., Marlow, M., Simpson, B., & Wodehouse, A. (2018). Evolving improvised ideation from humour constructs: A new method for collaborative divergence.Creativity and Innovation Manage-ment, 27(1), 91e101.
Howard, T. J., Culley, S., & Dekoninck, E. A. (2011). Reuse of ideas and concepts for creative stimuli in engineering design.Journal of Engineering Design, 22, 565e581.
Jiang, H., & Gero, J. S. (2017). Comparing two approaches to studying commu-nications in team design. In Design computing and cognition, Vol. 16 (pp. 301e319). Springer.
Kan, J. W., & Gero, J. S. (2005). Can entropy indicate the richness of idea gen-eration in team designing. InCAADRIA 05, 1(pp. 451e457).
Kan, J. W., & Gero, J. S. (2008). Acquiring information from linkography in pro-tocol studies of designing.Design Studies, 29, 315e337.
Kan, J. W., & Gero, J. S. (2009). Using the FBS ontology to capture semantic design information in design protocol studies. InAbout: Designing. Analysing design meetings(pp. 213e229). CRC Press.
Knight, A. P., & Baer, M. (2014). Get up, stand up the effects of a non-sedentary workspace on information elaboration and group performance.Social Psycho-logical and Personality Science, 5(8), 910e917.
Kohn, N. W., Paulus, P. B., & Choi, Y. (2011). Building on the ideas of others: An examination of the idea combination process.Journal of Experimental Social Psychology, 47, 554e561.
Lee, E. (2014). Factors for creative collaboration of industrial designers and En-gineers: Utilizing linkography.Archives of Design Research, 27, 135e147. van der Lugt, R. (2000). Developing a graphic tool for creative problem solving in
design groups.Design Studies, 21, 505e522.
van der Lugt, R. (2001).Sketching in idea generation meetings. thesis TUDelft.
van der Lugt, R. (2002). Brainsketching and how it differs from brainstorming. Creativity and Innovation Management, 11, 43e54.
McMahon, K., Ruggeri, A., K€ammer, J. E., & Katsikopoulos, K. V. (2016). Beyond idea Generation: The power of groups in developing ideas.Creativity Research Journal, 28, 247e257.
Mitchell, R., Fisher, A., Watson, S., & Jarocki, J. (2017). Linkography ontology refinement and cyber security. InComputing and communication workshop and conference (CCWC), 2017 IEEE 7th annual(pp. 1e9). IEEE.
Pourmohamadi, M., & Gero, J. S. (2011). Linkographer: An analysis tool to study design protocols based on FBS coding scheme. InDS 68-2: Proceedings of the 18th international conference on engineering design (ICED 11), impacting soci-ety through engineering design, Vol. 2: Design theory and research methodology, Lyngby/Copenhagen, Denmark, 15.-19.08. 2011.
Roozenburg, N. (2016). Linkography: Unfolding the design process (book re-view).Design Studies, 42, 137e139.
Salman, H. (2014). Linkography for evaluating ideas connectivity of Computer Aided Design-based protocols. IneCAADe, Vol. 1(pp. 573e581). Northum-bria University.
Shah, J. J., Smith, S. M., & Vargas-Hernandez, N. (2003). Metrics for measuring ideation effectiveness.Design Studies, 24, 111e134.
Stevens, C. J., & Leach, J. (2015). Bodystorming: Effects of collaboration and fa-miliarity on improvising contemporary dance. Cognitive Processing, 16(1), 403e407.
Sutton, R. I., & Hargadon, A. (1996). Brainstorming groups in context: Effective-ness in a product design firm.Administrative Science Quarterly685e718.
Vidal, R., Mulet, E., & Gomez-Senent, E. (2004). Effectiveness of the means of expression in creative problem-solving in design groups.Journal of Engineering Design, 15, 285e298.