City, University of London Institutional Repository
Citation
:
Tamanna, N., Crouch, R.S. and Naher, S. ORCID: 0000-0003-2047-5807 (2017). A One-dimensional Analysis of the Distribution of Temperature, Stress and Strain in the co-axial Laser Cladding Process. AIP Conference Proceedings, 1896, 040015.. doi: 10.1063/1.5008041This is the published version of the paper.
This version of the publication may differ from the final published
version.
Permanent repository link:
http://openaccess.city.ac.uk/id/eprint/19683/Link to published version
:
http://dx.doi.org/10.1063/1.5008041Copyright and reuse:
City Research Online aims to make research
outputs of City, University of London available to a wider audience.
Copyright and Moral Rights remain with the author(s) and/or copyright
holders. URLs from City Research Online may be freely distributed and
linked to.
City Research Online: http://openaccess.city.ac.uk/ [email protected]
A one-dimensional analysis of the distribution of temperature, stress and strain in the
co-axial laser cladding process
Nusrat Tamanna, Roger Crouch, and Sumsun Naher
Citation: AIP Conference Proceedings1896, 040015 (2017); View online: https://doi.org/10.1063/1.5008041
View Table of Contents: http://aip.scitation.org/toc/apc/1896/1
Published by the American Institute of Physics
Articles you may be interested in
Two dimensional finite element thermal model of laser surface glazing for H13 tool steel
AIP Conference Proceedings 1769, 110003 (2016); 10.1063/1.4963512
3D thermal model of laser surface glazing for H13 tool steel
AIP Conference Proceedings 1896, 130003 (2017); 10.1063/1.5008152
Hot rolled high Al containing steels as a replacement for the control rolled high strength low alloy (HSLA) steels
A One-dimensional Analysis of the Distribution of
Temperature, Stress and Strain in the co-axial Laser
Cladding Process
Nusrat Tamanna
1, a)Roger Crouch
1, b)and Sumsun Naher
1, c)1City, University of London, Northampton Square, London EC1V 0HB, United Kingdom
Corresponding author: a) [email protected] b)[email protected] c) [email protected]
Abstract. The co-axial Laser Cladding (LC) is one of the most advanced surface treatment processes where generally a superior powder or wire material is deposited on the substrate to improve surface properties by using laser heat source. In this work, a physical model of the clad and the substrate has been presented. An attempt has been made to describe the simplified relation of temperature, stress and strain with time by using the established theoretical knowledge of generation of stress and strain after thermal treatment. The simplified relation of temperature, stress and strain with time has been explained with the help of schematic diagrams. The finding of this study will help to understand the temperature, stress and strain behaviour with time in the Laser Cladding process.
INTRODUCTION
In Laser Cladding process, optical energy is supplied on the surface within a few picoseconds. The energy absorbed by the powder particles and the substrate surface is termed as heat or thermal energy [1]. The heat melts the clad material and a part of the substrate and conducts through the material according to Fourier’s law of heat
conduction. The absorption of energy is the function of material properties and dimension. Large amount of heat is applied in a localised place in this process. The conduction, convection and radiation are the reasons of cooling while the conduction is the main reason for high cooling rate due to large heat sink of material. The high and uneven heating and cooling rate (1800 ºC/s) cause the formation of the stress in the system [2]. To find the temperature and stress distribution, several analytical, numerical and experimental works have been done [3-5, 6]. The temperature and stress distribution are measured by high speed CCD camera and X-ray diffraction meter experimentally [3, 7]. The numerical process is another way to estimate the temperature and stress distribution by using commercial software [5]. The generation of stress in a component after this thermal treatment is called residual stress [3, 7]. The inhomogeneous phase transformation, expansion and contraction of inhomogeneous temperature distribution and cooling effects mainly generate residual stress in materials. The value of residual stress reaches the temperature dependent yield strength of the materials. It causes a detrimental effect or permanent failure on the component under loading. The growth of residual stress during cooling is a critical issue. An in-depth understanding of the formation of residual stress with temperature, time and position is important to achieve a required optimum value during processing or subsequent post processing. This work focuses on the detail understanding of temperature distribution during heating and cooling in the Laser Cladding process. The change of heating and cooling rate with position has been explained. At the same time, a detail explanation of the generation of stress and strain in the system has been explained with temperature, time and location.
Proceedings of the 20th International ESAFORM Conference on Material Forming
AIP Conf. Proc. 1896, 040015-1–040015-6; https://doi.org/10.1063/1.5008041 Published by AIP Publishing. 978-0-7354-1580-5/$30.00
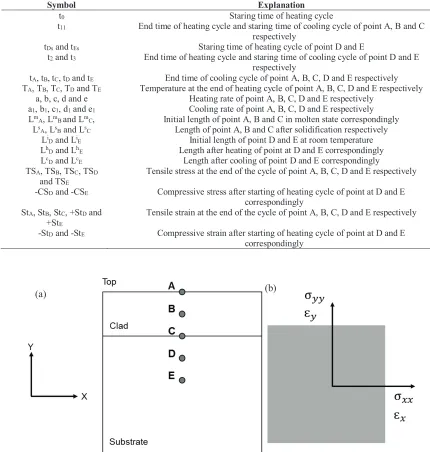
TABLE 1. The symbols described in the text (Nomenclature)
Symbol Explanation
t0 Staring time of heating cycle
t11 End time of heating cycle and staring time of cooling cycle of point A, B and C
respectively
tDs and tEs Staring time of heating cycle of point D and E
t2 and t3 End time of heating cycle and staring time of cooling cycle of point D and E
respectively
tA, tB, tC, tD and tE End time of cooling cycle of point A, B, C, D and E respectively
TA, TB, TC, TD and TE Temperature at the end of heating cycle of point A, B, C, D and E respectively
a, b, c, d and e Heating rate of point A, B, C, D and E respectively a1, b1, c1, d1 and e1 Cooling rate of point A, B, C, D and E respectively
LmA, LmB and LmC, Initial length of point A, B and C in molten state correspondingly
Ls
A, LsB and LsC Length of point A, B and C after solidification respectively
LiD and LiE Initial length of point D and E at room temperature
Lh
D and LhE Length after heating of point at D and E correspondingly
LcD and LcE Length after cooling of point D and E correspondingly
TSA, TSB, TSC, TSD
and TSE
Tensile stress at the end of the cycle of point A, B, C, D and E respectively
-CSD and -CSE Compressive stress after starting of heating cycle of point at D and E
correspondingly StA, StB, StC, +StD and
+StE
Tensile strain at the end of the cycle of point A, B, C, D and E respectively
-StD and -StE Compressive strain after starting of heating cycle of point at D and E
correspondingly
FIGURE 1. A schematic diagram of (a) the clad and the substrate material of Laser Cladding process and (b) the direction of the normal stress.
METHODOLOGY
A physical model of the clad and the substrate has been shown in Figure 1 (a). In this figure, five points (A, B, C, D and E) along the Y axis has been considered to explain the effect of temperature with time during laser cladding process in accordance with arbitrary scale. Point A is situated on the top of the clad surface and point B is placed within the clad material. Point C is based on the interface of the clad and the substrate material. Point D and E are placed in the heated zone within the substrate material. The initial state of the material at point A, B and C were molten and become solidified during cooling. On the other hand, the material at point D and E are initially heated and cool down due to large heat sink of bulk material. Temperature has been considered increasing with time from room temperature to high temperature. This increase in temperature with time is called heating cycle. The cooling
cycle is defined as the decrease of temperature from high temperature to room temperature with time. The variation of heating and cooling rate has been shown at various position from the top surface of the clad along the Y axis. The material properties such as stress and strain are significantly changed with differential heating and cooling rate. The generation of stress and strain with differential heating and cooling rate has been explained for each specified position with a one dimensional example of linear expansion and contraction behaviour. The generation of stress due to thermal process has been explained with the established knowledge of stress generation. Figure 1 (b) shows the direction of normal stress in X and Y direction.
[image:5.612.195.415.240.570.2]The classical heat conduction theory is applied in order to define the temperature distribution. The initial temperature is the room temperature at the beginning of the process. The interaction of liquid metal is ignored. The heat loss due to the convection and the radiation of the laser beam is ignored. The phenomena of the chemical reaction and the stir convection are ignored. The substrate is assumed as stress free before starting the process in order to calculate the stress distribution. The bottom surface is constrained to zero displacement in both X and Y direction. The material properties of the clad and the substrate are assumed isotropic.
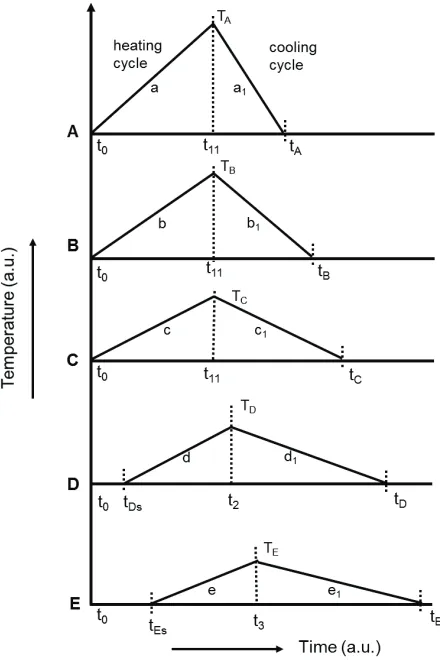
FIGURE 2. The transient heating and cooling cycle during the thermal process.
RESULT AND DISCUSSION
Figure 2 represents the heating and cooling cycle of this process. The variation of heating and cooling rate from the top of the clad to inside the material has been considered. In a co-axial system, the particles move along the laser axis get melted and dropped on the melt pool of the substrate. The particles in the melt pool on the substrate were in a molten state. The heat intensity at the top of the melt pool is higher which causes a temperature gradient normal to the heat propagation [5, 8]. The temperature at the end of heating cycle is indicated as TA, TB, TC, TD and TE at point
A, B, C, D and E respectively. The material at point A, B and C are considered to be molten during heating. The
increment of temperature at point D and E is only due to the heat conduction of material. As a consequence, the chronology of temperature is TA > TB > TC > TD > TE due to temperature gradient.
The heating cycle determines the dimension of the clad and the heat affected zone [1, 4]. The cooling cycle effects on the micro-structure and properties of the materials [1, 4, 7- 9]. The heating cycle (t11- t0) of A, B and C
point is assumed as same which has started at time t0 and ended at time t11. The heating has started later at the point
D and E. The heating cycle of the point D and E is (t2 - tDS) and (t3- tES) respectively. t2, t3, tDS and tES are the starting
and the ending time of heating cycle of the point D and E respectively. The reasons of the cooling at the top surface are conduction, convection and radiation. The inside material cools down by only conduction or thermal gradient [4, 8]. The cooling cycles are represented as (tA- t11), (tB- t11), (tC - t11), (tD - t2) and (tE- t3) for point A, B, C, D and E
correspondingly. t11 is the end time of the heating cycle and the starting time of the cooling cycle of point A, B and
C. t2 and t3 are the starting time of the cooling cycle of the point D and E respectively. The ending time of cooling
cycles of point A, B, C, D and E are tA, tB, tC, tD and tE correspondingly. The cooling cycle immediately starts on the
top of the clad after removing the heat source. At the same time, the temperature of inside material is increasing due to conduction. So, cooling cycle of inside material is started later than the material around the top surface. The chronology of cooling cycle is (tE - t3) > (tD - t2) > (tC - t11) > (tB - t11) > (tA- t11) [8].
The heating and cooling rate are the critical parameters to optimize the material properties [4, 10]. The generation of the differential and uneven heating and cooling rate depend on the heat source, the time of heating, the thermal gradient, environment temperature and materials properties. The heating rate of the point A, B, C, D and E are defined as a, b, c, d and e separately. The intensity of heat flux on the top surface is higher than the inside material. The chronology of heating rate is a > b > c > d > e. The cooling rate of the point A, B, C, D and E are symbolized as a1, b1, c1, d1 and e1 respectively. The thermal gradient depends on the temperature and the position.
[image:6.612.220.384.370.600.2]The top surface having highest temperature. So, the thermal gradient at top the surface at point A is highest which causes higher cooling rate. Same as point D, the cooling rate is slower than point A as the thermal gradient is lower. The chronology of cooling rate is a1 > b1 > c1 > d1 > e1.
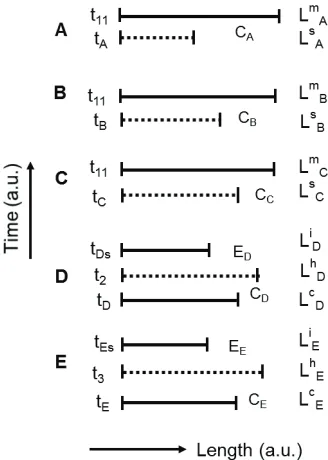
FIGURE 3. The one-dimensional representation of the change of dimension with time during heating and cooling process where the notations for time are taken from the Figure 2.
enters strain and stress in the system [11]. The change of material properties during solidification, heating and cooling are explained by thermal expansion and contraction behaviour [11]. During heating material expands. The extension phenomenon of material dimension is called expansion. The contraction is defined by the decrease of the dimension of material during cooling. The non-equilibrium thermal expansion and contraction enters thermal, elastic and plastic strain and stress in the system [11]. As a result, tensile and compressive strain and stress are generated.
For better understanding, a one dimensional expansion and contraction diagram has been given in Figure 3. At time t1, the material is in liquid phase at point A having length LmA which turns to be solid at time tA having length
Ls
A. The amount of contraction is CA (LmA - LsB). The material at point B and C are in same molten state, after
solidification, the contraction is CB (LmB - LsB) and CC (LmC - LsC). The length at molten and solidified state are LmB,
Ls
C, LsB, LsC of point B and C respectively. The contraction chronology is CC < CB < CA. Because, at point C and B,
the contraction is restricted by the surrounding materials where above the top of the point A have no material contact. At the same time, the cooling rate and temperature at point A is higher than the point B and C. The generated strain is positive in these point and forms tensile stress [4, 10]. In the heated zone (D and E point), initially, the expansion of material is denoted as ED (LiD - LhD) and EE (LiE - LhE) respectively. The length at heated
and cooled state are LhD, Lh
E, LiD, LiE of point D and E respectively. The expansion of material at point D is higher
than the point E due to relatively high temperature and high cooling rate. This behaviour of material at these point forms negative strain and compressive stress. During cooling, the contraction at point D and E is CD (LhD - LcD) and
CE (LhE - LcE) where CD < CE. Because, the thermal gradient and cooling rate at point E is lower than at point D.
[image:7.612.100.517.316.614.2]During cooling a transition is happening from negative strain to positive strain.
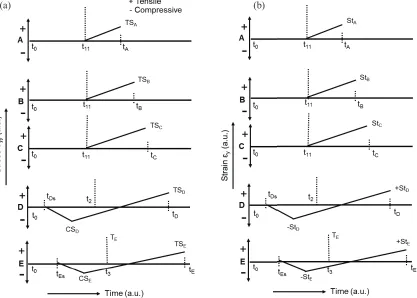
FIGURE 4. The schematic of (a) Stress-Time and (b) Strain-Time diagram of Laser Cladding process.
The generation of stress with time are presented in Figure 4(a). During solidification of the molten zone, the generated tensile stress of point A, B and C are denoted as TSA, TSB and TSC respectively. Above the top surface,
here is no material. The contraction is easier at point than the inside material. Due to the higher cooling rate, high thermal gradient, tensile stress is generated. The additional constrain is, restrain of material, added during the
(a) (b)
contraction of material in B and C point. The material inside of solidified zone conceived relatively higher stress. The chronology of stress value is TSC > TSB > TSA [3, 4, 7]. The heated zone tries to be expanded against the cold
elastic material. The compressive stress is generated at point D and E during heating which are denoted as CSD and
CSE respectively. CSD is greater than CSE due to the higher thermal gradient at point D. During cooling, the material
in the heated zone wants to shrink to the volume at the room temperature. But due to the restrain of surrounding materials, the differential cooling rate and temperature difference in the heated material does not allow them to come back to the original volume. As a consequence, the compressive stress is turned into tensile stress where TSD is
greater than TSE [7, 11].
The strain generates in the process due to thermal contraction which enters thermal, elastic and plastic strain [11]. The generation of tensile strain at point A, B and C are denoted as StA, StB and StC respectively shown in
Figure 4 (b). The chronology of strain is StC> StB> StA due to the same reason of tensile stress generation. The
compressive and tensile strain are generated at point D and E denoted as -StD and +StD, -StE and +StE respectively.
CONCLUSION
A simple physical model of Laser Cladding process has been presented to discuss the effect of temperature on stress and strain in different location during the Laser Cladding process. The change of temperature with time during heating and cooling has been explained by a schematic diagram. The magnitude of temperature, heating rate and cooling rate are different in different location. A one dimensional model has been given to explain the change of dimension of material during the process. The explanation of the generation of stress and strain due to temperature effect and metallurgical bonding of materials has been explained. The formation of stress and strain in this process has been shown by schematic representation. In the heated zone, the turning of the compressive stress and strain to tensile stress and strain has been described. The future work will be extended by using finite element analysis.
ACKNOWLEDGEMENT
Authors are highly grateful to ‘EU funded Erasmus Mundus, LEADERS’ and City, University of London, for funding this project.
REFERENCES
1. E. Toyserkani, A. Khajepour and S. F. Corbin, Laser Cladding, (CRC Press, USA, 2004).
2. M. Schneider, “Laser Cladding with powder on clad properties,” PhD thesis, University of Twente, Enschede, (1998).
3. Z. Zhang, P. Farahmand and R. Kovacevic, Mater. Design 109, 689-699 (2016). 4. P. Farahmand and R. Kovacevic, Opt. Laser Technol. 63, 154–168 (2014). 5. M. Hao and Y. Sun, Int. J. Heat Mass Tran. 64, 352-360 (2013).
6. B. S. Yilbas, Int. Comm. Heat Mass Tran. 20, 545-555 (1993). 7. D. Z. Wang, Surf. Coat. Tech. 274, 51-59 (2015).
8. W. Gao, S. Zhao, Y. Wang, Z. Zhang, F. Liu and X. Lin, Int. J. Heat Mass Tran. 92, 83–90 (2016). 9. S. H. Avner, Introduction to Physical Metallurgy (McGraw-Hill, Singapore, (1974).
10. Y. Chew, J.H.L. Pang, G. Bi and B. Song, J. Mater. Process. Technol. 224, 89–101 (2015).