City, University of London Institutional Repository
Citation
:
Nadimi, S. and Fonseca, J. ORCID: 0000-0002-7654-6005 (2019). A laboratory-based technique for grain size and shape characterisation. Paper presented at the The XVII European Conference on Soil Mechanics and Geotechnical Engineering, 1-6 Sep 2019, Reykjavik, Iceland.This is the published version of the paper.
This version of the publication may differ from the final published
version.
Permanent repository link:
http://openaccess.city.ac.uk/id/eprint/22902/Link to published version
:
Copyright and reuse:
City Research Online aims to make research
outputs of City, University of London available to a wider audience.
Copyright and Moral Rights remain with the author(s) and/or copyright
holders. URLs from City Research Online may be freely distributed and
linked to.
City Research Online: http://openaccess.city.ac.uk/ [email protected]
Geotechnical Engineering foundation of the future
ISBN 978-9935-9436-1-3
© The authors and IGS: All rights reserved, 2019 doi:10.32075/17ECSMGE-2019-0157
A laboratory-based technique for grain size and shape
characterisation
Une technique de laboratoire pour la caractérisation de la taille et de
la forme des grains
S. Nadimi
Newcastle University, Newcastle upon Tyne, UK
J. Fonseca
City, University of London, London, UK
ABSTRACT: The significance of grain shape dependent behaviour is widely reported in the literature. Quantification of grain shape is, however, not part of routine laboratory characterisation and this can be in part attributed to the lack to accessible equipment. In this paper, we discuss the potential of a novel imaging technique to capture the three-dimensional outline of grains. This technique enables the volumetric description of the grain to be obtained by reconstructing the planar projections of the grain acquired at different angles of rotation using a standard camera. The imaging setup is very simple and can be easily implemented in any laboratory. It includes a camera, a lens (optional) and a stepper motor to rotate the object in controllable and precise increments. The greater the number of acquired projections, the better the detail of the reconstructed volume will be. Results from single grain compression tests on Leighton Buzzard sand and a shelly carbonate sand from the Persian Gulf are presented to demonstrate the dependency of the tensile strength on the grain shape. The simplicity and easy access to this laboratory-based technique have the potential to enhance laboratory and physical experiments of geomaterials.
RÉSUMÉ: L'importance du comportement dépendant de la forme du grain est largement rapportée dans la littérature. La quantification de la forme des grains ne fait toutefois pas partie des travaux de caractérisation de routine en laboratoire, ce qui peut être attribué en partie au manque d'équipements accessibles. Dans cet article, nous discutons du potentiel d'une nouvelle technique d'imagerie pour capturer le contour tridimensionnel des grains. Cette technique permet d'obtenir la description volumétrique du grain en reconstruisant les projections planes du grain acquises à différents angles de rotation à l'aide d'une caméra standard. La configuration d'imagerie est très simple et peut être facilement mise en œuvre dans n'importe quel laboratoire. Il comprend une caméra, un objectif (en option) et un moteur pas à pas permettant de faire pivoter l'objet par incréments contrôlables et précis. Plus le nombre de projections acquises est grand, meilleur sera le détail du volume reconstruit. Les résultats d'essais de compression sur un seul grain de sable Leighton Buzzard et d'un sable de type carbonate coquillier du golfe Persique sont présentés afin de démontrer la dépendance de la résistance à la traction sur la forme du grain. La simplicité et l’accès facile à cette technique de laboratoire ont le potentiel d’améliorer les expériences en laboratoire et physiques des géomatériaux.
A.1 - Investigation by laboratory tests
1
INTRODUCTION
The understanding of the characteristics of sands at grain- scale has improved significantly using imaging techniques (e.g. Alshibli & Alsaleh, 2004; Altuhafi & Coop, 2011; Miao & Airey, 2013; Zhang & Baudet, 2013). Remarkably, the advances in high-resolution three-dimensional (3D) X-ray micro computed tomography (μCT) has contributed extraordinary insights in microscale characterisation of soils. This is a non-destructive technique that enables the internal structure of sands, i.e. grain and void size and shape, to be examined at a high level of detail.
The influence of grain morphology, including size and shape, on the overall response of granular materials has been investigated by means of experimental and numerical methods (e.g. Oda & Iwashita, 1999; Lu & McDowell 2007). There are, however, very few studies on the effect of single-grain morphology and contact topology on contact interaction (Cavarretta et al.,
2010; Wang & Coop, 2016; Zhao et al., 2015). Zhao et al. (2015) presented single-grain compression of a few sand grains using μCT and noted that grain morphology and initial microstructure are the most important factors for determining the fracture pattern.
This paper presents a methodology for capturing the morphology of the grain to investigate the grain-scale parameters shaping the mechanical response. The morphology of the grain is obtained via a novel technique that uses two dimensional (2D) images of the grain to reconstruct its 3D shape. This technique, largely inspired by μCT, has the advantage of requiring only a camera and other simple tools readily available in a geotechnical laboratory.
2
METHODS AND MATERIALS
This section describes the image acquisition system used to obtain the projections of the grain at different angles of rotation and the algorithm
2.1
Image acquisition and processing
The set-up used to acquire images of a grain at incremental rotation values has bee recently described by the authors in Nadimi & Fonseca (2017). The set-up includes a camera, lens, remote controller, stepper motor, control kit, power supply, and photography background. The camera used is a digital SLR camera Canon EOS 60D 18 MP CMOS with EF-S 18-200mm lens and 65mm macro tube. A remote controller was used and shutter sound was muted to minimise any potential vibration. The motor is a hybrid, permanent magnet stepper motor with 0.9° step angle and 0.22Nm holding torque. The image resolution is controlled by the distance between the camera lens and the object. The 2D projections of the grain were acquired at various positions by rotating the pedestal where the grain sits in using a stepper motor and a pre-defined angle, denoted here by angle θ.
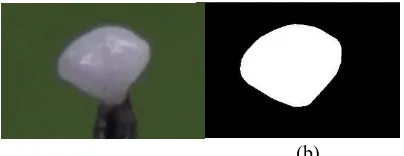
Following image acquisition, the process of converting projections to 3D images comprises two main steps: image binarisation of the 2D projections and volume reconstruction. Using Otsu's method (Otsu, 1979) the threshold value was obtained, below which, pixels take value 0 (pedestal and background pixels) and above take value 1, i.e. pixels forming the grain projection (grain area) as shown in Figures 1 and 2. A total of N binary images, each associated with a unique label i (varying between 1 and N) and a specific
θ angle (acquisition angle), were used to reconstruct the 3D grain.
(a)
(b)
[image:3.536.283.485.493.571.2](a) (b)
Figure 2 (a) 2D projection of a carbonate sand grain showing the green photography background, pedestal, and sand grain, (b) Binarised 2D projection.
2.2
Shape reconstruction
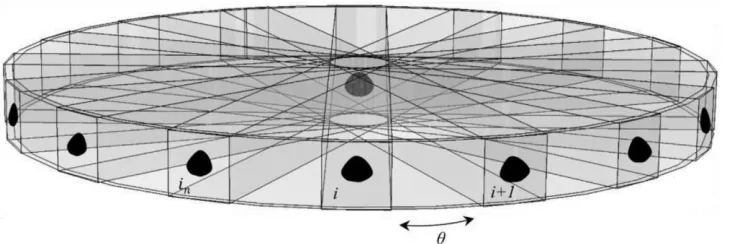
The algorithm for reconstruction consisted first, of extruding the grain projection from each binary image along a constant depth to form a cylinder with the cross section defined by the grain projection, for computational reasons the depth was taken as the largest dimension of the grain. The 3D grain was obtained from finding the intersection of all the N cylinders rotated by the cumulative angle of (i-1)×θ according with the schematics shown in Figure 3. The optimal angle of rotation (θ) and number of projections needed to accurately capture the 3D outline was investigated and reported by authers previously. It was shown that 6 projections can reperesent the shape with 95% accuracy in terms of measured volume. The measured volume equaled the real volume when the number of projections is 25. Thus, 25 projections were used in this study.
2.3
Materials
Five grains were characterised here. This includes four silica grains from Leighton Buzzard sand from the UK, termed here LBS1, LBS2, LBS3 and LBS4, and, one carbonate grain from an uncemented shelly carbonate sand from the Persian Gulf (Fonseca et al., 2015; Kong & Fonseca, 2018), termed here CS1. The acquired volumetric images of the grains are shown in Figure 4.
3
GRAIN CHARACTERISATION
3.1
Grain size
The grain size was quantified by means of the major, intermediate and minor axis lengths. These lengths were obtained using principal component analysis (PCA) implemented in MATLAB, as described in Fonseca et al., (2012). The mathematics of the PCA method are outlined in Haralick and Shapiro (1992), it has been applied to analysis of tomographic references in other fields (e.g. Phillion et al. 2008; Zhang et al.
[image:4.536.52.256.56.144.2]2009) and its application to soil particles is discussed in detail by Fonseca (2011).
[image:4.536.89.454.463.585.2]A.1 - Investigation by laboratory tests
(a)
(b)
(c)
[image:5.536.47.488.63.419.2](d)
(e)
Figure 4 Views of the reconstructed 3D volumes of the four grains investigated here: a) LBS1, b) LBS2, c) LBS3, d) LBS4 and e) CS1
Knowing the principal axis orientations an orthogonal rotation was applied to the voxel coordinates to rotate each particle so that its principal axes of inertia were parallel to the Cartesian axes. The major (a), intermediate (b) and minor (c) dimensions of the particle were calculated respectively as follows:
) min( ) x
max( rot xrot
a= − (1)
) min( )
max(yrot yrot
b= − (2)
) min( )
max(zrot zrot
c= − (3)
where xrot, yrot and zrot are 1D arrays giving the
particle’s voxel coordinates following rotation. The three principal lengths of each particle in microns were then obtained by multiplying the length given in voxels by the size of each voxel.
3.2
Grain shape
3.2.1 Elongation and flatness indices
The elongation (IE) and flatness (IF) of a grain are,
respectively, defined here as follows:
𝐼𝐸= 𝑏/𝑎 (4)
𝐼𝐹= c 𝑎⁄ (5)
where a, b and c are the lengths of the major, intermediate and minor axes of the particle. These indices vary between 0 and 1. A more elongated particle will have a lower IE index.
Similarly, a more plate like particle will have a IF
value closer to 0.
3.2.2 Sphericiy index
The sphericity (IS) was calculated following the
expression proposed by Krumbein (1941):
𝐼𝑆= (𝑏𝑐/𝑎2)1 3⁄ (6)
This index also varies between 0 and 1 and a more spherical grain will have a IS value closer
to one.
[image:6.536.283.482.412.535.2]The results of the size and shape measure-ments are summarise in Table 1 for the five grains analysed here.
Table 1. Summary of size and shape quantification
Grain a [μm]
b [μm]
c [μm]
IE IF IS
LB1 1064 787 687 0.74 0.65 0.78
LB2 1239 1063 800 0.86 0.65 0.82
LB3 672 636 587 0.95 0.87 0.94
LB4 1033 952 857 0.92 0.83 0.91
CS1 859 839 734 0.98 0.85 0.94
4
SINGLE GRAIN COMPRESSION
Single grain experiments are presented in this section on each of the four grains. A strain controlled machine ‘Instron 5969’ was used over a range of force applications up to 2kN. The
instrumentation accuracy was <1μm for displacement and <0.1N for load measurements.
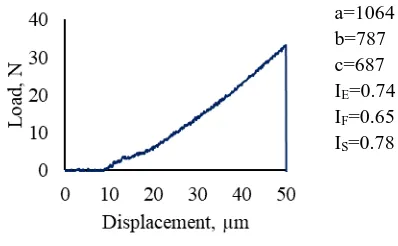
Figures 5 to 9 show the load displacement curves obtained for each grain, in all cases the test ends with the breakage of the grain. When comparing the five curves a notorious difference is the fact that for grains LB3 and CS1 there is an initial plateau before the load starts to increase. This measured displacement at near zero load is likely to be related to small grain rearrangement or rotation as a result of the less stable position of the grain.
Here we hypothesise that the shape of the particle can directly influence the load-displacement curve from single grain compression test. According to the measured shape indices, grains LB3 and CS1 are the most spherical ones (Is=0.94) and also have the least elongated or flat features (highest IE and IF indices). This may
explain their initial movement or rotation in the test by comparison with grains that have one or two axes significantly larger (lower IE and IF and
less spherical)and so, a more stable configuration under testing.
a=1064 b=787 c=687 IE=0.74
IF=0.65
[image:6.536.48.256.459.545.2]IS=0.78
A.1 - Investigation by laboratory tests
a=1239 b=1063 c=800 IE=0.86
IF=0.65
[image:7.536.283.481.56.181.2]IS=0.82
Figure 6 Load-Displacement curve of LB2
a=672 b=636 c=587 IE=0.95
IF=0.87
IS=0.94
Figure 7 Load-Displacement curve of LB3
a=1033 b=952 c=857 IE=0.92
IF=0.83
IS=0.91
Figure 8 Load-Displacement curve of LB4
a=859 b=839 c=734 IE=0.98
IF=0.85
IS=0.94
Figure 9 Load-Displacement curve of CS1
5
CLOSING REMARKS
A novel imaging technique is used here to obtain the volumetric outline of a few sand grains of silica and carbonate mineralogies. The technique is very simple and accessible in any geotecnical laboratory. Once the grains were imaged a matlab code is used to quantify their size and shape. It is shown here that the shape indices of each grain can be linked to the results from single grain compression tests and contribute better understanding on the effect of grain shape on the tensile strength of the grains.
6
ACKNOWLEDGEMENTS
The authors gratefully acknowledge the financial support by the UK Engineering and Physical Sciences Research Council (EPSRC) under the grant number EP/N018168/1.
REFERENCES
Alshibli, K.A., Alsaleh, M.I., 2004. Characterizing surface roughness and shape of sands using digital microscopy. Journal of Computing in Civil Engineering, 18(1), pp.36-45.
[image:7.536.54.250.58.184.2]compression of sands. Géotechnique, 61(6), p.459.
Barrett, P. J. 1980. The shape of rock particles, a critical review. Sedimentology27(3), 291–303. Cavarretta, I., Coop, M., O'Sullivan, C., 2010. The influence of particle characteristics on the behaviour of coarse grained soils.
Géotechnique, 60(6), pp.413-423.
Fonseca, J. 2011. The evolution of morphology and fabric of a sand during shearing. PhD thesis, Imperial College London, London, UK.
Fonseca, J., Reyes-Aldasoro, C. C., Wils, L. 2015. Three-dimensional quantification of the morphology and intragranular void ratio of a shelly carbonate sand. In Deformation characteristics of geomaterials: proceedings of the 6th international symposium on deformation characteristics geomaterials (eds V. A. Rinaldi, M. E. Zeballos and J. J. Clariá), pp. 551–558.
Fonseca, J., O’Sullivan, C., Coop, M.R. & Lee, P.D. 2012. Non-invasive characterization of particle morphology of natural sands. Soils and Foundations52 (4): 712-722.
Haralik, R., Shapiro, L., 1992. Computer and Robot Vision Addison. Longman Publishing Co., Inc., Boston, MA, USA.
Kong D., Fonseca J 2018. Quantification of the morphology of shelly carbonate sands using 3D images. Géotechnique68(3): 249-261. Krumbein, W.C., 1941. Measurement and
geological significance of shape and roundness of sedimentary particles. Journal of Sedimentary Petrology11, 64–72.
Lu, M.M., McDowell, G.R., 2007. The importance of modelling ballast particle shape in the discrete element method.
Granular matter, 9(1-2), p.69.
Miao, G., Airey, D., 2013. Breakage and ultimate states for a carbonate sand. Géotechnique,
63(14), p.1221.
Nadimi, S., Fonseca, J., 2017. Single-Grain Virtualization for Contact Behavior Analysis on Sand. Journal of Geotechnical and
Geoenvironmental Engineering, 143(9), p.06017010.
Oda, M., Iwashita, K., 1999. An Introduction mechanics of granular materials. AA BALKEMA, (1), pp.1-5.
Otsu, N., 1979. A threshold selection method from gray-level histograms. IEEE transactions on systems, man, and cybernetics, 9(1), pp.62-66.
Phillion, A.B., Lee, P.D., Maire, E., Cockcroft, S.L., 2008. Quantitative assessment of deformation-induced damage in a semi-solid aluminum alloy via x-ray micro tomography.
Metallurgical and Materials Transactions A
39A (10), 2459–2469.
Wang, W., Coop, M.R., 2016. An investigation of breakage behaviour of single sand particles using a high-speed microscope camera. Géotechnique, 66(12), pp.984-998. Zhang, Q., Lee, P.D., Singh, R., Wua, G.,
Lindley, T.C., 2009. Micro-CT
characterization of structural features and deformation behavior
of fly ash/aluminum syntactic foam. Acta Materialia 57 (10), 3003–3011.
Zhang, X., Baudet, B.A., 2013. Particle breakage in gap-graded soil. Géotechnique Letters,
3(2), pp.72-77.