4
E U R O P E A N C O M M I S S I O N
THEME 4 Industry, trade and services
Statistics
on the
information
society
in
Europe
Data 1996-2002
Immediate access to harmonised statistical data
E u r o s t a t D a t a S h o p s
A personalised data retrieval service
In order to provide the greatest possible number of people with access to high-quality statistical
information, Eurostat has developed an extensive network of Data Shops (
1).
Data Shops provide a wide range of
tailor-made services:
★
immediate information searches undertaken by a team of experts
in European statistics,
★
rapid and personalised response that takes account of the specified search
requirements and intended use,
★
a choice of data carrier depending on the type of information required.
Information can be requested by phone, mail, fax or e-mail.
(
1) See the list of Eurostat Data Shops at the end of this publication.
I n t e r n e t
Essentials on Community statistical news
★
Euro indicators: more than 100 indicators on the euro zone; harmonised, comparable,
and free of charge.
★
About Eurostat: what it does and how it works.
★
Products and databases: a detailed description of what Eurostat has to offer.
★
Indicators on the European Union: convergence criteria; euro yield curve and further
main indicators on the European Union at your disposal.
★
Press releases: direct access to all Eurostat press releases.
For further information, visit us on the Internet:
www.europa.eu.int/comm/eurostat/
A great deal of additional information on the European Union is available on the Internet. It can be accessed through the Europa server (http://europa.eu.int).
Cataloguing data can be found at the end of this publication.
Luxembourg: Office for Official Publications of the European Communities, 2003
ISBN 92-894-5888-7
© European Communities, 2003
Printed in Luxembourg
PRINTED ON WHITE CHLORINE-FREE PAPER
Europe Direct is a service to help you find answers to your questions about the European Union
EUROSTAT
L-2920 Luxembourg — Tel. (352) 43 01-1 — Telex COMEUR LU 3423
Eurostat is the Statistical Office of the European Communities. Its task is to provide the
European Union with statistics, at a European level, that allow comparisons to be made
between countries and regions. Eurostat consolidates and harmonises the data collected by
the Member States.
To ensure that the vast quantity of accessible data is made widely available and to help each
user make proper use of the information, Eurostat has set up a publications and services
programme.
This programme makes a clear distinction between general and specialist users and
particular collections have been developed for these different groups. The collections
Press
releases
,
Statistics in focus
,
Panorama of the European Union
,
Pocketbooks
and
Catalogues
are aimed at general users. They give immediate key information through analyses, tables,
graphs and maps.
The collections
Methods and nomenclatures
and
Detailed tables
suit the needs of the
specialist who is prepared to spend more time analysing and using very detailed information
and tables.
All Eurostat products are disseminated through the Data Shop network or the sales agents
of the Office for Official Publications of the European Communities. Data Shops are
available in 13 of the 15 Member States as well as in Switzerland, Norway and the United
States. They provide a wide range of services from simple database extracts to tailor-made
investigations. The information is provided on paper and/or in electronic form via e-mail, on
diskette or on CD-ROM.
As part of the new programme, Eurostat has developed its web site. It includes a broad
range of online information on Eurostat products and services, newsletters, catalogues,
online publications and indicators on the euro zone.
FOREWORD
This is the second edition of Statistics on the Information Society in Europe. It aims to provide detailed statistical information on the Information Society in the European Economic Area, Switzerland and the Candidate countries.
Statistical information from a variety of sources, mainly official sources, have been brought together for this publication. The publication uses data from three Eurostat sources that are focused on information society issues, namely the COINS database on communication statistics, the ICT usage and e-commerce survey of enterprises and, for the first time, data from the household sur-vey on ICT usage. The publication also provides detailed data relevant to information and communication technologies extracted from broader Eurostat sources, notably Structural Business Statistics, PRODCOM, short-term business statistics, external trade and the Labour Force Survey. A number of other sources covering specific issues complete the picture. Issues of comparability which remain are indicated in the footnotes, particularly concerning coverage.
Chapter 1 looks at the eEurope Actions Plans and their benchmarking exercises. Chapters 2 and 3 provide data on the sectors producing ICT goods and services and the markets for these products. Chapters 4 to 8 look at ICT penetration and the use of ICT by different segments of society. Chapters 9 and 10 provide some background data and methodological information.
Eurostat aims to enhance the role of Information Society statistics within the European Statistical System and work is underway to collect existing statistical data on the Information Society from the Member States, to harmonise data and to build up new official data sets where there are important gaps.
Statistics on the
Information Society in Europe This publication has been prepared under the responsibility of unit D7 of Eurostat, responsible for “Information society and services”. The opinions expressed are those of the individual authors alone and do not necessarily reflect the position of the European Commission.
Editor: Morag Ottens (Eurostat Unit D7) [email protected]
Statistical Office of the European Communities
Joseph Bech building 5 Rue Alphonse Weicker L-2721 Luxembourg
Database manager:
Christian David (Eurostat Unit D7) [email protected]
Production:
Data processing, analysis, design and desktop publishing by INFORMA sàrl Giovanni Albertone, Simon Allen, Annekatrin Fink, Séverine Gautron, Andrew Redpath, Markus Voget, Daniel Waterschoot
All data requests should be addressed to one of the Eurostat Data Shops listed at the end of this publication. This list is updated on the Internet, at the following address:
http://europa.eu.int/comm/eurostat/
TABLE OF CONTENTS
3
FOREWORD 1
1. eEUROPE 5
2. THE ICT SECTOR 7
2.1 ICT sector in the EU 8
2.2 ICT manufacturing and services development 10
2.3 Structure of ICT manufacturing and services 13
2.4 ICT business demography 19
3. THE ICT MARKET 21
3.1 Output prices 22
3.2 ICT production 24
3.3 EU’s external trade key indicators 32
3.4 Country external trade key indicators 34
3.5 EU’s external trade partners 39
4. ICT PENETRATION 41
4.1 Telephone infrastructure and use 42
4.2 Internet infrastructure 47
4.3 Internet equipment and use 49
4.4 Access costs 51
5. ICT AND EDUCATION 53
6. ICT LABOUR FORCE 57
6.1 ICT skills (digital literacy), workplace training, ICT use in the workplace 58
6.2 Computer professionals 59
6.3 S&T graduates 60
7. ICT USE BY HOUSEHOLDS AND INDIVIDUALS 61
7.1 Household use of ICT 62
7.2 Household Internet access 64
7.3 Use of computers and Internet 65
7.4 Purpose of Internet use 70
7.5 Internet purchases 74
7.6 Type and value of Internet purchases 75
8. ICT USE BY ENTERPRISES 77
8.1 Use of ICT technologies 78
8.2 Use and provision of Internet services 80
8.3 Internet purchases 83
8.4 Internet sales 85
8.5 Destination of Internet sales 87
8.6 On-line payment 89
8.7 Use of specialised market places 90
9. BACKGROUND INFORMATION 91
The Barcelona European Council called on the European Commission to draw up an eEurope action plan focussing on 'the widespread availability and use of broadband networks throughout the Union by 2005', while at the same time devel-oping the use of networks and information through initiatives such as eGovernment, eLearning, eHealth and eBusiness.
At the end of May 2003, the European Commission released a Communication entitled, 'eEurope 2005: an information society for all' . The main objectives of the plan include pro-viding 'a favourable environment for private investment and for the creation of new jobs, to boost productivity, to modernise public services, and to give everyone the opportunity to par-ticipate in the global information society'. The eEurope 2005 plan aims to stimulate secure services, applications and con-tent based on a widely available broadband infrastructure.
The action plan is based on two main groups of actions. Firstly, it encourages and aims to stimulate Internet services, appli-cations and content (both on-line public services and e-com-merce). This 'content initiative' should lead to an increase in the flow and use of information. It is supported by a comple-mentary, second action, that focuses on improving the under-lying communications infrastructure, namely, the promotion of broadband and the development of tools and awareness in relation to security matters. To achieve these goals the plan outlines four main tools.
1. Policy measures: to review and adapt legislation; to ensure that legislation does not hamper new services; to strengthen competition and inter-operability; to improve access to a vari-ety of networks; and, to demonstrate political leadership. Some key targets include to:
à connect public administrations, schools and health care to broadband;
à create interactive public services, accessible for all, and offered on multiple platforms;
à provide on-line health services;
à remove obstacles to the deployment of broadband networks; review legislation affecting e-business.
2. Exchange of experience, of good practices and demonstra-tion projects: projects will be launched to accelerate the cre-ation of leading edge appliccre-ations and infrastructure.
3. Monitoring and benchmarking progress: one of the key instruments being used to measure the improvements in the information society is benchmarking, whereby the perfor-mance of each country is compared against the best practices observed across the EU.
4. Co-ordination of existing policies: to bring out synergies between proposed actions; a steering group will provide a bet-ter overview of policy developments and ensure a good infor-mation exchange between national and European policy mak-ers and the private sector.
This introduction has provided a brief summary of the eEurope initiative. It is in no way comprehensive and for further infor-mation readers are invited to refer to the web-site of the Directorate-General for Information Society, which is available at: http://www.europa.eu.int/information_society/index_en.htm.
1. eEUROPE
6
The data used in this chapter of the publication comes from the structural business statistics database (SBS). The data are based on an enterprise survey, collected within the legal framework provided by the SBS Regulation (Council Regulation No. 58/97 of December 1996 concerning struc-tural business statistics). The definitions are standardised and so the data should be comparable across industries and coun-tries. The information presented reports on the structure and performance of the information and communication technolo-gies (ICT) sector in the Member States, candidate countries, Iceland, Norway and Switzerland.
ICT value added in the EU stood at EUR 433 billion in 2000, split three-quarters for ICT services (75.1 %) and one-quarter for ICT manufacturing (24.9 %). Looking at the division of other main structural business statistics indicators for the ICT sector between manufacturing and services, a similar pattern was observed for turnover and the number of persons employed, with almost three-quarters of the total accounted for by ICT services.
On the other hand, the enterprise structure of the ICT sector was even more heavily weighted in favour of ICT services, as more than nine out of ten ICT enterprises were active in the service sector, in excess of 500 000 enterprises, compared to just 45 000 active in ICT manufacturing. This split was rein-forced when looking at the development of the number of enterprises active in these two sectors between 1996 and 2000 (see figure 2.1.1). There were 12.2 % more enterprises active in the ICT manufacturing sector in 2000 compared to in 1996, while the corresponding rate of change for ICT services was 37.3 % more. The rapid pace of growth in the number of enterprises between 1996 and 1999 came to a halt in 2000, as the number of enterprises in the ICT services sector grew
by 0.8 %, while there was a modest reduction of 0.1 % in the number of ICT manufacturing enterprises.
The value added generated by the EU's ICT manufacturing sec-tor in 2000 was 14.1 % higher than in 1999 (on the basis of a current price comparison) and 40.3 % higher than in 1996 (see figure 2.1.2). The development of turnover grew at an even faster pace, such that by 2001 it was almost 70 % high-er than in 1996. On the othhigh-er hand, the numbhigh-er of phigh-ersons employed fluctuated around its level of 1996. By 2000 there were nearly 4 % more persons employed in the ICT manufac-turing sector than there had been in 1996. However, employ-ment levels subsequently fell in 2001 by 2.5 % (compared to a year before), so that overall there were 1.2 % more persons employed in 2001 than there had been in 1996.
Within ICT services (see figure 2.1.3) there were contrasting trends for the main structural business statistics indicators between 1996 and 2000. Turnover and employment grew at a fairly smooth and constant rate during the period considered within the EU's ICT services sector. On the other hand, after having grown between 1996 and 1999, value added remained almost unchanged in 2000, resulting in a decline in the level of apparent labour productivity, as gains in value added did not keep pace with the expansion in the number of persons employed.
2. THE ICT SECTOR
8
2.1 ICT SECTOR IN THE EU
Activities covered in sub-chapters 1 to 3ICT sector (ICT manufacturing and ICT services)
ICT manufacturing
30 Manufacture of office machinery and computers 30.01 Manufacture of office machinery
30.02 Manufacture of computers and other information processing 31.3 Manufacture of insulated wire and cable
32 Manufacture of radio, television and communication equipment and apparatus
32.1 Manufacture of electronic valves and tubes and other electronic components
32.2 Manufacture of television and radio transmitters and apparatus for line telephony and line telegraphy
32.3 Manufacture of television and radio receivers, sound or video recording or reproducing apparatus and associated goods 33.2 Manufacture of instruments and appliances for measuring, checking,
testing, navigating and other purposes, except industrial process control equipment
33.3 Manufacture of industrial process control equipment
ICT services
51.43 Wholesale of electrical household appliances and radio and television goods
51.64 Wholesale of office machinery and equipment
51.65 Wholesale of other machinery for use in industry, trade and navigation 64.2 Telecommunications
72 Computer and related activities
Unless otherwise noted in tables or graphs, the ICT aggregates presented in sub-chapters 1, 2 and 3 of this chapter cover the following activities
Table 2.1.1: ICT total, EU, 2000 (1)
(1) Estimates.
Source: Eurostat, structural business statistics (theme4/SBS/enterpr/enter_ms).
Number of enter-prises (thou-sands) Turnover (EUR billion) Value added at factor cost (EUR billion) Number of persons employed (thou-sands) Apparent labour productivity (EUR thousand per head)
ICT manufacturing 45 429 108 1 531 70.3
ICT services 503 1 108 325 4 494 72.4
ICT total 548 1 537 433 6 024 71.9
Figure 2.1.1: Number of ICT enterprises in the EU (1996=100) (1)
(1) Estimates.
Source: Eurostat, structural business statistics (theme4/SBS/enterpr/enter_ms).
100 110 120 130 140
1996 1997 1998 1999 2000
Tables 2.12 and 2.1.3 show a breakdown of ICT manufactur-ing and services activity in the EU in 2000. The largest smanufactur-ingle NACE Group within the ICT manufacturing sector, no matter which size measure is used (from the four main indicators pre-sented in table 2.1.2), was the manufacture of television and radio transmitters and apparatus for line telephony and line telegraphy (Group 32.2). In terms of its turnover, this sector accounted for 31.5 % of the EU's ICT manufacturing sector, while its share of value added was 29.2 % and its share of employment was 24.9 %. The smallest ICT manufacturing industries in 2000 were the manufacture of insulated wire and cable (NACE Group 31.3) and the manufacture of indus-trial process control equipment (NACE Group 33.3).
Within the ICT services sector the picture was not as clear. In terms of the number of enterprises, the wholesale trade of other machinery for use in industry, trade and navigation (NACE Class 51.65) was the largest activity, accounting for 42.4 % of all ICT services' enterprises (see table 2.1.3). However, in terms of value added and employment, this activ-ity was the third largest in ICT services. The two ICT service sectors that reported the highest shares of turnover, value added and employment were dominated by relatively large enterprises. Both telecommunications (NACE Group 64.2) and computer and related activities (NACE Division 72) each con-tributed more than one-third to the EU's value added in the ICT services sector in 2000, while together accounting for less than 10 % of the total number of enterprises.
2. THE ICT SECTOR
9 Table 2.1.2: Share in ICT manufacturing total, EU, 2000 (%) (1)
(1) Estimates.
Source: Eurostat, structural business statistics (theme4/SBS/enterpr/enter_ms).
Number of
enterprises Turnover Value added at factor cost
Number of persons employed
Manufacture of office machinery and computers (Division 30) 14.2 21.9 14.7 13.2
Manufacture of insulated wire and cable (Group 31.3) 4.5 5.0 5.2 6.8
Manufacture of electronic valves and tubes and other electronic components (Group 32.1) 13.3 15.1 19.3 17.6
Manufacture of television and radio transmitters and apparatus for line telephony and line
telegraphy (Group 32.2) 26.2 31.5 29.2 24.9
Manufacture of television and radio receivers, sound or video recording or reproducing apparatus
and associated goods (Group 32.3) 7.4 11.7 8.9 10.8
Manufacture of instruments and appliances for measuring, checking, testing, navigating and other
purposes, except industrial process control equipment (Group 33.2) 25.5 12.0 18.9 21.8
Manufacture of industrial process control equipment (Group 33.3) 8.8 2.6 3.8 4.7
ICT manufacturing 100.0 100.0 100.0 100.0
Table 2.1.3: Share in ICT services total, EU, 2000 (%) (1)
(1) Estimates.
Source: Eurostat, structural business statistics (theme4/SBS/enterpr/enter_ms).
Number of
enterprises Turnover Value added at factor cost
Number of persons employed
Wholesale of electrical household appliances and radio and television goods (Class 51.43) 18.1 13.5 5.3 6.3
Wholesale of office machinery and equipment (Class 51.64) 30.3 20.4 10.1 10.6
Wholesale of other machinery for use in industry, trade and navigation (Class 51.65) 42.4 21.1 12.8 15.9
Telecommunications (Group 64.2) 0.3 23.9 36.1 22.5
Computer and related activities (Division 72) 8.9 21.1 35.7 44.7
ICT services 100.0 100.0 100.0 100.0
Figure 2.1.2: Key indicators of ICT manufacturing in the EU (1996=100) (1)
(1) Estimates.
Source: Eurostat, structural business statistics (theme4/SBS/enterpr/enter_ms).
90 100 110 120 130 140 150 160 170 180
1996 1997 1998 1999 2000 2001
Turnover Value added at factor cost
Number of persons employed Apparent labour productivity
Figure 2.1.3: Key indicators of ICT services in the EU (1996=100) (1)
(1) Estimates.
Source: Eurostat, structural business statistics (theme4/SBS/enterpr/enter_ms).
90 100 110 120 130 140 150 160 170 180
1996 1997 1998 1999 2000
Turnover Value added at factor cost
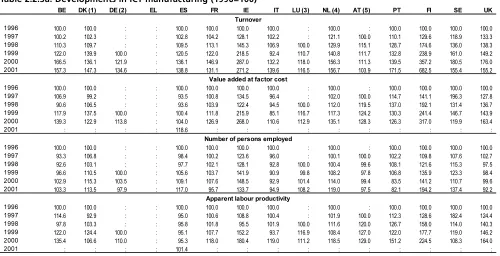
Almost one-third of the EU's ICT manufacturing enterprises were found in Italy, while almost two-thirds of the total number of enterprises were accounted for if the United Kingdom and Germany were added (see table 2.2.1a).
In terms of the main structural business statistics' indicators, Germany was the largest ICT manufacturer in the EU, closely followed by the United Kingdom and France. Finland was the fourth largest contributor to EU turnover, and the fifth largest in terms of value added. There were noticeable differences in the level of apparent labour productivity across ICT manufac-turing sectors of the Member States, with Ireland and Finland both reporting productivity levels that were more than double the EU average. The United Kingdom was the only one of the five largest EU economies to report apparent labour produc-tivity above the EU average. Table 2.2.2a shows that the rapid growth of apparent labour productivity In Finland and Ireland could, in part, be explained by value added more than trebling
in size in Finland and growing 2.7-fold in Ireland between 1996 and 2000. However, Finland and Ireland also reported two of the three highest growth rates for ICT manufacturing employment between 1996 and 2001, with the number of persons employed growing overall by 94.2 % in Finland and 33.7 % in Ireland; employment rose by 37.4 % in Sweden. In contrast, the level of employment in ICT manufacturing fell between 1996 and 2001 in France, Italy, Portugal and the United Kingdom, while it also fell between 1997 and 2001 in Austria and between 1999 and 2001 in Germany.
2. THE ICT SECTOR
10
2.2 ICT MANUFACTURING AND SERVICES DEVELOPMENT
Table 2.2.1a: ICT manufacturing, 2001 (1)(1) Value added and apparent labour productivity, 2000, except for ES; EU-15, 2000; BE, IT, number of persons employed, 2000; NL: excluding NACE Groups 32.2 and 32.3.
Source: Eurostat, structural business statistics (theme4/SBS/enterpr/enter_ms).
EU-15 BE DK DE EL ES FR IE IT LU NL AT PT FI SE UK
Number of enterprises (units) 45 428 570 597 6 415 : 3 115 1 231 217 14 592 14 1 070 510 511 681 1 847 8 504
Turnover (EUR million) 428 570 6 449 3 697 99 644 : 14 390 69 574 25 679 39 937 : 6 678 8 140 4 185 47 397 21 771 74 893
Value added at factor cost (EUR million) 107 661 2 155 1 133 24 976 : 3 055 18 962 5 792 9 539 : 1 786 2 818 744 6 651 4 266 22 663
Number of persons employed (thousands) 1 563 25.5 24.3 352.0 : 66.2 265.5 37.1 183.5 : 29.6 38.4 21.4 65.3 82.5 288.2
Apparent labour productivity (EUR thousand) 68.9 84.8 46.2 67.1 : 46.2 63.5 140.3 53.1 : 63.0 71.9 34.3 140.1 64.2 72.7
Table 2.2.1b: ICT manufacturing, 2001 (1)
(1) NO, 2000; CH, 2000 for NACE Division 32 only; BG, 2000 for value added and apparent labour productivity; CZ, 2000, except for number of enterprises; EE, for NACE Division 32 and Group 33.2 only; EE, 2000 for value added and apparent labour productivity; LV, excluding NACE Group 31.3; LT, excluding NACE Group 33.3; MT, 2000, excluding NACE Groups 31.3 and 33.3; PL, 2000 for value added, apparent labour productivity uses reference year 2000 for value added and 2001 for persons employed; SK, 2000 for value added and apparent labour productivity.
Source: Eurostat, structural business statistics (theme4/SBS/enterpr/enter_ms & enter_cc).
IS NO CH BG CY CZ EE HU LV LT MT PL RO SK SI TR
Number of enterprises (units) : 190 575 564 : 4 148 128 571 113 184 46 6 336 738 310 : :
Turnover (EUR million) : 2 815 3 685 258 : 2 564 97 7 623 37 307 1 765 5 484 658 840 : :
Value added at factor cost (EUR million) : 807 1 417 42 : 590 39 : : : 305 1 207 : 149 : :
Number of persons employed (units) : 11 381 19 235 13 545 : 58 192 5 916 67 997 1 914 10 558 3 162 75 405 26 055 24 429 : :
Apparent labour productivity (EUR thousand) : 70.9 73.7 3.0 : 10.1 6.3 : : : 96.4 16.0 : 5.9 : :
Table 2.2.2a: ICT services, 2000 (1)
(1) EU-15, BE, number of enterprises, 1999; DK, DE, 1999; DE, FR, IE, excluding NACE Group 64.2; NL, excluding NACE Class 51.64 and NACE Group 64.2. Source: Eurostat, structural business statistics (theme4/SBS/enterpr/enter_ms).
EU-15 BE DK DE EL ES FR IE IT LU NL AT PT FI SE UK
Number of enterprises (units) 503 166 13 461 9 144 60 647 : 37 175 66 776 2 642 97 824 1 547 21 260 11 757 6 975 7 707 32 685 152 102
Turnover (EUR million) 1 108 313 44 115 25 355 172 380 : 80 113 133 343 11 548 110 433 3 309 43 771 28 916 14 567 19 193 49 660 258 470
Value added at factor cost (EUR million) 325 384 10 784 7 331 47 725 : 21 468 30 217 3 668 34 758 1 137 11 739 6 845 4 148 5 197 14 282 91 306
Number of persons employed (thousands) 4 494 137 104 579 : 361 547 31 531 9 218 109 73 79 208 1 098
Apparent labour productivity (EUR thousand) 72.4 78.4 70.5 82.4 : 59.5 55.2 118.7 65.5 124.3 53.9 62.7 57.0 65.8 68.7 83.2
Table 2.2.2b: ICT services, 2000 (1)
(1) CH, CZ, LT, NACE Division 72 only; CY, excluding NACE Group 64.2 and NACE Division 72; EE, LV, PL, SK, excluding NACE Group 64.2; HU, NACE Group 64.2 and NACE Division 72 only; PL, SI, number of employees instead of number of persons employed (apparent labour productivity is also calculated on the basis of the number of employees); SI, 1999.
Source: Eurostat, structural business statistics (theme4/SBS/enterpr/enter_ms & enter_cc).
IS NO CH BG CY CZ EE HU LV LT MT PL RO SK SI TR
Number of enterprises (units) : 11 168 9 168 4 941 : 19 286 893 1 037 1 065 720 622 24 457 5 550 1 298 2 040 :
Turnover (EUR million) : 24 059 7 300 1 750 261 1 583 687 3 625 667 90 323 6 709 2 922 1 089 1 301 :
Value added at factor cost (EUR million) : 5 664 4 353 529 50 501 101 1 634 133 27 189 1 607 1 302 185 260 :
Number of persons employed (units) : 83 310 50 209 48 966 1 810 39 730 6 971 36 246 9 231 3 497 4 154 50 356 100 348 15 522 9 745 :
2. THE ICT SECTOR
[image:15.595.70.570.94.350.2]11 Table 2.2.3a: Developments in ICT manufacturing (1996=100)
(1) Excluding NACE Groups 31.3 and 33.3. (2) 1999=100.
(3) 1998=100; NACE Groups 31.3 and 33.2 only. (4) Excluding NACE Groups 32.2 and 33.3. (5) 1997=100.
Source: Eurostat, structural business statistics (theme4/SBS/enterpr/enter_ms).
BE DK (1) DE (2) EL ES FR IE IT LU (3) NL (4) AT (5) PT FI SE UK
1996 100.0 100.0 : : 100.0 100.0 100.0 100.0 : 100.0 : 100.0 100.0 100.0 100.0
1997 100.2 102.3 : : 102.8 104.2 128.1 102.2 : 121.1 100.0 110.1 129.6 118.9 133.3
1998 110.3 109.7 : : 109.5 113.1 145.3 106.9 100.0 129.9 115.1 128.7 174.6 136.0 138.3
1999 122.0 139.9 100.0 : 120.5 122.0 218.5 92.4 110.7 140.8 111.7 132.8 238.9 161.0 149.2
2000 166.5 136.1 121.9 : 136.1 146.9 287.0 132.2 118.0 156.3 111.3 139.5 357.2 180.5 176.0
2001 157.3 147.3 134.6 : 138.8 131.1 271.2 139.6 116.5 156.7 103.9 171.5 682.5 155.4 155.2
1996 100.0 100.0 : : 100.0 100.0 100.0 100.0 : 100.0 : 100.0 100.0 100.0 100.0
1997 106.9 99.2 : : 93.5 100.8 134.5 96.4 : 102.0 100.0 114.7 141.1 196.3 127.8
1998 90.6 106.5 : : 93.6 103.9 122.4 94.5 100.0 112.0 119.5 137.0 192.1 131.4 136.7
1999 117.9 137.5 100.0 : 100.4 111.8 215.9 85.1 116.7 117.3 124.2 130.3 241.4 146.7 143.9
2000 139.3 122.9 113.8 : 104.0 126.9 268.0 110.6 112.9 135.1 128.3 126.3 317.0 119.9 163.4
2001 : : : : 118.6 : : : : : : : : : :
1996 100.0 100.0 : : 100.0 100.0 100.0 100.0 : 100.0 : 100.0 100.0 100.0 100.0
1997 93.3 106.8 : : 98.4 100.2 123.6 96.0 : 100.1 100.0 102.2 109.8 107.6 102.7
1998 92.6 103.1 : : 97.7 102.1 128.1 92.8 100.0 100.4 99.6 108.1 121.6 115.3 97.5
1999 96.6 110.5 100.0 : 105.6 103.7 141.9 90.9 99.8 108.2 97.8 106.8 135.9 123.3 98.4
2000 102.9 115.3 103.5 : 109.1 107.6 148.5 92.9 101.4 114.0 99.4 83.5 141.2 110.7 99.6
2001 103.3 113.5 97.9 : 117.0 95.7 133.7 94.9 108.2 119.0 97.5 82.1 194.2 137.4 92.2
1996 100.0 100.0 : : 100.0 100.0 100.0 100.0 : 100.0 : 100.0 100.0 100.0 100.0
1997 114.6 92.9 : : 95.0 100.6 108.8 100.4 : 101.9 100.0 112.3 128.6 182.4 124.4
1998 97.8 103.3 : : 95.8 101.8 95.5 101.9 100.0 111.6 120.0 126.7 158.0 114.0 140.3
1999 122.0 124.4 100.0 : 95.1 107.7 152.2 93.7 116.9 108.4 127.0 122.0 177.7 119.0 146.2
2000 135.4 106.6 110.0 : 95.3 118.0 180.4 119.0 111.2 118.5 129.0 151.2 224.5 108.3 164.0
2001 : : : : 101.4 : : : : : : : : : :
Turnover
Value added at factor cost
Number of persons employed
Apparent labour productivity
Table 2.2.3b: Developments in ICT manufacturing (1996=100)
(1) NACE Division 32 only; 1997=100. (2) NACE Group 31.3 and NACE Division 32 only. (3) 1997=100.
(4) NACE Divisions 30 and 32 only. (5) 1998=100.
(6) Number of employees instead of number of persons employed (apparent labour productivity is also calculated on the basis of the number of employees). Source: Eurostat, structural business statistics (theme4/SBS/enterpr/enter_ms & enter_cc).
IS NO CH (1) BG CY (2) CZ (3) EE (4) HU (5) LV (3) LT (4) MT PL RO SK (5) SI (6) TR
1996 : 100.0 : 100.0 100.0 : 100.0 : : 100.0 : 100.0 : : 100.0 :
1997 : 105.6 100.0 101.8 132.7 100.0 103.8 : 100.0 112.8 : 122.3 : : 110.5 :
1998 : 107.5 114.5 112.2 105.5 114.6 164.2 100.0 109.3 117.8 : 142.1 : 100.0 119.0 :
1999 : 138.2 112.5 122.5 : 122.8 153.8 144.5 : 129.9 : : : 58.3 125.8 :
2000 : 148.5 118.3 170.6 190.9 193.7 188.5 156.1 : 209.5 : 179.5 : 86.9 : :
2001 : : : 220.6 : : : 180.2 : : : 199.6 : 96.2 : :
1996 : 100.0 : : 100.0 : 100.0 : : 100.0 : 100.0 : : 100.0 :
1997 : 106.4 100.0 : 120.0 : 138.5 : 100.0 107.6 : 111.0 : : 107.0 :
1998 : 96.7 109.6 : 113.3 : 154.8 100.0 130.1 121.1 : 129.5 : 100.0 112.9 :
1999 : 120.9 115.7 : : : 195.2 114.8 : 118.3 : : : 79.3 118.3 :
2000 : 127.1 122.5 : 220.0 : 376.0 : : 216.8 : 129.3 : 113.7 : :
2001 : : : : : : : : : : : : : : : :
1996 : 100.0 : 100.0 100.0 : : : : 100.0 : 100.0 : : 100.0 :
1997 : 102.9 100.0 86.0 96.5 100.0 : : : 81.4 : 99.8 : : 98.2 :
1998 : 103.4 109.1 79.6 96.5 98.9 : 100.0 : 68.0 : 99.2 : : 99.2 :
1999 : 107.6 109.8 64.3 : 97.9 : 121.8 : 64.7 : : : : 98.0 :
2000 : 112.5 110.9 55.4 101.2 109.4 : 145.8 : 61.8 : : : : : :
2001 : : : 53.9 : : : 153.0 : : : 86.7 : : : :
1996 : 100.0 : : 100.0 : : : : 100.0 : 100.0 : : 100.0 :
1997 : 103.4 100.0 : 124.4 : : : : 132.2 : 111.3 : : 109.0 :
1998 : 93.5 100.5 : 117.5 : : 100.0 : 178.1 : 130.5 : : 113.8 :
1999 : 112.4 105.3 : : : : 94.2 : 183.1 : : : : 120.7 :
2000 : 113.1 110.5 : 217.4 : : : : 351.0 : : : : : :
2001 : : : : : : : : : : : : : : : :
Apparent labour productivity Turnover
Value added at factor cost
[image:15.595.68.568.418.675.2]2. THE ICT SECTOR
[image:16.595.26.535.96.319.2]12
Table 2.2.4a: Developments in ICT services (1996=100)
(1) NACE Group 64.2 only. (2) 1998=100.
(3) Excluding NACE Group 64.2. (4) 1997=100.
(5) Excluding NACE Group 64.2 and Division 72.
Source: Eurostat, structural business statistics (theme4/SBS/enterpr/enter_ms).
BE DK (1) DE EL ES (2) FR (3) IE (3) IT LU (4) NL (5) AT (4) PT FI SE (3)(4) UK (2)
1996 100.0 100.0 100.0 : : 100.0 100.0 100.0 : 100.0 : 100.0 100.0 : :
1997 106.1 118.9 118.9 : : 106.5 136.7 106.2 100.0 109.5 100.0 111.2 113.9 100.0 :
1998 123.2 535.4 89.9 : 100.0 123.4 194.8 131.9 125.6 117.8 101.2 134.7 124.9 116.5 100.0
1999 136.6 692.0 104.1 : 117.5 138.1 208.6 135.4 124.3 148.3 108.6 137.1 136.6 127.5 110.8
2000 167.9 278.3 : : 140.5 152.8 388.2 164.2 134.8 : 133.6 154.5 158.5 146.3 128.6
1996 100.0 100.0 : : : 100.0 100.0 100.0 : 100.0 : 100.0 100.0 : :
1997 96.0 124.4 : : : 104.3 148.3 103.6 100.0 101.8 100.0 105.8 111.3 100.0 :
1998 110.4 292.1 : : 100.0 118.7 211.8 118.2 113.0 112.0 90.9 123.0 128.2 118.0 100.0
1999 122.5 429.5 : : 86.0 136.6 252.9 118.1 135.8 149.1 97.2 138.0 143.1 135.0 109.1
2000 135.8 265.9 : : 110.9 145.3 486.1 136.0 143.0 : 97.0 138.8 148.0 146.7 120.9
1996 100.0 100.0 : : : 100.0 100.0 100.0 : 100.0 : 100.0 100.0 : :
1997 102.8 86.3 : : : 103.2 118.4 93.1 100.0 102.0 100.0 101.8 106.5 100.0 :
1998 109.3 380.9 : : 100.0 111.2 171.7 103.2 113.6 110.8 76.3 107.8 118.0 113.7 100.0
1999 121.4 588.2 : : 104.9 120.6 170.1 112.1 120.8 : 76.2 107.6 126.5 123.1 109.9
2000 131.7 374.0 : : 117.6 131.0 176.9 123.3 139.1 : 86.9 108.3 139.1 138.3 116.8
1996 100.0 100.0 : : : 100.0 100.0 100.0 : 100.0 : 100.0 100.0 : :
1997 93.4 144.2 : : : 101.1 125.3 111.2 100.0 99.9 100.0 103.9 104.6 100.0 :
1998 101.0 76.7 : : 100.0 106.7 123.4 114.5 99.5 101.0 119.2 114.1 108.7 103.8 100.0
1999 100.9 73.0 : : 82.0 113.3 148.7 105.3 112.5 ; 127.6 128.2 113.1 109.7 99.2
2000 103.1 71.1 : : 94.3 110.9 274.7 110.3 102.8 ; 111.6 128.2 106.4 106.1 103.5
Turnover
Value added at factor cost
Number of persons employed
Apparent labour productivity
Table 2.2.4b: Developments in ICT services (1996=100)
(1) Excluding NACE Group 64.2. (2) NACE Division 72 only. (3) 1997=100.
(4) Excluding NACE Group 64.2 and Division 72.
(5) Number of employees instead of number of persons employed (apparent labour productivity is also calculated on the basis of the number of employees). (6) NACE Group 64.2 and Division 72 only; 1998=100.
(7) NACE Group 64.2 and Division 72 only; 1999=100.
Source: Eurostat, structural business statistics (theme4/SBS/enterpr/enter_ms & enter_cc).
IS NO (1) CH (2)(3) BG (1) CY (4) CZ (2) EE (2)(5) HU (6) LV (3)(5) LT (2) MT (7) PL (1)(5) RO (3) SK (5) SI (5) TR
1996 : 100.0 : 100.0 100.0 100.0 100.0 : : 100.0 : 100.0 : 100.0 100.0 :
1997 : 116.9 100.0 100.6 95.6 88.4 150.9 : 100.0 195.4 : 123.8 100.0 128.0 115.5 :
1998 : : 132.5 163.5 108.2 86.1 187.1 100.0 167.0 164.2 : 138.9 147.5 159.1 147.7 :
1999 : 142.8 153.2 194.1 : 92.7 194.3 118.5 194.1 205.0 100.0 169.0 172.8 154.1 192.2 :
2000 : 144.1 153.9 249.4 145.9 105.6 221.1 136.9 : 297.7 119.2 217.8 239.3 : : :
2001 : : : : : : 277.9 192.2 : 439.4 : : : : : :
1996 : 100.0 : : 100.0 : 100.0 : : 100.0 : 100.0 : 100.0 100.0 :
1997 : 126.8 100.0 : 85.9 : 135.8 : 100.0 143.0 : 146.5 100.0 120.9 118.1 :
1998 : : 109.6 : 95.4 : 195.4 100.0 176.3 198.9 : 177.5 160.0 143.3 146.8 :
1999 : 166.0 126.9 : : : 192.7 118.5 199.9 262.4 100.0 270.9 196.3 142.6 178.3 :
2000 : 160.5 144.1 : 126.9 : 277.1 131.0 : 294.6 137.4 304.1 285.3 : : :
1996 : 100.0 : 100.0 100.0 100.0 100.0 : : 100.0 : 100.0 : 100.0 100.0 :
1997 : 105.9 100.0 103.8 105.6 103.4 94.0 : 100.0 106.8 : 120.1 100.0 103.6 112.8 :
1998 : : 116.2 104.5 110.6 98.8 96.0 100.0 108.4 117.1 : 135.1 105.5 111.9 126.2 :
1999 : 141.7 135.9 117.4 : 96.0 93.6 101.9 125.5 137.4 100.0 157.6 111.3 106.6 144.7 :
2000 : 148.3 155.0 126.1 118.3 108.1 111.0 108.7 135.8 154.1 115.2 183.0 107.9 : : :
1996 : 100.0 : : 100.0 : 100.0 : : 100.0 : 100.0 : 100.0 100.0 :
1997 : 119.7 100.0 : 81.4 : 144.4 : 100.0 133.9 : 122.0 100.0 116.7 104.7 :
1998 : : 94.3 : 86.3 : 203.5 100.0 162.5 169.9 : 131.4 151.7 128.1 116.3 :
1999 : 117.1 93.4 : : : 205.8 116.3 159.4 191.0 100.0 171.9 176.3 133.8 123.2 :
2000 : 108.3 93.0 : 107.2 : 249.7 120.5 : 191.2 119.2 166.2 264.4 : : :
Apparent labour productivity Turnover
Value added at factor cost
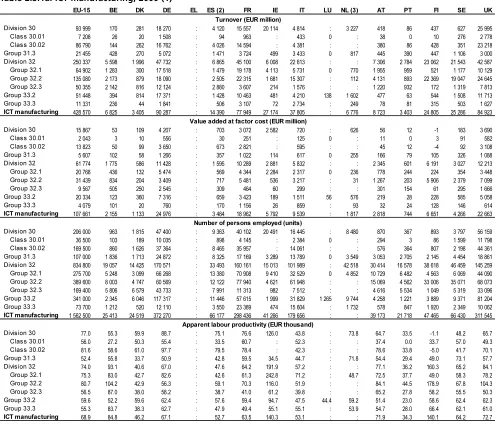
[image:16.595.27.530.400.628.2]Table 2.3.1a shows a set of main indicators broken down by country and by industrial activity. While it is normal to find that the highest levels of turnover, value added and employment are in the largest Member States, it is perhaps more pertinent to study the relative specialisation in ICT manufacturing that exists within the Member States.
Both of the countries where ICT manufacturing grew at a rapid pace during the late 1990s, Finland and Ireland, displayed particularly high relative specialisation ratios in terms of value added. Finland specialised in the manufacture of television and radio transmitters and apparatus for line telephony and line telegraphy (NACE Group 32.2), while Ireland was specialised in the manufacture of office machinery and
computers (NACE Division 30) and the manufacture of electronic valves and tubes and other electronic components (NACE Group 32.1). The remaining parts of the ICT manufacturing sector were far less developed in Finland and Ireland, indeed, often almost non-existent.
2. THE ICT SECTOR
13
2.3 STRUCTURE OF ICT MANUFACTURING AND SERVICES
Table 2.3.1a: ICT manufacturing, 2000 (1)
(1) For a list of NACE Divisions, Groups and Classes please refer to page 8. (2) 2001.
(3) Excluding NACE Group 32.3 from the ICT manufacturing total. Source: Eurostat, structural business statistics (theme4/SBS/enterpr/enter_ms).
EU-15 BE DK DE EL ES (2) FR IE IT LU NL (3) AT PT FI SE UK
Division 30 93 999 170 281 18 270 : 4 120 15 557 20 114 4 814 : 3 227 418 86 437 627 25 995
Class 30.01 7 208 26 20 1 508 : 94 963 : 433 0 : 38 0 10 276 2 778
Class 30.02 86 790 144 262 16 762 : 4 026 14 594 : 4 381 : : 380 86 428 351 23 218
Group 31.3 21 455 428 270 5 072 : 1 471 3 724 499 3 433 0 817 445 390 447 1 106 3 000
Division 32 250 337 5 598 1 996 47 732 : 6 865 45 100 6 008 22 613 : : 7 306 2 784 23 062 21 543 42 587
Group 32.1 64 902 1 283 300 17 518 : 1 479 19 178 4 113 5 731 0 770 1 955 959 521 1 177 10 129
Group 32.2 135 080 2 173 879 18 090 : 2 505 22 315 1 681 15 307 : 112 4 131 893 22 369 19 047 24 645
Group 32.3 50 355 2 142 816 12 124 : 2 880 3 607 214 1 576 : : 1 220 932 172 1 319 7 813
Group 33.2 51 448 394 814 17 371 : 1 428 10 463 481 4 210 138 1 602 477 63 544 1 508 11 713
Group 33.3 11 331 236 44 1 841 : 506 3 107 72 2 734 : 249 78 81 315 503 1 627
ICT manufacturing 428 570 6 825 3 405 90 287 : 14 390 77 949 27 174 37 805 : 6 776 8 723 3 403 24 805 25 286 84 923
Division 30 15 867 53 109 4 207 : 703 3 072 2 582 720 : 626 56 12 -1 183 3 690
Class 30.01 2 043 3 10 556 : 30 251 : 125 0 : 11 0 3 91 582
Class 30.02 13 823 50 99 3 650 : 673 2 821 : 595 : : 45 12 -4 92 3 108
Group 31.3 5 607 102 58 1 266 : 357 1 022 114 617 0 255 166 79 105 326 1 088
Division 32 61 774 1 775 586 11 428 : 1 595 10 289 2 881 5 832 : : 2 345 601 6 191 3 027 12 213
Group 32.1 20 768 436 132 5 474 : 569 4 344 2 284 2 317 0 236 778 244 224 354 3 448
Group 32.2 31 439 834 204 3 409 : 717 5 481 536 3 217 : 31 1 267 203 5 906 2 379 7 099
Group 32.3 9 567 505 250 2 545 : 309 464 60 299 : : 301 154 61 295 1 666
Group 33.2 20 334 123 360 7 316 : 659 3 423 189 1 511 56 576 219 28 228 585 5 058
Group 33.3 4 079 101 20 760 : 170 1 156 26 859 : 93 32 24 128 146 614
ICT manufacturing 107 661 2 155 1 133 24 976 : 3 484 18 962 5 792 9 539 : 1 817 2 818 744 6 651 4 266 22 663
Division 30 206 000 963 1 815 47 400 : 9 363 40 102 20 491 16 445 : 8 480 870 367 893 3 797 56 159
Class 30.01 36 500 103 189 10 035 : 898 4 145 : 2 384 0 : 294 3 86 1 599 11 798
Class 30.02 169 500 860 1 626 37 364 : 8 465 35 957 : 14 061 : : 576 364 807 2 198 44 361
Group 31.3 107 000 1 836 1 713 24 872 : 8 325 17 169 3 289 13 789 0 3 549 3 053 2 705 2 145 4 454 18 861
Division 32 834 800 19 057 14 425 170 571 : 33 493 160 161 15 013 101 989 : 42 518 30 414 16 578 38 618 46 459 145 259
Group 32.1 275 700 5 248 3 099 66 268 : 13 380 70 908 9 410 32 529 0 4 852 10 729 6 482 4 563 6 069 44 090
Group 32.2 389 600 8 003 4 747 60 569 : 12 122 77 940 4 621 61 948 : : 15 069 4 562 33 006 35 071 68 073
Group 32.3 169 400 5 806 6 579 43 733 : 7 991 11 313 982 7 512 : : 4 616 5 534 1 049 5 319 33 096
Group 33.2 341 000 2 345 6 046 117 317 : 11 446 57 615 1 999 31 829 1 265 9 744 4 258 1 221 3 889 9 371 81 204
Group 33.3 73 700 1 212 520 12 110 : 3 550 23 389 474 15 604 : 1 732 578 847 1 920 2 349 10 062
ICT manufacturing 1 562 500 25 413 24 519 372 270 : 66 177 298 436 41 266 179 656 : : 39 173 21 718 47 465 66 430 311 545
Division 30 77.0 55.3 59.9 88.7 : 75.1 76.6 126.0 43.8 : 73.8 64.7 33.5 -1.1 48.2 65.7
Class 30.01 56.0 27.2 50.3 55.4 : 33.5 60.7 : 52.3 : : 37.4 0.0 33.7 57.0 49.3
Class 30.02 81.6 58.6 61.0 97.7 : 79.5 78.4 : 42.3 : : 78.6 33.8 -5.0 41.7 70.1
Group 31.3 52.4 55.8 33.7 50.9 : 42.8 59.5 34.5 44.7 : 71.8 54.4 29.4 49.0 73.1 57.7
Division 32 74.0 93.1 40.6 67.0 : 47.6 64.2 191.9 57.2 : : 77.1 36.2 160.3 65.2 84.1
Group 32.1 75.3 83.0 42.7 82.6 : 42.6 61.3 242.8 71.2 : 48.7 72.5 37.7 49.0 58.3 78.2
Group 32.2 80.7 104.2 42.9 56.3 : 59.1 70.3 116.0 51.9 : : 84.1 44.5 178.9 67.8 104.3
Group 32.3 56.5 87.0 38.0 58.2 : 38.7 41.0 61.2 39.8 : : 65.2 27.8 58.2 55.5 50.3
Group 33.2 59.6 52.2 59.6 62.4 : 57.6 59.4 94.7 47.5 44.4 59.2 51.4 23.0 58.6 62.4 62.3
Group 33.3 55.3 83.7 38.3 62.7 : 47.9 49.4 55.1 55.1 : 53.9 54.7 28.0 66.4 62.1 61.0
ICT manufacturing 68.9 84.8 46.2 67.1 : 52.7 63.5 140.3 53.1 : : 71.9 34.3 140.1 64.2 72.7
Turnover (EUR million)
Value added at factor cost (EUR million)
Number of persons employed (units)
2. THE ICT SECTOR
[image:18.595.34.526.99.523.2]14
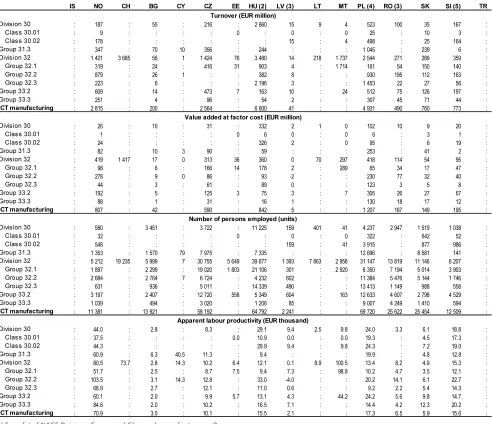
Table 2.3.1b: ICT manufacturing, 2000 (1)
(1) For a list of NACE Divisions, Groups and Classes please refer to page 8. (2) Value added and apparent labour productivity, 1999.
(3) Excluding NACE Group 31.3 from the ICT manufacturing total.
(4) Number of employees instead of number of persons employed (apparent labour productivity is also calculated on the basis of the number of employees). (5) Number of employees instead of number of persons employed (apparent labour productivity is also calculated on the basis of the number of employees); 1999. Source: Eurostat, structural business statistics (theme4/SBS/enterpr/enter_ms & enter_cc).
IS NO CH BG CY CZ EE HU (2) LV (3) LT MT PL (4) RO (3) SK SI (5) TR
Division 30 : 187 : 55 : 216 : 2 660 15 9 4 523 100 35 167 :
Class 30.01 : 9 : : : : 0 : 0 : 0 25 : 10 3 :
Class 30.02 : 178 : : : : : : 15 : 4 498 : 25 164 :
Group 31.3 : 347 : 70 10 356 : 244 : : : 1 045 : 239 6 :
Division 32 : 1 421 3 685 56 1 1 424 76 3 480 14 218 1 737 2 544 271 289 359 :
Group 32.1 : 319 : 24 : 416 31 903 4 : 1 714 161 54 150 140 :
Group 32.2 : 879 : 26 1 : : 382 8 : : 930 195 112 163 :
Group 32.3 : 223 : 6 : : : 2 196 3 : : 1 453 22 27 56 :
Group 33.2 : 609 : 14 : 473 7 163 10 : 24 512 75 126 197 :
Group 33.3 : 251 : 4 : 96 : 54 2 : : 307 45 71 44 :
ICT manufacturing : 2 815 : 200 : 2 564 : 6 600 41 : : 4 931 490 760 773 :
Division 30 : 26 : 10 : 31 : 332 2 1 0 102 10 9 20 :
Class 30.01 : 1 : : : : 0 6 0 : 0 6 : 3 1 :
Class 30.02 : 24 : : : : : 326 2 : 0 95 : 6 19 :
Group 31.3 : 82 : 10 3 90 : 59 : : : 253 : 41 2 :
Division 32 : 419 1 417 17 0 313 36 360 0 70 297 418 114 54 95 :
Group 32.1 : 98 : 6 : 166 14 178 2 : 289 65 34 17 47 :
Group 32.2 : 278 : 9 0 86 : 93 -2 : : 230 77 32 40 :
Group 32.3 : 44 : 3 : 61 : 89 0 : : 123 3 5 8 :
Group 33.2 : 192 : 5 : 125 3 75 3 : 7 305 26 27 67 :
Group 33.3 : 88 : 1 : 31 : 16 1 : : 130 18 17 12 :
ICT manufacturing : 807 : 42 : 590 : 842 5 : : 1 207 167 149 195 :
Division 30 : 580 : 3 451 : 3 722 : 11 225 159 401 41 4 237 2 947 1 519 1 038 :
Class 30.01 : 32 : : : : 0 : 0 : 0 322 : 642 52 :
Class 30.02 : 548 : : : : : : 159 : 41 3 915 : 877 986 :
Group 31.3 : 1 353 : 1 570 79 7 975 : 7 335 : : : 12 696 : 8 581 141 :
Division 32 : 5 212 19 235 5 999 7 30 755 5 649 39 677 1 393 7 863 2 958 31 147 13 819 11 146 6 207 :
Group 32.1 : 1 897 : 2 299 : 19 020 1 803 21 106 301 : 2 920 6 350 7 194 5 014 3 903 :
Group 32.2 : 2 684 : 2 764 7 6 724 : 4 232 602 : : 11 384 5 476 5 144 1 746 :
Group 32.3 : 631 : 936 : 5 011 : 14 339 490 : : 13 413 1 149 988 558 :
Group 33.2 : 3 197 : 2 407 : 12 720 558 5 349 604 : 163 12 633 4 607 2 798 4 529 :
Group 33.3 : 1 039 : 494 : 3 020 : 1 206 85 : : 9 007 4 249 1 410 594 :
ICT manufacturing : 11 381 : 13 921 : 58 192 : 64 792 2 241 : : 69 720 25 622 25 454 12 509 :
Division 30 : 44.0 : 2.8 : 8.3 : 29.1 9.4 2.5 9.8 24.0 3.3 6.1 18.8 :
Class 30.01 : 37.5 : : : : 0.0 10.9 0.0 : 0.0 19.3 : 4.5 17.3 :
Class 30.02 : 44.3 : : : : : 29.9 9.4 : 9.8 24.3 : 7.2 19.0 :
Group 31.3 : 60.9 : 6.3 40.5 11.3 : 9.4 : : : 19.9 : 4.8 12.8 :
Division 32 : 80.5 73.7 2.8 14.3 10.2 6.4 12.1 0.1 8.9 100.5 13.4 8.2 4.9 15.3 :
Group 32.1 : 51.7 : 2.5 : 8.7 7.5 9.4 7.3 : 98.8 10.2 4.7 3.5 12.1 :
Group 32.2 : 103.5 : 3.1 14.3 12.8 : 33.0 -4.0 : : 20.2 14.1 6.1 22.7 :
Group 32.3 : 68.9 : 2.7 : 12.1 : 11.0 0.6 : : 9.2 2.2 5.4 14.3 :
Group 33.2 : 60.1 : 2.0 : 9.9 5.7 13.1 4.3 : 44.2 24.2 5.6 9.8 14.7 :
Group 33.3 : 84.6 : 2.0 : 10.2 : 16.5 7.1 : : 14.4 4.2 12.3 20.2 :
ICT manufacturing : 70.9 : 3.0 : 10.1 : 15.5 2.1 : : 17.3 6.5 5.9 15.6 :
Apparent labour productivity (EUR thousand) Turnover (EUR million)
Value added at factor cost (EUR million)
2. THE ICT SECTOR
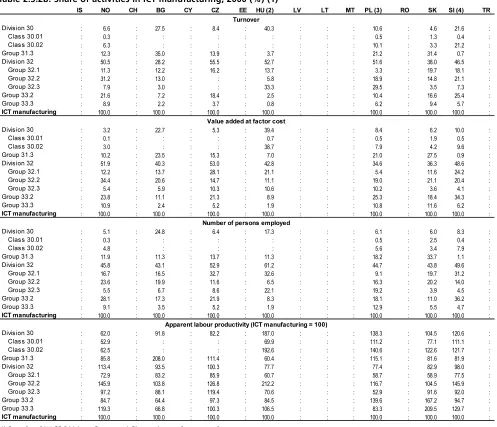
15 Table 2.3.2a: Share of activities in ICT manufacturing, 2000 (%) (1)
(1) For a list of NACE Divisions, Groups and Classes please refer to page 8. (2) 2000.
Source: Eurostat, structural business statistics (theme4/SBS/enterpr/enter_ms).
EU-15 BE DK DE EL ES (2) FR IE IT LU NL AT PT FI SE UK
Division 30 21.9 2.5 8.3 20.2 : 28.6 20.0 74.0 12.7 : : 4.8 2.5 1.8 2.5 30.6
Class 30.01 1.7 0.4 0.6 1.7 : 0.7 1.2 : 1.1 : : 0.4 0.0 0.0 1.1 3.3
Class 30.02 20.3 2.1 7.7 18.6 : 28.0 18.7 : 11.6 : : 4.4 2.5 1.7 1.4 27.3
Group 31.3 5.0 6.3 7.9 5.6 : 10.2 4.8 1.8 9.1 : : 5.1 11.4 1.8 4.4 3.5
Division 32 58.4 82.0 58.6 52.9 : 47.7 57.9 22.1 59.8 : : 83.7 81.8 93.0 85.2 50.1
Group 32.1 15.1 18.8 8.8 19.4 : 10.3 24.6 15.1 15.2 : : 22.4 28.2 2.1 4.7 11.9
Group 32.2 31.5 31.8 25.8 20.0 : 17.4 28.6 6.2 40.5 : : 47.4 26.2 90.2 75.3 29.0
Group 32.3 11.7 31.4 24.0 13.4 : 20.0 4.6 0.8 4.2 : : 14.0 27.4 0.7 5.2 9.2
Group 33.2 12.0 5.8 23.9 19.2 : 9.9 13.4 1.8 11.1 : : 5.5 1.8 2.2 6.0 13.8
Group 33.3 2.6 3.5 1.3 2.0 : 3.5 4.0 0.3 7.2 : : 0.9 2.4 1.3 2.0 1.9
ICT manufacturing 100.0 100.0 100.0 100.0 : 100.0 100.0 100.0 100.0 : : 100.0 100.0 100.0 100.0 100.0
Division 30 14.7 2.5 9.6 16.8 : 20.2 16.2 44.6 7.5 : : 2.0 1.7 0.0 4.3 16.3
Class 30.01 1.9 0.1 0.8 2.2 : 0.9 1.3 : 1.3 : : 0.4 0.0 0.0 2.1 2.6
Class 30.02 12.8 2.3 8.8 14.6 : 19.3 14.9 : 6.2 : : 1.6 1.7 -0.1 2.1 13.7
Group 31.3 5.2 4.8 5.1 5.1 : 10.2 5.4 2.0 6.5 : : 5.9 10.7 1.6 7.6 4.8
Division 32 57.4 82.4 51.8 45.8 : 45.8 54.3 49.7 61.1 : : 83.2 80.7 93.1 71.0 53.9
Group 32.1 19.3 20.2 11.7 21.9 : 16.3 22.9 39.4 24.3 : : 27.6 32.8 3.4 8.3 15.2
Group 32.2 29.2 38.7 18.0 13.6 : 20.6 28.9 9.3 33.7 : : 44.9 27.3 88.8 55.8 31.3
Group 32.3 8.9 23.4 22.1 10.2 : 8.9 2.4 1.0 3.1 : : 10.7 20.7 0.9 6.9 7.4
Group 33.2 18.9 5.7 31.8 29.3 : 18.9 18.1 3.3 15.8 : : 7.8 3.8 3.4 13.7 22.3
Group 33.3 3.8 4.7 1.8 3.0 : 4.9 6.1 0.5 9.0 : : 1.1 3.2 1.9 3.4 2.7
ICT manufacturing 100.0 100.0 100.0 100.0 : 100.0 100.0 100.0 100.0 : : 100.0 100.0 100.0 100.0 100.0
Division 30 13.2 3.8 7.4 12.7 : 14.1 13.4 49.7 9.2 : : 2.2 1.7 1.9 5.7 18.0
Class 30.01 2.3 0.4 0.8 2.7 : 1.4 1.4 : 1.3 : : 0.8 0.0 0.2 2.4 3.8
Class 30.02 10.8 3.4 6.6 10.0 : 12.8 12.0 : 7.8 : : 1.5 1.7 1.7 3.3 14.2
Group 31.3 6.8 7.2 7.0 6.7 : 12.6 5.8 8.0 7.7 : : 7.8 12.5 4.5 6.7 6.1
Division 32 53.4 75.0 58.8 45.8 : 50.6 53.7 36.4 56.8 : : 77.6 76.3 81.4 69.9 46.6
Group 32.1 17.6 20.7 12.6 17.8 : 20.2 23.8 22.8 18.1 : : 27.4 29.8 9.6 9.1 14.2
Group 32.2 24.9 31.5 19.4 16.3 : 18.3 26.1 11.2 34.5 : : 38.5 21.0 69.5 52.8 21.9
Group 32.3 10.8 22.8 26.8 11.7 : 12.1 3.8 2.4 4.2 : : 11.8 25.5 2.2 8.0 10.6
Group 33.2 21.8 9.2 24.7 31.5 : 17.3 19.3 4.8 17.7 : : 10.9 5.6 8.2 14.1 26.1
Group 33.3 4.7 4.8 2.1 3.3 : 5.4 7.8 1.1 8.7 : : 1.5 3.9 4.0 3.5 3.2
ICT manufacturing 100.0 100.0 100.0 100.0 : 100.0 100.0 100.0 100.0 : : 100.0 100.0 100.0 100.0 100.0
Division 30 111.8 65.3 129.6 132.3 : 142.7 120.6 89.8 82.4 : : 90.0 97.8 -0.8 75.0 90.3
Class 30.01 81.2 32.1 108.8 82.6 : 63.7 95.5 : 98.6 : : 52.0 0.0 24.1 88.8 67.8
Class 30.02 118.4 69.1 132.0 145.6 : 151.1 123.5 : 79.7 : : 109.3 98.6 -3.5 65.0 96.3
Group 31.3 76.1 65.8 72.9 75.8 : 81.4 93.7 24.6 84.3 : : 75.6 85.6 35.0 113.8 79.3
Division 32 107.4 109.9 88.0 99.9 : 90.5 101.1 136.7 107.7 : : 107.2 105.7 114.4 101.5 115.6
Group 32.1 109.3 97.9 92.3 123.1 : 80.8 96.4 173.0 134.1 : : 100.8 109.9 35.0 90.7 107.5
Group 32.2 117.1 122.9 92.9 83.9 : 112.3 110.7 82.7 97.8 : : 116.8 129.8 127.7 105.6 143.4
Group 32.3 82.0 102.6 82.3 86.8 : 73.5 64.6 43.6 75.0 : : 90.6 81.0 41.6 86.4 69.2
Group 33.2 86.5 61.6 129.0 93.0 : 109.3 93.5 67.5 89.4 : : 71.5 67.2 41.8 97.1 85.6
Group 33.3 80.3 98.7 82.8 93.5 : 91.1 77.8 39.2 103.7 : : 76.0 81.6 47.4 96.7 83.8
ICT manufacturing 100.0 100.0 100.0 100.0 : 100.0 100.0 100.0 100.0 : : 100.0 100.0 100.0 100.0 100.0
Turnover
Value added at factor cost
Number of persons employed
2. THE ICT SECTOR
[image:20.595.31.528.94.521.2]16
Table 2.3.2b: Share of activities in ICT manufacturing, 2000 (%) (1)
(1) For a list of NACE Divisions, Groups and Classes please refer to page 8. (2) Value added and apparent labour productivity, 1999.
(3) Number of employees instead of number of persons employed (apparent labour productivity is also calculated on the basis of the number of employees). (4) Number of employees instead of number of persons employed (apparent labour productivity is also calculated on the basis of the number of employees); 1999. Source: Eurostat, structural business statistics (theme4/SBS/enterpr/enter_ms & enter_cc).
IS NO CH BG CY CZ EE HU (2) LV LT MT PL (3) RO SK SI (4) TR
Division 30 : 6.6 : 27.5 : 8.4 : 40.3 : : : 10.6 : 4.6 21.6 :
Class 30.01 : 0.3 : : : : : : : : : 0.5 : 1.3 0.4 :
Class 30.02 : 6.3 : : : : : : : : : 10.1 : 3.3 21.2 :
Group 31.3 : 12.3 : 35.0 : 13.9 : 3.7 : : : 21.2 : 31.4 0.7 :
Division 32 : 50.5 : 28.2 : 55.5 : 52.7 : : : 51.6 : 38.0 46.5 :
Group 32.1 : 11.3 : 12.2 : 16.2 : 13.7 : : : 3.3 : 19.7 18.1 :
Group 32.2 : 31.2 : 13.0 : : : 5.8 : : : 18.9 : 14.8 21.1 :
Group 32.3 : 7.9 : 3.0 : : : 33.3 : : : 29.5 : 3.5 7.3 :
Group 33.2 : 21.6 : 7.2 : 18.4 : 2.5 : : : 10.4 : 16.6 25.4 :
Group 33.3 : 8.9 : 2.2 : 3.7 : 0.8 : : : 6.2 : 9.4 5.7 :
ICT manufacturing : 100.0 : 100.0 : 100.0 : 100.0 : : : 100.0 : 100.0 100.0 :
Division 30 : 3.2 : 22.7 : 5.3 : 39.4 : : : 8.4 : 6.2 10.0 :
Class 30.01 : 0.1 : : : : : 0.7 : : : 0.5 : 1.9 0.5 :
Class 30.02 : 3.0 : : : : : 38.7 : : : 7.9 : 4.2 9.6 :
Group 31.3 : 10.2 : 23.5 : 15.3 : 7.0 : : : 21.0 : 27.5 0.9 :
Division 32 : 51.9 : 40.3 : 53.0 : 42.8 : : : 34.6 : 36.3 48.6 :
Group 32.1 : 12.2 : 13.7 : 28.1 : 21.1 : : : 5.4 : 11.6 24.2 :
Group 32.2 : 34.4 : 20.6 : 14.7 : 11.1 : : : 19.0 : 21.1 20.4 :
Group 32.3 : 5.4 : 5.9 : 10.3 : 10.6 : : : 10.2 : 3.6 4.1 :
Group 33.2 : 23.8 : 11.1 : 21.3 : 8.9 : : : 25.3 : 18.4 34.3 :
Group 33.3 : 10.9 : 2.4 : 5.2 : 1.9 : : : 10.8 : 11.6 6.2 :
ICT manufacturing : 100.0 : 100.0 : 100.0 : 100.0 : : : 100.0 : 100.0 100.0 :
Division 30 : 5.1 : 24.8 : 6.4 : 17.3 : : : 6.1 : 6.0 8.3 :
Class 30.01 : 0.3 : : : : : : : : : 0.5 : 2.5 0.4 :
Class 30.02 : 4.8 : : : : : : : : : 5.6 : 3.4 7.9 :
Group 31.3 : 11.9 : 11.3 : 13.7 : 11.3 : : : 18.2 : 33.7 1.1 :
Division 32 : 45.8 : 43.1 : 52.9 : 61.2 : : : 44.7 : 43.8 49.6 :
Group 32.1 : 16.7 : 16.5 : 32.7 : 32.6 : : : 9.1 : 19.7 31.2 :
Group 32.2 : 23.6 : 19.9 : 11.6 : 6.5 : : : 16.3 : 20.2 14.0 :
Group 32.3 : 5.5 : 6.7 : 8.6 : 22.1 : : : 19.2 : 3.9 4.5 :
Group 33.2 : 28.1 : 17.3 : 21.9 : 8.3 : : : 18.1 : 11.0 36.2 :
Group 33.3 : 9.1 : 3.5 : 5.2 : 1.9 : : : 12.9 : 5.5 4.7 :
ICT manufacturing : 100.0 : 100.0 : 100.0 : 100.0 : : : 100.0 : 100.0 100.0 :
Division 30 : 62.0 : 91.8 : 82.2 : 187.0 : : : 138.3 : 104.5 120.6 :
Class 30.01 : 52.9 : : : : : 69.9 : : : 111.2 : 77.1 111.1 :
Class 30.02 : 62.5 : : : : : 192.6 : : : 140.6 : 122.6 121.7 :
Group 31.3 : 85.8 : 208.0 : 111.4 : 60.4 : : : 115.1 : 81.6 81.9 :
Division 32 : 113.4 : 93.5 : 100.3 : 77.7 : : : 77.4 : 82.9 98.0 :
Group 32.1 : 72.9 : 83.2 : 85.9 : 60.7 : : : 58.7 : 58.9 77.5 :
Group 32.2 : 145.9 : 103.8 : 126.8 : 212.2 : : : 116.7 : 104.5 145.9 :
Group 32.3 : 97.2 : 88.1 : 119.4 : 70.6 : : : 52.9 : 91.6 92.0 :
Group 33.2 : 84.7 : 64.4 : 97.3 : 84.5 : : : 139.6 : 167.2 94.7 :
Group 33.3 : 119.3 : 66.8 : 100.3 : 106.5 : : : 83.3 : 209.5 129.7 :
ICT manufacturing : 100.0 : 100.0 : 100.0 : 100.0 : : : 100.0 : 100.0 100.0 :
Apparent labour productivity (ICT manufacturing = 100) Turnover
Value added at factor cost
2. THE ICT SECTOR
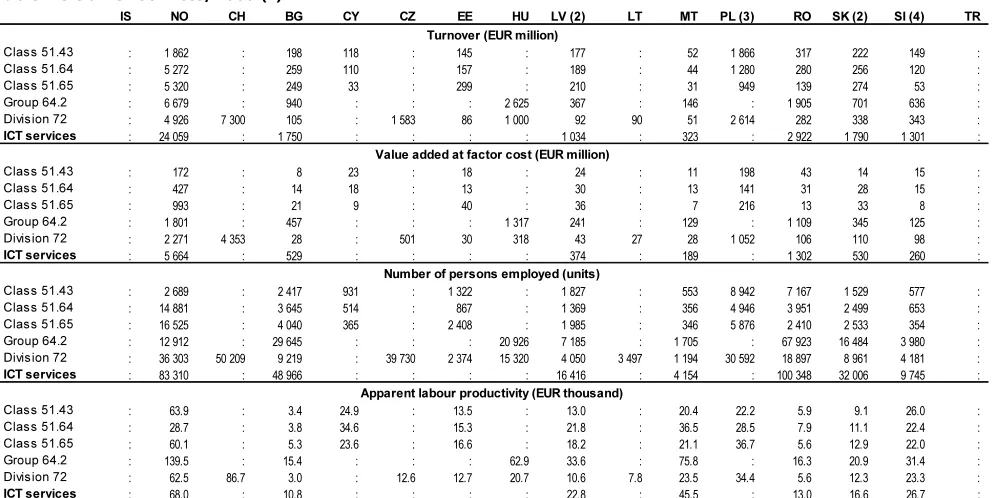
[image:21.595.70.570.97.350.2]17 Table 2.3.3a: ICT services, 2000 (1)
(1) For a list of NACE Divisions, Groups and Classes please refer to page 8. (2) 1999.
Source: Eurostat, structural business statistics (theme4/SBS/enterpr/enter_ms).
EU-15 BE DK (2) DE (2) EL ES FR IE IT LU NL AT PT FI SE UK
Class 51.43 149 799 7 951 3 261 35 125 : 12 885 10 440 1 042 19 921 191 8 785 3 581 2 570 934 6 160 27 197
Class 51.64 226 560 8 820 7 887 40 893 : 10 967 29 832 4 799 16 848 627 : 6 847 2 443 4 186 9 582 46 198
Class 51.65 233 440 11 596 5 820 22 004 : 22 165 57 577 1 034 10 312 1 120 21 642 7 298 2 805 5 597 12 398 50 542
Group 64.2 264 794 9 115 3 816 40 065 : 23 163 : : 35 474 875 : 6 696 5 472 5 056 8 582 67 906
Division 72 233 720 6 633 4 571 34 293 : 10 934 35 493 4 672 27 879 498 13 345 4 493 1 277 3 420 12 938 66 629
ICT services 1 108 313 44 115 25 355 172 380 : 80 113 : : 110 433 3 309 : 28 916 14 567 19 193 49 660 258 470
Class 51.43 17 311 533 321 5 060 : 1 301 863 172 2 162 26 712 503 328 86 798 3 697
Class 51.64 32 725 1 411 1 283 10 525 : 1 206 4 121 830 2 553 110 : 1 095 302 615 1 580 9 318
Class 51.65 41 777 2 041 1 276 4 910 : 4 002 8 879 222 1 684 176 4 088 1 347 490 1 141 2 005 10 321
Group 64.2 117 442 4 146 2 330 29 099 : 10 082 : : 16 729 613 : 2 000 2 531 1 870 4 516 29 220
Division 72 116 129 2 653 2 122 27 229 : 4 877 16 353 2 443 11 631 214 6 939 1 900 497 1 486 5 382 38 750
ICT services 325 384 10 784 7 331 76 823 : 21 468 : : 34 758 1 137 : 6 845 4 148 5 197 14 282 91 306
Class 51.43 283 100 8 078 4 509 77 852 : 29 595 14 624 2 491 47 629 438 12 682 8 640 10 335 1 379 12 427 53 362
Class 51.64 476 700 19 962 22 254 77 352 : 30 734 74 322 6 198 45 491 1 746 : 15 235 9 703 8 692 23 983 101 596
Class 51.65 714 100 31 373 22 008 74 961 : 85 821 160 448 3 426 32 263 1 810 76 570 24 046 17 285 18 046 32 907 135 926
Group 64.2 1 011 600 32 697 20 538 : : 80 793 : : 111 705 1 009 62 034 25 771 20 190 19 099 33 405 234 301
Division 72 2 008 000 45 389 34 724 349 000 : 133 576 297 684 18 779 293 491 4 145 128 361 35 426 15 190 31 712 105 170 572 685
ICT services 4 493 500 137 499 104 033 : : 360 519 : : 530 579 9 148 : 109 118 72 703 78 928 207 892 1 097 870
Class 51.43 61.1 65.9 71.1 65.0 : 44.0 59.0 69.0 45.4 58.4 56.1 58.2 31.7 62.1 64.2 69.3
Class 51.64 68.6 70.7 57.6 136.1 : 39.2 55.4 133.9 56.1 62.7 : 71.9 31.2 70.7 65.9 91.7
Class 51.65 58.5 65.1 58.0 65.5 : 46.6 55.3 64.9 52.2 97.0 53.4 56.0 28.3 63.2 60.9 75.9
Group 64.2 116.1 126.8 113.4 : : 124.8 : : 149.8 607.5 : 77.6 125.4 97.9 135.2 124.7
Division 72 57.8 58.4 61.1 78.0 : 36.5 54.9 130.1 39.6 51.5 54.1 53.6 32.7 46.8 51.2 67.7
ICT services 72.4 78.4 70.5 : : 59.5 : : 65.5 124.3 : 62.7 57.0 65.8 68.7 83.2
Turnover (EUR million)
Value added at factor cost (EUR million)
Number of persons employed (units)
Apparent labour productivity (EUR thousand)
Table 2.3.3b: ICT services, 2000 (1)
(1) For a list of NACE Divisions, Groups and Classes please refer to page 8. (2) 1998 for NACE Group 64.2, which also forms part of the ICT services total.
(3) Number of employees instead of number of persons employed (apparent labour productivity is also calculated on the basis of the number of employees). (4) Number of employees instead of number of persons employed (apparent labour productivity is also calculated on the basis of the number of employees); 1999. Source: Eurostat, structural business statistics (theme4/SBS/enterpr/enter_ms & enter_cc).
IS NO CH BG CY CZ EE HU LV (2) LT MT PL (3) RO SK (2) SI (4) TR
Class 51.43 : 1 862 : 198 118 : 145 : 177 : 52 1 866 317 222 149 :
Class 51.64 : 5 272 : 259 110 : 157 : 189 : 44 1 280 280 256 120 :
Class 51.65 : 5 320 : 249 33 : 299 : 210 : 31 949 139 274 53 :
Group 64.2 : 6 679 : 940 : : : 2 625 367 : 146 : 1 905 701 636 :
Division 72 : 4 926 7 300 105 : 1 583 86 1 000 92 90 51 2 614 282 338 343 :
ICT services : 24 059 : 1 750 : : : : 1 034 : 323 : 2 922 1 790 1 301 :
Class 51.43 : 172 : 8 23 : 18 : 24 : 11 198 43 14 15 :
Class 51.64 : 427 : 14 18 : 13 : 30 : 13 141 31 28 15 :
Class 51.65 : 993 : 21 9 : 40 : 36 : 7 216 13 33 8 :
Group 64.2 : 1 801 : 457 : : : 1 317 241 : 129 : 1 109 345 125 :
Division 72 : 2 271 4 353 28 : 501 30 318 43 27 28 1 052 106 110 98 :
ICT services : 5 664 : 529 : : : : 374 : 189 : 1 302 530 260 :
Class 51.43 : 2 689 : 2 417 931 : 1 322 : 1 827 : 553 8 942 7 167 1 529 577 :
Class 51.64 : 14 881 : 3 645 514 : 867 : 1 369 : 356 4 946 3 951 2 499 653 :
Class 51.65 : 16 525 : 4 040 365 : 2 408 : 1 985 : 346 5 876 2 410 2 533 354 :
Group 64.2 : 12 912 : 29 645 : : : 20 926 7 185 : 1 705 : 67 923 16 484 3 980 :
Division 72 : 36 303 50 209 9 219 : 39 730 2 374 15 320 4 050 3 497 1 194 30 592 18 897 8 961 4 181 :
ICT services : 83 310 : 48 966 : : : : 16 416 : 4 154 : 100 348 32 006 9 745 :
Class 51.43 : 63.9 : 3.4 24.9 : 13.5 : 13.0 : 20.4 22.2 5.9 9.1 26.0 :
Class 51.64 : 28.7 : 3.8 34.6 : 15.3 : 21.8 : 36.5 28.5 7.9 11.1 22.4 :
Class 51.65 : 60.1 : 5.3 23.6 : 16.6 : 18.2 : 21.1 36.7 5.6 12.9 22.0 :
Group 64.2 : 139.5 : 15.4 : : : 62.9 33.6 : 75.8 : 16.3 20.9 31.4 :
Division 72 : 62.5 86.7 3.0 : 12.6 12.7 20.7 10.6 7.8 23.5 34.4 5.6 12.3 23.3 :
ICT services : 68.0 : 10.8 : : : : 22.8 : 45.5 : 13.0 16.6 26.7 :
Apparent labour productivity (EUR thousand) Turnover (EUR million)
Value added at factor cost (EUR million)
[image:21.595.72.570.396.645.2]2. THE ICT SECTOR
[image:22.595.29.532.95.351.2]18
Table 2.3.4a: Share of activities in ICT services, 2000 (%) (1)
(1) For a list of NACE Divisions, Groups and Classes please refer to page 8. (2) 1999.
Source: Eurostat, structural business statistics (theme4/SBS/enterpr/enter_ms).
EU-15 BE DK (2) DE (2) EL ES FR IE IT LU NL AT PT FI SE UK
Class 51.43 13.5 18.0 12.9 20.4 : 16.1 : : 18.0 5.8 : 12.4 17.6 4.9 12.4 10.5
Class 51.64 20.4 20.0 31.1 23.7 : 13.7 : : 15.3 18.9 : 23.7 16.8 21.8 19.3 17.9
Class 51.65 21.1 26.3 23.0 12.8 : 27.7 : : 9.3 33.8 : 25.2 19.3 29.2 25.0 19.6
Group 64.2 23.9 20.7 15.0 23.2 : 28.9 : : 32.1 26.4 : 23.2 37.6 26.3 17.3 26.3
Division 72 21.1 15.0 18.0 19.9 : 13.6 : : 25.2 15.0 : 15.5 8.8 17.8 26.1 25.8
ICT services 100.0 100.0 100.0 100.0 : 100.0 : : 100.0 100.0 : 100.0 100.0 100.0 100.0 100.0
Class 51.43 5.3 4.9 4.4 6.6 : 6.1 : : 6.2 2.3 : 7.4 7.9 1.6 5.6 4.0
Class 51.64 10.1 13.1 17.5 13.7 : 5.6 : : 7.3 9.6 : 16.0 7.3 11.8 11.1 10.2
Class 51.65 12.8 18.9 17.4 6.4 : 18.6 : : 4.8 15.4 : 19.7 11.8 22.0 14.0 11.3
Group 64.2 36.1 38.4 31.8 37.9 : 47.0 : : 48.1 53.9 : 29.2 61.0 36.0 31.6 32.0
Division 72 35.7 24.6 28.9 35.4 : 22.7 : : 33.5 18.8 : 27.8 12.0 28.6 37.7 42.4
ICT services 100.0 100.0 100.0 100.0 : 100.0 : : 100.0 100.0 : 100.0 100.0 100.0 100.0 100.0
Class 51.43 6.3 5.9 4.3 : : 8.2 : : 9.0 4.8 : 7.9 14.2 1.7 6.0 4.9
Class 51.64 10.6 14.5 21.4 : : 8.5 : : 8.6 19.1 : 14.0 13.3 11.0 11.5 9.3
Class 51.65 15.9 22.8 21.2 : : 23.8 : : 6.1 19.8 : 22.0 23.8 22.9 15.8 12.4
Group 64.2 22.5 23.8 19.7 : : 22.4 : : 21.1 11.0 : 23.6 27.8 24.2 16.1 21.3
Division 72 44.7 33.0 33.4 : : 37.1 : : 55.3 45.3 : 32.5 20.9 40.2 50.6 52.2
ICT services 100.0 100.0 100.0 : : 100.0 : : 100.0 100.0 : 100.0 100.0 100.0 100.0 100.0
Class 51.43 84.4 84.1 100.9 : : 73.8 : : 69.3 47.0 : 92.8 55.5 94.3 93.5 83.3
Class 51.64 94.8 90.2 81.8 : : 65.9 : : 85.7 50.4 : 114.5 54.6 107.4 95.9 110.3
Class 51.65 80.8 82.9 82.3 : : 78.3 : : 79.7 78.0 : 89.3 49.7 96.0 88.7 91.3
Group 64.2 160.3 161.7 161.0 : : 209.6 : : 228.6 488.7 : 123.7 219.8 148.7 196.8 150.0
Division 72 79.9 74.5 86.7 : : 61.3 : : 60.5 41.4 : 85.5 57.3 71.1 74.5 81.4
ICT services 100.0 100.0 100.0 : : 100.0 : : 100.0 100.0 : 100.0 100.0 100.0 100.0 100.0
Turnover
Value added at factor cost
Number of persons employed
Apparent labour productivity (ICT services=100)
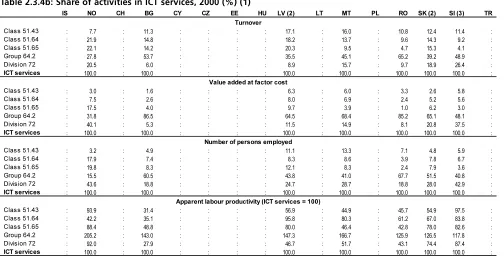
Table 2.3.4b: Share of activities in ICT services, 2000 (%) (1)
(1) For a list of NACE Divisions, Groups and Classes please refer to page 8. (2) 1998 for NACE Group 64.2, which also forms part of the ICT services total.
(3) Number of employees instead of number of persons employed (apparent labour productivity is also calculated on the basis of the number of employees); 1999. Source: Eurostat, structural business statistics (theme4/SBS/enterpr/enter_ms & enter_cc).
IS NO CH BG CY CZ EE HU LV (2) LT MT PL RO SK (2) SI (3) TR
Class 51.43 : 7.7 : 11.3 : : : : 17.1 : 16.0 : 10.8 12.4 11.4 :
Class 51.64 : 21.9 : 14.8 : : : : 18.2 : 13.7 : 9.6 14.3 9.2 :
Class 51.65 : 22.1 : 14.2 : : : : 20.3 : 9.5 : 4.7 15.3 4.1 :
Group 64.2 : 27.8 : 53.7 : : : : 35.5 : 45.1 : 65.2 39.2 48.9 :
Division 72 : 20.5 : 6.0 : : : : 8.9 : 15.7 : 9.7 18.9 26.4 :
ICT services : 100.0 : 100.0 : : : : 100.0 : 100.0 : 100.0 100.0 100.0 :
Class 51.43 : 3.0 : 1.6 : : : : 6.3 : 6.0 : 3.3 2.6 5.8 :
Class 51.64 : 7.5 : 2.6 : : : : 8.0 : 6.9 : 2.4 5.2 5.6 :
Class 51.65 : 17.5 : 4.0 : : : : 9.7 : 3.9 : 1.0 6.2 3.0 :
Group 64.2 : 31.8 : 86.5 : : : : 64.5 : 68.4 : 85.2 65.1 48.1 :
Division 72 : 40.1 : 5.3 : : : : 11.5 : 14.9 : 8.1 20.8 37.5 :
ICT services : 100.0 : 100.0 : : : : 100.0 : 100.0 : 100.0 100.0 100.0 :
Class 51.43 : 3.2 : 4.9 : : : : 11.1 : 13.3 : 7.1 4.8 5.9 :
Class 51.64 : 17.9 : 7.4 : : : : 8.3 : 8.6 : 3.9 7.8 6.7 :
Class 51.65 : 19.8 : 8.3 : : : : 12.1 : 8.3 : 2.4 7.9 3.6 :
Group 64.2 : 15.5 : 60.5 : : : : 43.8 : 41.0 : 67.7 51.5 40.8 :
Division 72 : 43.6 : 18.8 : : : : 24.7 : 28.7 : 18.8 28.0 42.9 :
ICT services : 100.0 : 100.0 : : : : 100.0 : 100.0 : 100.0 100.0 100.0 :
Class 51.43 : 93.9 : 31.4 : : : : 56.9 : 44.9 : 45.7 54.9 97.5 :
Class 51.64 : 42.2 : 35.1 : : : : 95.8 : 80.3 : 61.2 67.0 83.8 :
Class 51.65 : 88.4 : 48.8 : : : : 80.0 : 46.4 : 42.8 78.0 82.6 :
Group 64.2 : 205.2 : 143.0 : : : : 147.3 : 166.7 : 125.9 126.5 117.8 :
Division 72 : 92.0 : 27.9 : : : : 46.7 : 51.7 : 43.1 74.4 87.4 :
ICT services : 100.0 : 100.0 : : : : 100.0 : 100.0 : 100.0 100.0 100.0 :
Apparent labour productivity (ICT services = 100) Turnover
Value added at factor cost
[image:22.595.29.533.391.651.2]The term 'business demography' covers a range of indicators that describe the dynamic aspects of the population of enterprises. Enterprise demography is principally the assessment of enterprise births, deaths and survival rates, which together contribute to the number of active enterprises in each economy and activity. In other words, demography indicators measure the existing stock of active enterprises and the transformation of each cohort of enterprises.
Eurostat's business demography project currently relies upon a voluntary data collection exercise within the participating countries. Generally speaking the data were drawn from business registers, although some individual countries tried to improve the availability or freshness of their data on employment and turnover by integrating other sources. Note that the data coverage of the information presented for this sub-chapter, in terms of NACE activities, is different to that used for sub-chapters 2.1 to 2.3.
2. THE ICT SECTOR
19
2.4 ICT BUSINESS DEMOGRAPHY
Activities covered in sub-chapter 2.4
C to K Business economy
ICT sector (ICT manufacturing and ICT services) ICT manufacturing
30 Manufacture of office machinery and computers 31.3 Manufacture of insulated wire and cable
32 Manufacture of radio, television, and communication equipment and apparatus
33.2 Manufacture of instruments and appliances for measuring, checking , testing, navigating and other purposes 33.3 Manufacture of industrial process control equipment
ICT services
51.64 Wholesale of office machinery and equipment
64.2 Telecommunications
72 Computer and related activities
[image:23.595.72.564.498.739.2]Unless otherwise noted in tables or graphs, the ICT aggregates presented in sub-chapter 4 of this chapter cover the following activities
Table 2.4.1: Number of active enterprises (units), 1998
Source: Eurostat, structural business statistics (theme4/SBS/Bus_Demo).
BE DK DE EL ES FR IE IT LU NL AT PT FI SE UK NO
Business economy 482 817 245 762 : : 2 519 299 : : 3 596 450 20 797 507 531 : 711 485 235 617 475 625 1 678 575 200 528
ICT sector 11 715 10 572 : : : : : 84 453 : 20 197 : 5 472 7 280 24 507 145 815 6 487
ICT manufacturing 685 816 : : : : : 14 389 : 1 267 : 730 868 1 867 9 785 380
Division 30 146 183 : : 931 : : 1 277 : 367 : 51 90 451 2 110 61
Group 31.3 32 29 : : : : : 440 0 50 : 32 41 81 515 15
Division 32 320 303 : : 1 290 : : 9 575 : 407 : 470 422 642 3 490 167
Group 33.2 102 200 : : : : : 2 226 7 368 : 96 239 517 3 235 116
Group 33.3 85 101 : : : : : 871 3 75 : 81 76 176 435 21
ICT services 11 030 9 756 : : : : : 70 064 842 18 930 : 4 742 6 412 22 640 136 030 6 107
Class 51.64 2 046 1 691 : : : : : 5 928 255 4 557 : 1 424 1 214 3 182 3 390 1 771
Group 64.2 499 134 : : : : : 555 40 663 : 218 296 330 6 015 218
Division 72 8 485 7 931 : : 19 564 : : 63 581 547 13 710 : 3 100 4 902 19 128 126 625 4 118
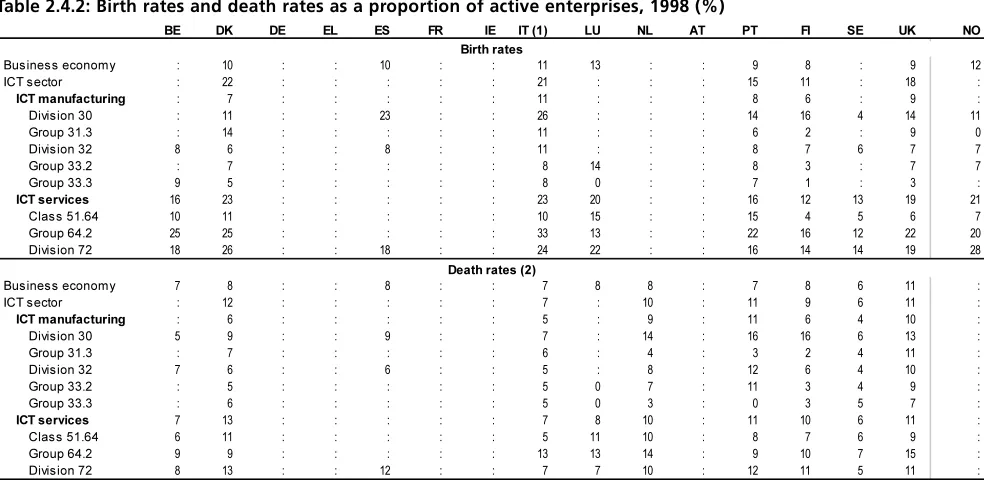
Table 2.4.2: Birth rates and death rates as a proportion of active enterprises, 1998 (%)
(1) IT, the quality of the 1998 data is affected by the re-integration into the business register of some units that had previously existed. (2) BE, DK, PT, FI, provisional data; LU, as of 1 January.
Source: Eurostat, structural business statistics (theme4/SBS/Bus_Demo).
BE DK DE EL ES FR IE IT (1) LU NL AT PT FI SE UK NO
Business economy : 10 : : 10 : : 11 13 : : 9 8 : 9 12
ICT sector : 22 : : : : : 21 : : : 15 11 : 18 :
ICT manufacturing : 7 : : : : : 11 : : : 8 6 : 9 :
Division 30 : 11 : : 23 : : 26 : : : 14 16 4 14 11
Group 31.3 : 14 : : : : : 11 : : : 6 2 : 9 0
Division 32 8 6 : : 8 : : 11 : : : 8 7 6 7 7
Group 33.2 : 7 : : : : : 8 14 : : 8 3 : 7 7
Group 33.3 9 5 : : : : : 8 0 : : 7 1 : 3 :
ICT services 16 23 : : : : : 23 20 : : 16 12 13 19 21
Class 51.64 10 11 : : : : : 10 15 : : 15 4 5 6 7
Group 64.2 25 25 : : : : : 33 13 : : 22 16 12 22 20
Division 72 18 26 : : 18 : : 24 22 : : 16 14 14 19 28
Business economy 7 8 : : 8 : : 7 8 8 : 7 8 6 11 :
ICT sector : 12 : : : : : 7 : 10 : 11 9 6 11 :
ICT manufacturing : 6 : : : : : 5 : 9 : 11 6 4 10 :
Division 30 5 9 : : 9 : : 7 : 14 : 16 16 6 13 :
Group 31.3 : 7 : : : : : 6 : 4 : 3 2 4 11 :
Division 32 7 6 : : 6 : : 5 : 8 : 12 6 4 10 :
Group 33.2 : 5 : : : : : 5 0 7 : 11 3 4 9 :
Group 33.3 : 6 : : : : : 5 0 3 : 0 3 5 7 :
ICT services 7 13 : : : : : 7 8 10 : 11 10 6 11 :
Class 51.64 6 11 : : : : : 5 11 10 : 8 7 6 9 :
Group 64.2 9 9 : : : : : 13 13 14 : 9 10 7 15 :
Division 72 8 13 : : 12 : : 7 7 10 : 12 11 5 11 :
Birth rates