https://doi.org/10.3168/jds.2016-12172
© 2018, THEAUTHORS. Published by FASS Inc. and Elsevier Inc. on behalf of theAmerican Dairy ScienceAssociation®.
This is an open access article under the CC BY-NC-ND license (http://creativecommons.org/licenses/by-nc-nd/3.0/).
ABSTRACT
Time constraints for dairy farmers are an important factor contributing to the under-detection of lameness, resulting in delayed or missed treatment of lame cows within many commercial dairy herds. Hence, a need exists for flexible and affordable cow-based sensor systems capable of monitoring behaviors such as time spent feeding, which may be affected by the onset of lameness. In this study a novel neck-mounted mobile sensor system that combines local positioning and activity (acceleration) was tested and validated on a commercial UK dairy farm. Position and activity data were collected over 5 consecutive days for 19 high-yield dairy cows (10 lame, 9 nonlame) that formed a subset of a larger (120 cow) management group housed in a freestall barn. A decision tree algorithm that included sensor-recorded position and accelerometer data was developed to classify a cow as doing 1 of 3 categories of behavior: (1) feeding, (2) not feeding, and (3) out of pen for milking. For each classified behavior the mean number of bouts, the mean bout duration, and the mean total duration across all bouts was determined on a daily basis, and also separately for the time periods in between milking (morning = 0630–1300 h; afternoon = 1430–2100 h; night = 2230–0500 h). A comparative analysis of the classified cow behaviors was undertaken using a Welch -test with Benjamini-Hochberg post-hoc t correction under the null hypothesis of no differences in the number or duration of behavioral bouts between the 2 test groups of lame and nonlame cows. Analysis showed that mean total daily feeding duration was sig-nificantly lower for lame cows compared with non-lame cows. Behavior was also affected by time of day with
significantly lower mean total duration of feeding and higher total duration of nonfeeding in the afternoons for lame cows compared with nonlame cows. The results demonstrate how sensors that measure both position and acceleration are capable of detecting differences in feeding behavior that may be associated with lame-ness. Such behavioral differences could be used in the development of predictive algorithms for the prompt detection of lameness as part of a commercially viable automated behavioral monitoring system.
Key words: local positioning, 3D accelerometer, lameness, feeding behavior, dairy cow
INTRODUCTION
The welfare and economic implications of lameness on dairy farms are well documented (Whay et al., 1998; Willshire and Bell, 2009). It has been demonstrated that the prompt treatment of dairy cows reduces the severity of claw horn lesions and the number of repeat treatments required (Leach et al., 2012), therefore reducing the treatment costs and financial losses to the farmer and reducing duration and severity of pain for the cow. Ensuring cows with the early stages of lameness are recognized and then treated remains a challenge, as farmers are known to underestimate the prevalence of lameness on their farms (Leach et al., 2010) and identify and treat cows later than researchers (Leach et al., 2012).
To encourage improved detection of lameness by farmers, the Agriculture and Horticulture Development Board (AHDB) Dairy Mobility Score was developed in 2007 by a panel of UK dairy industry representa-tives and promoted as a management tool for lameness (AHDB, 2017). The most effective use of mobility scor-ing requires farm staff to watch all cows on a regular basis (e.g., once every 1–2 wk), but due to the time constraints farmers are often reluctant to complete the
Use of novel sensors combining local positioning and acceleration
to measure feeding behavior differences associated
with lameness in dairy cattle
Z. E. Barker,*1 J.A. Vázquez Diosdado,†‡ E.A. Codling,‡ N. J. Bell,§ H. R. Hodges,* D. P. Croft,# and J. R.Amory*
*Writtle University College, Lordship Road, Chelmsford, Essex, CM1 3RR, UK
†School of Veterinary Medicine and Science, University of Nottingham, Sutton Bonington Campus, Sutton Bonington, LE12 5RD, UK ‡Department of Mathematical Sciences, University of Essex, Wivenhoe Park, Colchester, CO4 3SQ, UK
§Bos International Ltd., Smugglers Lane, Colehill, Wimbourne, Dorset, BH21 2RY, UK
#Center for Research inAnimal Behaviour, College of Life and Environmental Sciences, University of Exeter, Exeter, EX4 4QG, UK
Received October 18, 2016. Accepted March 13, 2018. 1
task as frequently as required due to other conflicting priorities (Horseman et al., 2014). As such, a need ex-ists for systems that can automatically detect lameness at an early stage without the need for time-consuming observations. Several studies have reported lame cows showing changes to both feeding and lying behavior. Lame cows are slower to respond to food being made available (Blackie et al., 2011; Yunta et al., 2012) and feed faster, although for a reduced overall duration per day (González, 2008; Palmer et al., 2012; Norring et al., 2014). Lameness in dairy cows is also associated with changes in lying behavior, although these results are more equivocal (increased lying: Singh et al., 1993; Galindo and Broom, 2002; Blackie et al., 2011; no dif-ference: Ito et al., 2010; Yunta et al., 2012; decreased lying: Cook et al., 2008). Therefore, automated moni-toring of individual cow behaviors may potentially offer the opportunity for the early detection of lameness.
Recent attempts to use automated systems to detect lameness have generally relied upon the identification of abnormal gait using load cells, pressure-sensitive mats, computer vision, or accelerometers (reviewed by Van Nuffel et al., 2015). Automated monitoring and assessment of feeding behavior in cattle has relied on electronic feed troughs (Palmer et al., 2012; Norring et al., 2014), which are uncommon on commercial dairy units due to installation costs. Triaxial accelerometers are embedded in several commercial dairy applications for the detection of estrus activity and other behav-iors (Silper et al., 2015), and have been used to detect changes in lying and standing behavior associated with lameness (e.g., Blackie et al., 2011; Navarro et al., 2013). Accelerometers have also been used to classify and monitor changes in rumination and feeding activ-ity (Van Hertem et al., 2013; Vázquez Diosdado et al., 2015; Mattachini et al., 2016).
Several studies have employed sensor systems to mon-itor the location of dairy cattle using different methods including GPS for pasture-based animals (Williams et al., 2016) and various real-time location system (RTLS) radio frequency-based technologies for indoor sensing (Gygax et al., 2007; Alarifi et al., 2016; Shane et al., 2016; Meunier et al., 2017). Although validated for use on farms (e.g., Tullo et al., 2016), very few stud-ies have examined at the application of these systems in dairy management or combined RTLS location data with activity data recorded from accelerometers. Arci-diacono et al. (2017) reported the potential for RTLS to detect estrus in dairy cows and suggested that other applications might include monitoring disease or verify-ing the welfare status of cows.
Automated classification of cow behavior typically requires some form of processing of the raw location or accelerometer data using a statistical or computational
procedure (machine-learning techniques). For example, Martiskainen et al. (2009) developed a method that uses multiclass support vector machines to automati-cally classify accelerometer data into several types of dairy cow behavior, but the support vector machines algorithm has a large computational cost. Robert et al. (2009) implemented a more computationally efficient rule-based decision tree algorithm to classify different behaviors in cattle, although they could not classify feeding behavior due to the use of a leg-mounted ac-celerometer. Vázquez Diosdado et al. (2015) developed a simple rule-based decision tree for classifying accel-erometer data, collected using the same neck-mounted sensors used in the current study, and found that feed-ing behavior could be identified with high acceleration due to the lifting and lowering of the head. However, Vázquez Diosdado et al. (2015) did not directly con-sider how location data could be combined with the ac-celerometer data to improve the classification of feeding and other types of behavior.
The aim of the current study was to assess the ca-pability of a novel real-time location sensor and com-bined accelerometer to measure potential differences in behavior (specifically total feeding duration, feeding bout length, and number of feeding bouts) for lame and nonlame cows within a freestall housing environment.
MATERIALS ANDMETHODS
Study Farm and Selection ofAnimals
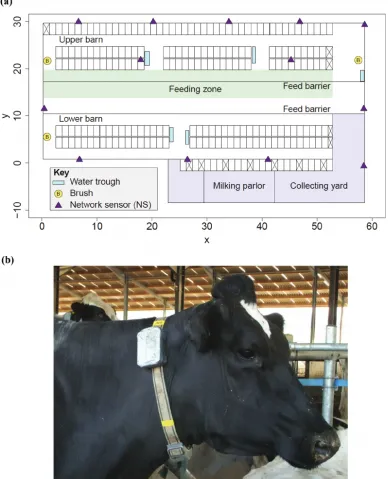
All experimental work was undertaken in a freestall barn on a commercial UK dairy farm measuring 30 × 58 m, which housed approximately 210 cows in 2 (high and low yield) groups separated by a central feed alley (Figure 1a). The high-yield group consisted of 120 cows with access to 120 freestalls and feed space of 0.43 m/ cow in the upper barn area (Figure 1a). The lower-yield group consisted of 90 cows with access to 90 freestalls and feed space of 0.58 m/cow in the lower barn area (Figure 1a). All cows were pedigree Holstein with a herd average 305-d yield of 11,000 L/cow. Cows were milked 3 times a day (0500, 1300, and 2100 h) and were fed a commercial TMR. Feed was delivered once per day (ready for cows returning from morning milking) and pushed up a further 4 to 5 times throughout the day. All cows received a corrective claw trim in the first 60 d of lactation by a contract claw trimmer who visited the farm approximately every 6 wk.
Two separate cohorts of cows were selected for the purpose of this study. A small trial cohort of 9 cows from the high-yielding group were used for the validation of sensor position (Supplemental File S1;
pro-vide position and acceleration data for the training of the decision tree behavioral classification algorithm. These cows were randomly selected as they exited the milking parlor, but cows with poor locomotion were not selected (i.e., selected cows did not have an immediately obvious limp or shortening of gait).
[image:3.595.93.481.79.558.2]Once selected, cows were immediately diverted into the handling area and fitted with a collar before re-turning to the freestall house. Selection took place at afternoon milking and observations commenced after morning milking the following day to allow time for acclimatization to the collar. The neck collars were
Figure 1. (a) Schematic map of the freestall barn used within the study. The main trial was undertaken in the upper barn area using the
similar to numerous commercial heat monitoring devices worn by cattle (Figure 1b) and had minimal effect on behavior after the first few minutes of being worn. The 9 cows selected for the trial cohort were not subsequently used in the main cohort study.
In the main cohort study the objective was to compare feeding behavior for lame and nonlame cows; 20 cows were selected. All cows in the high-yield group were first locomotion scored using the AHDB Dairy Mobility Score [a 4-point score where 0 = good mobility (not lame), 1 = imperfect mobility, 2 = impaired mobility (lame), and 3 = severely impaired mobility (severely lame); AHDB, 2017] at the exit of the parlor (20/40 swing-over herringbone parlor) by a single researcher (Z. Barker). A short list of 34 score-0 (nonlame) and 13 score-2 (lame) cows that, according to farm records, had not had any health issues in the previous 3 mo (including claw lesions and mastitis) were then rescored for mobility by a second researcher (H. Hodges) the next morning to eliminate any scoring errors. Score-1 cows (imperfect mobility) were not taken forward for use in the trial, as these cows had potentially ambigu-ous mobility scores and may have been in the early stages of lameness or in the process of recovery. Score-3 cows (severely impaired mobility) were also not used because they were too few in number. Ten cows of score 2 (lame) remained, to which 10 score-0 cows (nonlame) were selected as matched pairs for DIM, yield and par-ity. The lame group versus nonlame group figures, re-spectively, were DIM (113 ± 18.7 vs. 139 ± 15.7, mean ± SE), mean 305-d yield (12,397 ± 549 vs. 11,523 ± 587), and parity [3.5 (3.5–5) vs. 3.0 (2.0–3.5), median and interquartile range].
The 20 selected cows in the main cohort were all fitted with weighted neck collars (Figure 1b) on which mobile sensors were mounted during the 1300-h milk-ing and then returned to the freestall pen. Observa-tions of behavior began the following day to ensure no effect of the collar being fitted on behavior. Position and acceleration data were logged by the sensors for 5 consecutive days. The full data set initially consisted of 100 cow-days available for behavioral analysis (where a cow-day corresponds to a single day of data for an individual cow). However, 9 of these cow-days were excluded from the data set due to signal loss from the mobile sensors after exiting the milking parlor. Four of these excluded cow-days belonged to a single nonlame cow; thus, she was removed entirely from subsequent analyses. In addition, data from 7 further partial cow-days, corresponding to a period between the end of night milking, 2100 h, and the start of morning milking, 0500 h, were also excluded due to some mobile sensors becoming frozen (recorded at the same position)
follow-ing the system restart, which occurred at midnight each night. These exclusions represented a total data loss of 11.3% of the possible 100 cow-days.
Three days after the data collection period, the hooves of the cows enrolled in the main cohort study were trimmed using the Dutch 5-step method (Toussaint-Raven, 2003) by a vet holding a professional National Proficiency Tests Council level 3 claw trimming qualifi-cation (N. Bell). Trimming revealed that 8 of the lame cows had claw horn lesions commonly associated with lameness (i.e., sole ulcer or white line disease) and the remaining 2 had moderate digital dermatitis, which is known to affect locomotion in an inconsistent manner (Pastell et al., 2010). Of the nonlame cows, 8 had no claw horn lesions or skin lesions, as expected, whereas 2 of the nonlame cows had mild cases of white line disease. To ensure no effects of the lame cows with digi-tal dermatitis and the nonlame cows with lesions, the collected position and acceleration data were analyzed both with and without these cows. The differences be-tween lame and nonlame cows were similar for both sets of analyses, so only the analyses including all cows are presented in Results.
Sensor Deployment and Collection of Position
and AccelerationData
Position and acceleration data for each cow was col-lected using a novel wireless sensor system (Omnisense Series 500 Cluster Geolocation System, Omnisense Ltd., Elsworth, UK). Sensors within the system were defined in 2 ways based on how they were configured, but were otherwise identical in functionality. Thirteen network sensors (NS) were configured in the system to be immobile and were fixed at known locations in the freestall barn and collecting yard, as shown in Figure 1a, to ensure as wide coverage as possible. Mobile sensors (MS), which were configured to be able to move and had no predefined position, were mounted in weighted neck collars worn by the selected cows (Figure 1b). The relative local position in (x, y) coordinates of each mo -bile sensor was triangulated by measuring the arrival time of periodic messages (every 8 s in this study) sent from each mobile sensor to each other sensor (MS and NS) in the system.
details and results are given in Supplemental File S1;
https://doi.org/10.3168/jds.2016-12172). The circular
error of probability (CEP) is defined as the radius of a circle, centered on the mean location, in which 50% of all recorded locations lie, and is hence a measure of the precision of a location sensor. For selected static locations around the barn, the mean CEP was found to be 1.07 m (range = 0.64–2.41 m), which compares favorably to the commercially advertised CEP specifi-cation of 1 m by Omnisense Ltd. The mean distance between the known ground truth location and the sensor-derived location (DIST) measures the accuracy of the sensor system and was found to be 2.66 m (range = 0.57–5.95 m) for selected static locations around the barn. This is slightly higher than the commercially advertised specification (95% of measurements within 2 m of ground truth; Omnisense Ltd.) and is likely due to the unfavorable barn environment with large metal features disrupting the sensor signals. The measured CEP and DIST were found to be higher when the MS was mounted on a cow (compared with a fixed static object) and was higher on feeding or lying cows (mean CEP = 2.7 m for feeding and lying; mean DIST = 4.4 m for feeding and 5.6 m for lying) compared with standing cows (mean CEP = 1.9 m, mean DIST = 2.8 m; see Supplemental File S1, Table S1). Nevertheless, this level of accuracy was considered sufficient for the purposes of identifying cows within the feeding and milking zones given the large relative size and loca-tion of these areas within the overall barn (Figure 1a). Accuracy of the cow-mounted MS data could not be improved through postprocessing. However, to improve precision, the raw position data derived from the cow-mounted MS was smoothed to remove outliers using a simple moving average over a 2-min moving window (which corresponds to 15 data points at the 8-s sam-pling rate).
In addition to determining local position, each cow-mounted MS also included an embedded triaxial accel-erometer (Xtrinsic MMA8451Q 3-Axis, 14-bit/8-bit Digital Accelerometer with a sensitivity between −8 g and +8 g; NXP Semiconductors, Eindhoven, the Neth-erlands). Raw triaxial accelerometer data were sampled at a frequency of 12.5 Hz. The total magnitude of the raw acceleration was , where ai, i=
x,y,z, is the acceleration in each of the corresponding axes. The raw dynamic component of this acceleration, which is caused only by the movement of the animal, was obtained by removing the gravity constant ( = g 9.81 m/s) from a using a finite impulse response fil -ter with a cutoff frequency of 1 Hz. A summary dy-namic acceleration statistic was then calculated by taking the mean value of the raw dynamic acceleration
over the same 8-s sampling rate used for determining local position.
Decision TreeAlgorithm for Classification
of Cow Behavior
An unsupervised decision tree algorithm was designed and implemented to classify the sensor collected posi-tion and acceleraposi-tion data into cow behavior categories (feeding, nonfeeding, and out of pen for milking). A decision tree is a type of machine-learning algorithm that uses a set of logical decision rules to classify input data into different types (Robert et al., 2009; Vázquez Diosdado et al., 2015). With any such machine-learning algorithm it is important to develop and train the algorithm using a different data set to that used for validation and testing performance. Hence the algo-rithm data collected from the trial cohort (9 cows) was used for training, and the performance of the algorithm data were collected for testing from the main cohort (20 cows) at 5 different observation sessions. Based on exploration of the training data set (9 cows), the follow-ing decision tree algorithm was developed.
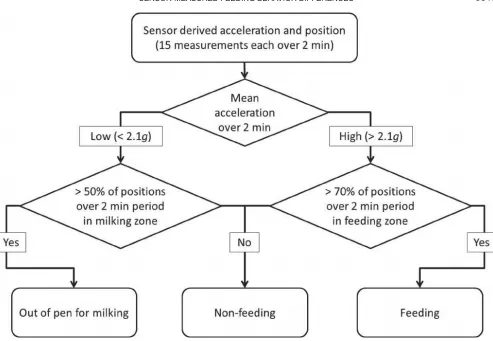
The decision-tree algorithm was based on a 2-stage decision process (Figure 2) that uses acceleration and position data recorded by the cow-mounted MS and measured over a 2-min time period. In the first stage of the decision tree the mean acceleration over the 2-min period (mean of 15 measurements of the summary dy-namic acceleration statistic using a sampling rate of 8 s) was considered. If the mean acceleration was greater than or equal to 2.1 , behavior was classified as high g activity, otherwise it was classified as low activity. In the second stage of the decision tree, the recorded posi-tions were used to classify the high and low activity into specific behavior categories. If the cow was clas-sified as high activity in the first stage, the behavior was classified as feeding if more than 70% of recorded positions within the 2-min period occurred within the feeding zone (Figure 1a). If less than 70% of recorded positions occurred within the feeding zone, the activity was classified as nonfeeding. Similarly, if the cow was classified as low activity in the first stage of the deci-sion tree and more than 50% of the recorded positions within the 2-min period occurred within the milking zone (milking parlor and collecting yard, Figure 1a), then the behavior was classified as out of pen for milk-ing, otherwise it was classified as nonfeeding.
observations were not possible for all cows; thus, the behavior of the 20 animals was recorded using instan-taneous scan sampling once every 20 min. Observed ac-tivity was classified as lying (recumbent in a freestall), feeding (at feed bunk ingesting food), standing (stand-ing and stationary), walk(stand-ing (mov(stand-ing from one area of the freestall barn to another), drinking (at water trough taking in water), or other. The data from these 20-min windows were split into ten 2-min bouts and the corresponding decision tree-classified behavior for each 2-min bout was compared with the activity recorded for the scan of the barn for that 20-min window. A period of 25 min during which all cows were known to be out of the freestall barn in the milking areas was used to validate the decision tree classification of out of the pen for milking. The number of true positive (TP), true negative (TN), false positive (FP), and false negative (FN) behavior classifications were calculated for each
behavior (feeding, nonfeeding, and out of pen for milk-ing). Standard performance measures were calculated for accuracy [defined as TP + TN/(TP + FP + FN + TN)], precision [or positive predictive value; defined as TP/(TP + FP)], sensitivity [defined as TP/(TP + FN)], and specificity [defined as TN/(FP + TN)].
StatisticalAnalysis of Behavior of Lame
and Nonlame Cows
[image:6.595.63.556.63.404.2]The overall daily behavior was described for each cow in terms of the number and duration of feeding and nonfeeding bouts and the total duration of feeding and nonfeeding behavior (the sum of the relevant bout durations). In addition, the bout duration and total duration of behavior categorized as out of the pen for milking was also calculated (there were always 3 daily milking bouts). A mean daily value was then calculated
Figure 2. Flowchart depicting the 2-stage decision-tree algorithm used for the classification of feeding, nonfeeding, and behavior categorized
for each behavioral measure for each cow by taking the mean average over the 5 d of the study. To explore the possible effect of the time of day on behavioral differences, a similar analysis was also completed for the mean number and mean duration of feeding and nonfeeding bouts for the time periods between milking events: morning, afternoon, and night.
The effect of lameness on sensor-recorded behavioral categories (total daily feeding duration, number of feed-ing bouts, feedfeed-ing bout duration for the total whole day and for the morning, afternoon and night time periods plus the mean daily bout duration, and mean total duration of milking) was tested using a 2-sided Welch 2-samplet-test. The Welch -test does not assume equal t variance between the 2 samples and is hence considered more robust than the standard Student’s -test, and t is also valid at small sample sizes (although may have limited power) as long as the underlying assumption of normality is not violated. A Shapiro-Wilk normal-ity test was used to validate this assumption for each behavioral measure; 3 behavioral measures failed, so a nonparametric Wilcoxon rank-sum test was instead used to test for differences between the 2 groups (daily mean duration of bouts of nonfeeding, mean duration of bouts of nonfeeding in afternoon, mean duration of bouts of feeding in morning).
Testing multiple hypotheses about behavioral differ-ences increases the risk of a significant result appearing as a false positive. To control for these possible false-positive results the Benjamini-Hochberg procedure (Benjamini and Hochberg, 1995) was applied to the combined set of 26 test results for the behavioral mea-sures considered. The Benjamini-Hochberg procedure applies more stringent criteria to the observed P-values for results to be considered significant (Supplemental File S2; https://doi.org/10.3168/jds.2016-12172). The false discovery rate of the test is defined by the user and a conservative value of 5% ( = 0.05) was chosen q for this study. All data analysis was undertaken using the R statistical package (R Core Team, 2017).
RESULTS
Performance of Decision TreeAlgorithm
for Behavioral Classification
Feeding behavior was classified by the decision tree algorithm with high overall accuracy (83.2%), precision (83.5%), and specificity (93.0%) and moderate sensitiv-ity (65.3%). Nonfeeding behavior was classified with high overall accuracy (80.8%), precision (93.9%), and specificity (91.3%) and moderate sensitivity (74.9%). Behavior categorized as out of the pen for milking was
classified with very high accuracy (94.2%), sensitivity (95.6%), and specificity (94.0%) but lower precision (59.9%).
Behavioral Differences Between Lame and Nonlame Cows
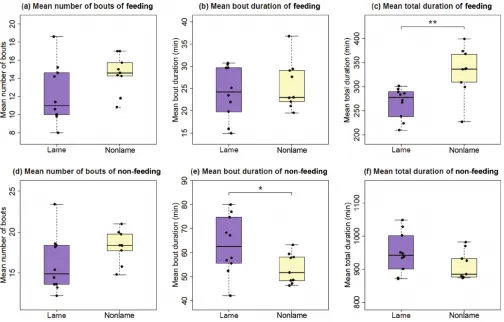
Figure 3 shows the mean number, mean duration, and mean daily total duration of feeding and nonfeed-ing bouts (each data point is the mean average over the 5 d of the study for each cow), together with box-and-whisker plots for each behavioral measure considered. A tendency for lame cows to have higher mean daily number of feeding bouts compared with nonlame cows was observed (P = 0.089; Figure 3a), but we found no effect of lameness on mean bout duration of feeding be-havior ( = 0.56; Figure 3b). In contrast, a statistically P significant difference in the mean daily total duration of feeding was observed (P = 0.005), with nonlame cows feeding for much longer in total over the day than lame cows (Figure 3c). We observed no effect of lameness on the mean daily number of bouts of nonfeeding (P = 0.115; Figure 3d). The mean nonfeeding bout dura-tion was higher for lame cows than for nonlame cows (Figure 3e), and this difference was initially found to be statistically significant (P = 0.043). However, after the Benjamini-Hochberg correction was applied (Supple-mental File S2, Table S2; https://doi.org/10.3168/jds .2016-12172), this was considered likely to be a false-positive result under the more stringent criterion. We observed no effects of lameness on the mean daily total duration of nonfeeding behavior (P = 0.243; Figure 3f) or on the mean daily bout duration ( = 0.595; SuppleP -mental File S3, Figure S2a, https://doi.org/10.3168/
jds.2016-12172) and mean daily total duration (P =
0.524; Supplemental File S3, Figure S2b) of behavior categorized as out of the pen for milking.
Figure 4 shows the number and duration of feeding and nonfeeding bouts for separate time periods of the day (morning, afternoon, and night), whereas group-level summary statistics and all -values are given in P Supplemental File S3, Tables S3 and S4 (https://doi
.org/10.3168/jds.2016-12172). We found no effect of
(Figure 4e) was observed to be higher for lame cows than for nonlame cows in the afternoon ( = 0.027) and P the night ( = 0.048). However, both these results were P considered likely to be false positives when the more stringent Benjamini-Hochberg correction was applied (Supplemental File S2; https://doi.org/10.3168/jds
.2016-12172). Total duration of nonfeeding was higher
for lame cows than for nonlame cows in the afternoon (P = 0.004).
DISCUSSION
We demonstrated how a novel real-time local posi-tioning and activity monitoring system, which combines radio time-of-arrival measurements for location with accelerometer information, can be used to determine behavioral differences between lame and nonlame dairy cows. A 2-stage decision tree algorithm was designed that gave accurate classification of combined sensor
position and acceleration data into feeding, nonfeeding, and behavior categorized as out of the pen for milking. Analysis of the classified behavior for our study cohort highlights differences in feeding activity, with feeding duration being significantly lower for lame cows than nonlame cows. The results highlight how automated collection of behavioral data, via a combined position and activity sensor, could potentially form part of an on-farm health and welfare monitoring tool.
[image:8.595.59.563.313.635.2]The main result of our study, that lame cows have significantly shorter total feeding duration (Figure 3), is in agreement with findings reported in existing stud-ies (González et al., 2008; Palmer et al., 2012; Norring et al., 2014). It was not possible to directly measure feed intake during our study, and hence it is not pos-sible to determine whether lame cows were eating less than nonlame cows or the same amount but at a faster rate as described in these earlier studies. An increased rate of feeding in lame cows may reflect these animals
Figure 3. (a–f) Box and whisker plots indicating the daily mean number of bouts, the daily mean bout duration, and the daily mean total
duration of feeding and nonfeeding behavior calculated over all 5 d of the study for the 10 lame (purple) and 9 nonlame (yellow) cows in the main trial. In each subfigure, the boxplots highlight, respectively, the median and upper and lower quartiles of each of the lame and nonlame groups, whereas the dots indicate the individual data points corresponding to each cow. Box whiskers extend to the most extreme nonoutlier data points above and below the box; data points are considered outliers if they lie more than 1.5 times the interquartile range from the edge of the box. *Denotes significance at the 0.05 level from Welch -test, but considered as false positive after Benjamini-Hochberg procedure applied. **Denotes t
reducing time spent in potential confrontation at the feed bunk; lame cows are less likely to start an aggres-sive interaction (Galindo and Broom, 2002). Lameness is a painful condition (Whay et al., 1998) and lame cows will redistribute their weight (Neveux et al., 2006) or increase their time spent lying (Blackie et al., 2011) to reduce discomfort; these are possible reasons that may also explain the current findings.
Differences associated with lameness were more ap-parent during the day, with significantly lower feeding times and higher nonfeeding times in the afternoon and a nonsignificant trend for reduced feeding duration in the morning for lame cows compared with nonlame cows (Figure 4). We noted reductions in feeding be-havior overnight compared with morning and afternoon (Figure 4), which agrees with the results of DeVries et al. (2003) and Wagner-Storch and Palmer (2003); how-ever, this in contrast to the findings of Nechanitzky et al. (2016), who reported a trend for lame cows to have a shorter feeding time at night and lying for over an hour longer than nonlame cows. The cows in the cur-rent study were in a larger group (120 vs. 40) and had been subject to less mixing than those in a previous study (Nechanitzky et al., 2016). A lack of difference
between lame and nonlame cows for the night period in our study may be explained by reduced competition for feed barrier space at this time, allowing lame cows sufficient space to feed normally.
The total time spent feeding per day in our study was similar to the mean figure of 258 min/d reported by Gomez and Cook (2010) for herds with a mean milk yield of 10,500 L. Lower figures have been reported in other studies (104 min/d, Norring et al., 2014; 171 min/d, Miekley et al., 2013; and 172 min/d, Palmer et al., 2012), but typical milk yields are not reported. Norring et al. (2014) did report a predominance of the Ayrshire breed, so it would be reasonable to assume that the yields for these animals, and therefore their nutritional requirements, were significantly lower ex-plaining the lower overall feeding times.
[image:9.595.32.536.69.326.2]Lame cows are known to be more likely to be found in the last third of the milking (Main et al., 2010) and also take longer to return from the milking parlor (Juarez et al., 2003). Therefore, we expected that the duration of the period out of the pen for milking would be longer for lame cows than nonlame cows, as the animals maintained lying behavior for longer. However, we found no significant difference in the time out of
Figure 4. Box and whisker plots indicating the mean number of bouts, the mean bout duration, and the mean total duration of feeding
(a–c) and nonfeeding (d–f) behavior, calculated for different time periods of the day (morning = 0630–1300 h; afternoon = 1430–2100 h; night: 2230–0500 h) for the 10 lame (purple) and 9 nonlame (yellow) cows in the main trial. In each subfigure the boxplots highlight, respectively, the median and upper and lower quartiles of each of the lame and nonlame groups, whereas the dots indicate the individual data points correspond-ing to each cow. Box whiskers extend to the most extreme nonoutlier data points above and below the box; data points are considered outliers if they lie more than 1.5 times the interquartile range from the edge of the box. †Denotes a statistical trend (P = 0.05); *denotes significance at the 0.05 level from Welch -test, but considered as false positive after Benjamini-Hochberg procedure applied; **denotes significance at the 0.05 t
the freestall barn during the milking period between lame and nonlame cows. Normal management practice on the farm was to raise lying cows from freestalls to join the milking group, and lame cows may not have had the opportunity to lie for longer even if motivated to do so.
The precision and accuracy of the sensor-recorded position data in our study were similar to those re-ported by Huhtala et al. (2007), and we similarly found a reduction in accuracy for cow-mounted sensors when compared with network sensors (Supplemental File S1;
https://doi.org/10.3168/jds.2016-12172). The accuracy
and precision of the sensor-recorded position in our study (Supplemental File S1, Table S1) were relatively large (greater than 2.8 m when worn by a cow) com-pared with the dimensions of the freestalls on this farm (1.2 × 2.5 m); hence, it was not possible to specify if the nonfeeding behaviors were occurring in a freestall or in other specific areas of the barn. Variations in ac-curacy result from metal structures within the housing disrupting the radio waves and therefore affecting the time of arrival of the signals on which the position al-gorithms are based. Sensors fixed in locations where the antenna faced toward a nearby metal object (e.g., the feed barrier) could produce very low accuracy (i.e., distance from the known position), but with accept-able precision. Although accuracy may not be sufficient to allocate cows to a specific freestall, the larger-scale monitoring of patterns of space use within the housing environment are possible, and therefore detection of changes in space use over time associated with onset of lameness or other production diseases should still be possible.
The decision tree algorithm (Figure 2) was able to classify feeding and nonfeeding behavior with high accuracy, precision, and specificity (all greater than 80%). The moderate sensitivity for classification of feeding and nonfeeding behavior may have been due to the necessary assumption that cows maintained a single behavior for the 20-min window represented by the instantaneous scan sample. Standing, lying, and feeding bouts are generally much longer than this in duration, as reported here and previously; for example, Blackie et al. (2011) reported lying and standing bouts averaged greater than 60 min, similar to Hart et al. (2014), who also reported average feeding bouts ex-ceeding than 24 min for primi- and multiparous cows. However, it is possible that changes in activity during these periods resulted in misclassification within the decision tree algorithm. Behavior categorized as out of the pen for milking was classified by the decision tree with very high accuracy, sensitivity, and specificity (all over 94%), but with a much lower figure of 59% for precision. This low precision is likely due to false
posi-tives, where cows were erroneously classified as out of the pen for milking because of sensor errors leading to positions being recorded in the collecting yard (part of the milking zone) when they were actually in the main barn area (Figure 1a). It is also possible that cows had periods of high activity while in the milking zone, which caused them to exceed the acceleration threshold for categorization as being out of the pen for milking and, as a result, be misclassified as nonfeeding (Figure 2). A more detailed observation of the activity levels and behaviors of the cows in the collecting yards and in the parlor would be beneficial for future training and validation of algorithms for the classification of activi-ties corresponding to being out of the pen for milking. However, it was not logistically possible in the current study to observe the activity of an entire milking group (n >120), rather than the small sample studies reported recently in other studies (n = 8 in Porto et al., 2014; n = 5 in Tullo et al., 2016) that use only position rather than actual behavior to validate activity. Nevertheless, there is no reason to believe that any misclassification of behavior by the decision tree algorithm would be more likely for either of the lame or nonlame groups of cows; hence, the main results of our study (where we highlight significant differences in feeding) are unlikely to be affected.
It was not possible in our study to classify nonfeed-ing behavior more specifically into either standnonfeed-ing or lying behaviors due to the neck-mounted position of the sensors. One future possibility to overcome this problem is the use of a suite of multiple sensors to im-prove behavioral classification (Brown et al., 2013). For example, an additional sensor type in the same body location (e.g., rumination audio sensor, magnetometer) or an additional accelerometer in an alternative body location (e.g., leg mounted) would likely be needed to accurately classify the 3 main behaviors of interest in dairy cows (lying, standing, and feeding). The ability to separate standing, lying, and other behaviors from the nonfeeding category may be beneficial given the reported changes in lying behavior associated with lameness (Singh et al., 1993; Galindo and Broom, 2002; Cook et al., 2008; Blackie et al., 2011); however, to date, these results have been less consistent than those reported for feeding behavior.
over-interpreting this result. Nevertheless, an observed reduction in feeding behavior could potentially be used as one element of a suite of indicators for detection of lameness (Van Hertem et al., 2013). An automated data collection and analysis system that can provide such information would be highly useful as a general on-farm early warning of possible health and welfare issues in individual cows. Any warning indicators that arise would then be followed by targeted direct inspec-tion of specific animals.
CONCLUSIONS
This study used a novel neck-mounted combined accelerometer and location sensor to monitor the movement and behavior of dairy cows housed within a freestall barn. A 2-stage decision tree algorithm was used to accurately classify the sensor-recorded accel-eration and location data into feeding, nonfeeding, and milking behaviors. Statistical analysis of the classified behavior highlighted significant differences in feeding behavior associated with lameness, with lame cows feeding for less time in the afternoon and in total over a full day. These results could potentially contribute to the development of automated monitoring and de-tection systems that enable the prompt dede-tection and treatment of lameness in dairy cattle.
ACKNOWLEDGMENTS
The authors acknowledge the technical support of Omnisense Ltd. (Elsworth, UK) throughout the collec-tion of the sensor derived data and the contribucollec-tions of the staff and owners of the participating study farm. This study is supported by the UK Biotechnology and Biological Sciences Research Council (Wiltshire, UK) thorough grants BB/K002562/1 (EC & JVD), BB/ K002376/1 (JA & ZB), BB/K001302/1 (DC), BB/ K003070/1 (NB). H. Hodges was supported by the Co-lin Spedding Memorial Research Studentship awarded by The Farm Animal Welfare Trust (UK).
REFERENCES
AHDB. 2017. Mobility scoring. https://dairy.ahdb.org.uk/technical -information/ animal -health -welfare/ lameness/ husbandry -prevention/mobility-scoring
Alarifi, A., A. Al-Salman, M. Alsaleh, A. Alnafessah, S. Al-Hadhrami, M. A. Al-Ammar, and H. S. Al-Khalifa. 2016. Ultra wideband in-door positioning technologies: Analysis and recent advances. Sen-sors (Basel) 16:707. https://doi.org/10.3390/s16050707.
Arcidiacono, C., S. M. C. Porto, M. Mancino, and G. Cascone. 2017. A software tool for the automatic and real-time analysis of cow ve-locity data in free-stall barns: The case study of oestrus detection from ultra-wide-band data. Biosyst. Eng. https://doi.org/10.1016/ j.biosystemseng.2017.10.007. In press.
Benjamini, Y., and Y. Hochberg. 1995. Controlling the false discovery rate: A practical and powerful approach to multiple testing. J.R. Stat. Soc. 57:289–300.
Berckmans, D. 2014. Precision livestock farming technologies for wel-fare management inintensive livestock systems. Rev. Sci. Tech. 33:189–196.
Blackie, N., J. R. Amory, E. Bleach, and J. Scaife. 2011. The effect of lameness on lying behaviour of zero grazed Holstein dairy cat-tle. Appl. Anim. Behav. Sci. 134:85–91. https://doi.org/10.1016/j .applanim.2011.08.004.
Brown, D. D., R. Kays, M. Wikleski, R. Wilson, and A. P. Klimey. 2013. Observing the unwatchable through acceleration logging of animal behavior. Anim. Biotelem. 1:20.
Cook, N. B., M. J. Marin, R. L. Mentink, T. B. Bennett, and M. J. Schaefer. 2008. Comfort zone-design free stalls: Do they influence the stall use behavior of lame cows? J. Dairy Sci. 91:4673–4678. https://doi.org/10.3168/jds.2007-0910.
DeVries, T. J., M. A. G. von Keyserlingk, D. M. Weary, and K. A. Beauchemin. 2003. Measuring the feeding behavior of lactating dairy cows in early to peak lactation. J. Dairy Sci. 86:3354–3361. https://doi.org/10.3168/jds.S0022-0302(03)73938-1.
Galindo, F., and D. M. Broom. 2002. The effects of lameness on social and individual behavior of dairy cows. J. Appl. Anim. Welf. Sci. 5:193–201. https://doi.org/10.1207/S15327604JAWS0503_03. Gomez, A., and N. B. Cook. 2010. Time budgets of lactating dairy
cattle in commercial freestall herds. J. Dairy Sci. 93:5772–5781. https://doi.org/10.3168/jds.2010-3436.
González, L. A., B. J. Tolkamp, M. P. Coffey, A. Ferret, and I. Kyri-azakis. 2008. Changes in feeding behavior as possible indicators for the automatic monitoring of health disorders in dairy cows. J. Dairy Sci. 91:1017–1028. https://doi.org/10.3168/jds.2007-0530. Gygax, L., G. Neisen, and H. Bollhalder. 2007. Accuracy and
valida-tion of a radar-based automatic local posivalida-tion measurement sys-tem for tracking dairy cows in free-stall barns. Comput. Electron. Agric. 56:23–33. https://doi.org/10.1016/j.compag.2006.12.004. Hart, K. D., B. W. McBride, T. F. Duffield, and T. J. DeVries. 2014.
Effect of frequency of feed delivery on the behavior and productiv-ity of lactating dairy cows. J. Dairy Sci. 97:1713–1724.
Horseman, S., E. Roe, J. Huxley, N. Bell, C. Mason, and H. Whay. 2014. The use of in-depth interviews to understand the process of treating lame dairy cows from the farmers perspective. Anim. Welf. 23:157–165. https://doi.org/10.7120/09627286.23.2.157. Huhtala, A., K. Suhonen, P. Mäkelä, M. Hakojärvi, and J. Ahokas.
2007. Evaluation of instrumentation for cow positioning and track-ing indoors. Biosyst. Eng. 96:399–405. https://doi.org/10.1016/j .biosystemseng.2006.11.013.
Ito, K., M. A. G. von Keyserlingk, S. J. LeBlanc, and D. M. Weary. 2010. Lying behavior as an indicator of lameness in dairy cows. J. Dairy Sci. 93:3553–3560. https://doi.org/10.3168/jds.2009-2951. Juarez, S., P. Robinson, E. DePeters, and E. Price. 2003. Impact of
lameness on behavior and productivity of lactating Holstein cows. Appl. Anim. Behav. Sci. 83:1–14. https://doi.org/10.1016/S0168 -1591(03)00107-2.
Leach, K. A., D. A. Tisdall, N. J. Bell, D. C. J. Main, and L. E. Green. 2012. The effects of early treatment for hindlimb lameness in dairy cows on four commercial UK farms. Vet. J. 193:626–632. https:// doi.org/10.1016/j.tvjl.2012.06.043.
Leach, K. A., H. R. Whay, C. M. Maggs, Z. E. Barker, E. S. Paul, A. K. Bell, and D. C. J. Main. 2010. Working towards a reduction in cattle lameness: 1. Understanding barriers to lameness control on dairy farms. Res. Vet. Sci. 89:311–317. https://doi.org/10.1016/j .rvsc.2010.02.014.
Main, D. C. J., Z. E. Barker, K. A. Leach, N. J. Bell, H. R. Whay, and W. J. Browne. 2010. Sampling strategies for monitoring lame-ness in dairy cattle. J. Dairy Sci. 93:1970–1978. https://doi.org/10 .3168/jds.2009-2500.
Mattachini, G., E. Riva, F. Perazzolo, E. Naldi, and G. Provolo. 2016. Monitoring feeding behaviour of dairy cows using accelerometers. J. Agric. Eng. 47:54–58.
Meunier, B., P. Pradel, K. H. Sloth, C. Cirié, E. Delval, M. M. Mialon, and I. Veissier. 2017. Image analysis to refine measurements of dairy cow behaviour from a real-time location system. Biosyst. Eng. https://doi.org/10.1016/j.biosystemseng.2017.08.019. In press.
Miekley, B., E. Stamer, I. Traulsen, and J. Krieter. 2013. Implementa-tion of multivariate cumulative sum control charts in mastitis and lameness monitoring. J. Dairy Sci. 96:5723–5733. https://doi.org/ 10.3168/jds.2012-6460.
Navarro, G., L. E. Green, and N. Tadich. 2013. Effect of lameness and lesion specific causes of lameness on time budgets of dairy cows at pasture and when housed.Vet. J. 197:788–793. https://doi.org/10 .1016/j.tvjl.2013.05.012.
Nechanitzky, K., A. Starke, B. Vidondo, H. Müller, M. Reckardt, K. Friedli, and A. Steiner. 2016. Analysis of behavioral chang-es in dairy cows associated with claw horn lchang-esions. J. Dairy Sci. 99:2904–2914. https://doi.org/10.3168/jds.2015-10109.
Neveux, S., D. M. Weary, J. Rushen, M. A. G. von Keyserlingk, and A. M. de Passillé. 2006. Hoof discomfort changes how dairy cattle distribute their body weight. J. Dairy Sci. 89:2503–2509. https:// doi.org/10.3168/jds.S0022-0302(06)72325-6.
Norring, M., J. Häggman, H. Simojoki, P. Tamminen, C. Winckler, and M. Pastell. 2014. Short communication: Lameness impairs feeding behavior of dairy cows. J. Dairy Sci. 97:4317–4321. https://doi .org/10.3168/jds.2013-7512.
Palmer, M. A., R. Law, and N. E. O’Connell. 2012. Relationships be-tween lameness and feeding behaviour in cubicle-housed Holstein– Friesian dairy cows. Appl. Anim. Behav. Sci. 140:121–127. https:// doi.org/10.1016/j.applanim.2012.06.005.
Pastell, M., L. Hänninen, A. M. de Passillé, and J. Rushen. 2010. Mea-sures of weight distribution of dairy cows to detect lameness and the presence of hoof lesions. J. Dairy Sci. 93:954–960. https://doi .org/10.3168/jds.2009-2385.
Porto, S. M. C., C. Arcidiacono, A. Giummarra, U. Anguzza, and G. Cascone. 2014. Localisation and identification performances of a real-time location system based on ultra wide band technology for monitoring and tracking dairy cow behaviour in a semi-open free-stall barn. Comput. Electron. Agric. 108:221–229. https://doi.org/ 10.1016/j.compag.2014.08.001.
R Core Team. 2017. R: A language and environment for statistical computing. R Foundation for Statistical Computing, Vienna, Aus-tria. https://www.R-project.org/.
Robert, B., B. J. White, D. G. Renter, and R. L. Larson. 2009. Evalu-ation of three-dimensional accelerometers to monitor and classify behaviour patterns in cattle. Comput. Electron. Agric. 67:80–84. Shane, D. D., B. J. White, R. L. Larson, D. E. Amrine, and J. L.
Kramer. 2016. Probabilities of cattle participating in eating and drinking behavior when located at feeding and watering locations
by a real time location system. Comput. Electron. Agric. 127:460– 466. https://doi.org/10.1016/j.compag.2016.07.005.
Silper, B. F., I. Robles, A. M. L. Madureira, T. A. Burnett, M. M. Reis, A. M. de Passillé, J. Rushen, and R. L. A. Cerri. 2015. Au-tomated and visual measurements of estrous behavior and their sources of variation in Holstein heifers. I: Walking activity and behavior frequency. Theriogenology 84:312–320. https://doi.org/ 10.1016/j.theriogenology.2014.12.029.
Singh, S. S., W. R. Ward, K. Lautenbach, and R. D. Murray. 1993. Be-haviour of lame and normal dairy cows in cubicles and in a straw yard. Vet. Rec. 133:204–208.
Toussaint-Raven, E. 2003. Cattle Foot Care and Claw Trimming. Farming Press, Ipswich, UK.
Tullo, E., I. Fontana, D. Gottardo, K. H. Sloth, and M. Guarino. 2016. Technical note: Validation of a commercial system for the continu-ous and automated monitoring of dairy cow activity. J. Dairy Sci. 99:7489–7494. https://doi.org/10.3168/jds.2016-11014.
Van Hertem, T., E. Maltz, A. Antler, C. E. B. Romanini, S. Viazzi, C. Bahr, A. Schlageter-Tello, C. Lokhorst, D. Berckmans, and I. Hal-achmi. 2013. Lameness detection based on multivariate continuous sensing of milk yield, rumination, and neck activity. J. Dairy Sci. 96:4286–4298. https://doi.org/10.3168/jds.2012-6188.
Van Nuffel, A., I. Zwertvaegher, S. Van Weyenberg, M. Pastell, V. M. Thorup, C. Bahr, B. Sonck, and W. Saeys. 2015. Lameness detec-tion in dairy cows: Part 2. Use of sensors to automatically register changes in locomotion or behavior. Animals (Basel) 5:861–885. https://doi.org/10.3390/ani5030388.
Vázquez Diosdado, J. A., Z. E. Barker, H. R. Hodges, J. R. Amory, D. P. Croft, N. J. Bell, and E. A. Codling. 2015. Classification of behaviour in housed dairy cows using an accelerometer-based activity monitoring system. Anim. Biotelem. 3. https://doi.org/10 .1186/s40317-015-0045-8.
Wagner-Storch, A. M., and R. W. Palmer. 2003. Feeding behavior, milking behavior, and milk yields of cows milked in a parlor versus and automatic milking system. J. Dairy Sci. 86:1494–1502. Whay, H. R., A. E. Waterman, A. J. F. Webster, and J. K. O’Brien.
1998. The influence of lesion type on the duration of hyperal-gesia associated with hindlimb lameness in dairy cattle. Vet. J. 156:23–29.
Williams, M. L., N. Mac Parthaláin, P. Brewer, W. P. J. James, and M. T. Rose. 2016. A novel behavioral model of the pasture-based dairy cow from GPS data using datamining and machine learning techniques. J. Dairy Sci. 99:2063–2075. https://doi.org/10.3168/ jds.2015-10254.
Willshire, J. A., and N. J. Bell. 2009. An economic review of cattle lameness. Cattle Pract. 17:136–141.