The use of simulation in the design of
a road transport incident detection algorithm
Ben J. Waterson (BSc, MSc) Lecturer, Transportation Research Group
Tom J. Cherrett (BSc, PhD, MCILT) Lecturer, Transportation Research Group
Mike McDonald (BSc, PhD, FICE, FCILT) Director, Transportation Research Group
The Transportation Research Group, School of Civil Engineering and the Environment,
University of Southampton, Highfield,
Southampton. SO17 1BJ. United Kingdom
Abstract
Automatic incident detection is becoming one of the core tools of urban traffic management, enabling more rapid identification and response to traffic incidents and congestion. The existing traffic detection infrastructure within many urban areas (often installed for traffic signal optimisation) provides urban traffic control systems with a near continuous stream of data on the state of traffic within the network. The creation of a computer simulation model to replicate such a data stream can therefore provide a facility for the development of accurate congestion detection and warning algorithms. This paper reports on the development of firstly an urban traffic control simulation platform and secondly a new incident detection system (RAID – Remote Automatic Incident Detection), with the facility to use the simulation platform as an integral part of the design and calibration process.
A commercial traffic simulation model was augmented with additional code developed to replicate the traffic status messages generated by a real urban traffic control system using the 250 millisecond data produced from single inductive loop detectors. These messages were then fed directly into an offline version of the RAID detection algorithm. This approach allowed the network managers to both visualise the system in operation and assess the impact on RAID detection accuracy of changing rule settings or traffic detector placements without the need for any alterations to the on-street detection infrastructure .
Introduction
With levels of traffic congestion in urban areas set to rise significantly by 2016 (Department for Transport 1997), the need to manage traffic more effectively becomes acute. The annual cost to business resulting from traffic congestion has been estimated at £20 billion (Freight Transport Association 2003) whilst road accidents have been estimated to cost the country over £16 billion per annum (ROSPA 2000). Considerable benefits to society in terms of reduced fatalities and overall network delay could be gained through earlier identification of traffic abnormalities.
Currently, closed circuit television (CCTV) is the most common technology used for road network monitoring although in large urban networks the number of images to be observed by operators can make this prohibitive. In addition to such CCTV systems, many urban areas have an existing coverage of traffic detectors, often primarily installed for the purposes of adaptive signal control through algorithms such as SCOOT (Traffic Advisory Unit 1999, Bretherton et al 2004) and SCATS (Kirkham 1997, Abdel-Rahim et al 1998). These detectors, located either within the road surface (Figure 1) or mounted on poles at the side of the traffic stream, provide a near constant stream of traffic speed and flow data which can also be used for network monitoring and hence incident detection systems.
This paper describes two phases of work carried out within the Transportation Research Group of the University of Southampton as part of the 5th Framework PRIME project (Prediction Of Congestion
And Incidents In Real Time, For Intelligent Incident Management And Emergency Traffic Management).
[image:2.595.111.487.478.707.2]The first phase was to adapt an existing commercial traffic simulation package to replicate the production of speed, flow and occupancy data from single inductive loop detectors and accompanying summary urban traffic control (UTC) messages. The second phase was to use the simulation model to develop and demonstrate the operation of a new automatic incident detection algorithm based on these messages and provide a means to improve the speed with which network managers can be made aware of developing abnormal congestion and possible incidents with the network, without the need for additional on-street detection infrastructure.
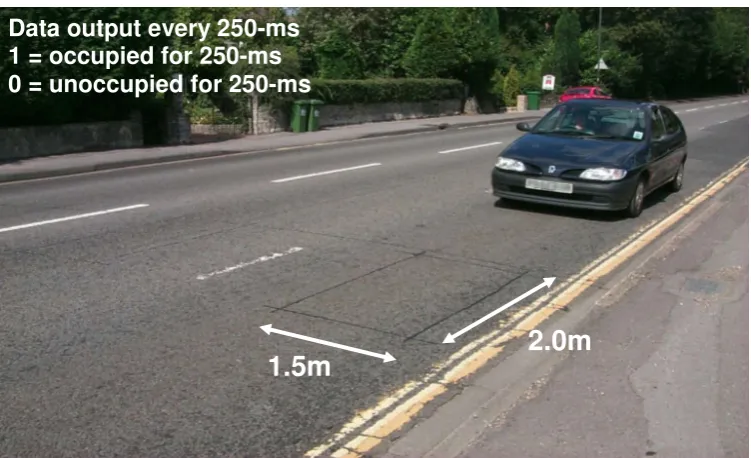
Figure 1. Vehicle detection by single inductive loop
Data output every 250-ms
1 = occupied for 250-ms
0 = unoccupied for 250-ms
UTC Detector Data
The oldest and still most common form of traffic detection in urban areas comes from detectors that report traffic conditions in their immediate vicinity. These detectors have often been installed on the approaches to signal controlled junctions to provide inputs to traffic signal control algorithms or at key points within the network to provide information on traffic conditions direct to network managers (Cherrett, McLeod, Bell & McDonald 2002). Although recent years have seen increasing numbers of ‘above ground’ detectors (for example infra-red detectors mounted on poles or gantries) the commonest form is still the single inductive loop detector (Figure 1) where the metallic content of a vehicle passing overhead induces an electric current within (typically 2m by 1.5m) coils of wire laid into the road surface (Palen 2001). The occupancy status of an inductive loop detector functioning in a UTC system running adaptive traffic signal controls is sampled every 250 millisecond, providing a digital profile of the passing vehicles. These data are used to automatically monitor traffic patterns and optimise signal settings accordingly to reduce vehicle delays and stops.
A detailed description of the methodology for extracting the necessary parameters from the detector data has been described in detail elsewhere (Cherrett, Bell & McDonald 2000). In summary the detector buried in the road surface produces an analog signal which is turned into a digital signal by a detector pad usually located within an adjacent controller. A value of 1 indicates the presence (and a value of 0 the absence) of a vehicle over the loop. The number of successive 1s produced is a combined measure of the active detection length of the loop and the effective metallic length of the vehicle and is inversely proportional to speed. For vehicles travelling over a detector in a given time period, a measure of the combined effects of their speed and length can be obtained by totalling the number of occupancies (repeated 1s) and dividing by the number of vehicles (1/0 or 0/1 ‘switches’ within the data). The parameter produced is the Average Loop-Occupancy Time Per Vehicle (ALOTPV). In the case of a detector being sampled every 250 millisecond, the ALOTPV for a thirty second period could range from infinity, (no occupancies and therefore no switches) to 119 (119 quarter-second intervals of occupancy, one quarter-second interval of metal absence and hence one switch). 0 10 20 30 40 50 60 70 80 90 100 06:4 5:30 06:5 3:00 07:0 0:30 07:0 8:00 07:1 5:30 07:2 3:00 07:3 0:30 07:3 8:01 07:4 5:30 07:5 3:00 08:0 0:30 08:0 8:00 08:1 5:30 08:2 3:00 08:3 0:30 08:3 8:00 08:4 5:30 08:5 3:00 09:0 0:30 09:0 8:00 09:1 5:30 09:2 3:00 Tim e S p e e d ( m p h ) & % O c c u p a n c y 0 20 40 60 80 100 120 A L O T P V Speed (mph) % Occupancy ALOTPV
Figure 2. Example thirty second ALOTPV, percentage occupancy and average speed data
detector can be seen at approximately 07:58, at which point ALOTPV rises sharply. It is also possible to use the 250 millisecond periods of zero occupancy to gauge the Average Time-Gap Between Vehicles (ATGBV). The ATGBV is determined by dividing the number of 250 millisecond vacant periods (successive 0s) by the number of vehicles (1/0 or 0/1 ‘switches’). The parameters of ALOTPV and ATGBV were developed as part of an EPSRC ‘LINK’ funded project (EPSRC Grant GR/J97724, The estimation of journey times from detector data).
[image:4.595.118.474.244.374.2]The algorithms for calculating thirty second aggregated flow, speed, occupancy, ALOTPV and ATGBV data have been integrated into the UTC system produced by Siemens Traffic Controls Ltd. For each detector within the network this information is made available to operators or other applications via the U06 message (Figure 3), one of a series of event driven messages providing access to UTC data. It is this message that can therefore form the basis of incident detection algorithms.
Figure 3. Decomposition of U06 messages
Simulated UTC Detector Data
The levels and locations of queuing and congestion within urban traffic systems are the aggregated result of many (often small) behavioural decisions taken by individual drivers, such as the choice of route through the network, when to change lane and following distance behind the vehicle ahead. The variability of these driver behavioural decisions in conjunction with supply-side considerations such as traffic signal timings, pedestrian crossings and even weather conditions mean that urban traffic dynamics although following semi-predictable daily patterns are likely never to produce exactly the same data twice. Add to this the uniqueness (and fortunate rarity) of traffic incidents and the need for a simulated UTC platform within which to test incident detection systems becomes apparent.
To simulate a UTC detection system and in particular the U06 operator message it was first necessary to identify a suitable existing urban road network to use as a basis for the model. While many microscopic traffic models have the integrated facilities to model traffic detectors, the AIMSUN (Advanced Interactive Microscopic Simulator for Urban and non-urban Networks) model was selected for two reasons.
•
The minimum time-step available within the model was 100 milliseconds, sufficient to representthe 250 millisecond scanning rate of inductive loop detectors and options were already available to aggregate this data for the required thirty second intervals.
•
The availability of the GETRAM Extensions API enabled the creation of a standalone UTCsimulation to receive the aggregated data from the simulation every thirty seconds.
The GETRAM (Generic Environment for Traffic Analysis and Modelling) Extensions provide access to four user definable (C++) functions called by the simulation at the beginning of a simulation run, immediately preceding and following each simulation step and at the termination of the simulation
7 32 0 11 N03224M 23 37 3 583 3766 233 7 32 30 11 N03224M 31 50 8 1083 1337 162 7 33 0 11 N03224M 23 38 7 1333 1485 228 7 33 30 11 N03224M 24 39 4 750 2775 225
Time of U06 Message (h m s 100ths) Data covers period
7:33:00 to 7:33:30
Detector ID
Average Speed (mph kmph)
Flow
Occupancy (% x100)
ATGBV (x100)
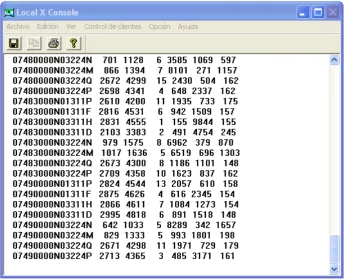
run. The UTC simulation requires two of these functions to be called, firstly to initialise the UTC data collection and display routines and secondly the post-step function to collate the detector data and calculate and replicate the U06 message for each detector in the network every 30 simulated seconds (Figure 4).
Figure 4. Example simulated U06 messages
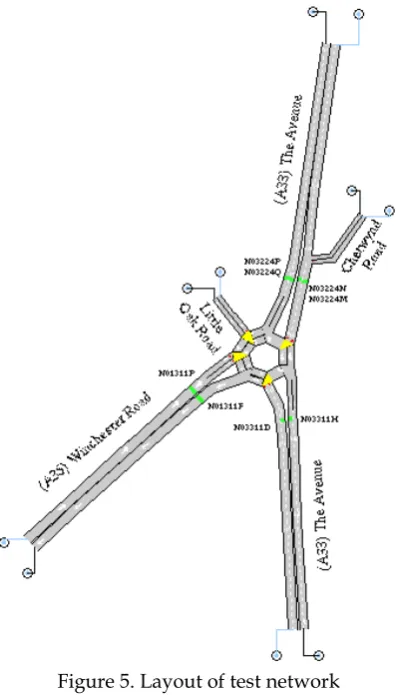
Figure 5. Layout of test network
In order to simulate a ‘typical’ traffic situation within the test network, real-life U06 messages from all the detectors in the test network were collected for a series of typical morning peak periods (7:30 to 09:30) each independently verified (by CCTV) to be free from traffic incidents. The measured flows from the furthest upstream detectors for each day were then used to estimate the typical time-varying inflows to the network which, when matched with data from historic turning movement surveys at the roundabout produced an approximate time-varying origin-destination matrix which could then be simulated using the network. While this use of a generic traffic pattern within the network precludes a formal evaluation by comparing simulated and real-life U06 data from the remaining detectors, the correct operation of both the network simulation and UTC simulation module can be assessed by examining the simulated queuing patterns within the network.
Incidents could be simulated at any location and at any time within the network, blocking one or more lanes. This enabled the simulation of both minor incidents where the road is still passable but with reduced capacity and major incidents where the road must be completely closed. The duration of incidents can also be defined, enabling the simulation of temporary urban traffic phenomena such as illegally parked vehicles or vehicles waiting to turn across the on-coming traffic stream.
Developing an Incident Detection Algorithm
as it does not require the set up of an ‘incident trap’, an area in which incidents are presumed likely and for which a pair of detectors have been fitted, one at each of the upstream and downstream ends.
Tests using the simulation model (and confirmed within real U06 data) indicated that following an incident a marked increase in ALOTPV would be experienced. This suggested that a critical threshold could be defined for each detector which, when exceeded by the reported data, would indicate abnormal congestion. Simulating incidents however in an attempt to define the level of this threshold highlighted two problems.
•
Time variant traffic levels.As illustrated in Figure 2, the underlying level of ALOTPV varies by time of day. A normal level of ALOTPV in peak periods therefore (which should not raise an alarm) may be the same as an abnormal level in an off-peak period (which should raise an alarm).
•
Natural variability in traffic levels.As with any warning system, an excessive number of false alarms leads to a loss of trust in the system. Unfortunately the underlying variability of urban traffic patterns (Figure 2) means that any threshold could be exceeded for a short period of time even when no incident has occurred. The algorithm must therefore assess whether an ALOTPV value in excess of the threshold is a temporary ‘spike’ or the beginning of a series of high values.
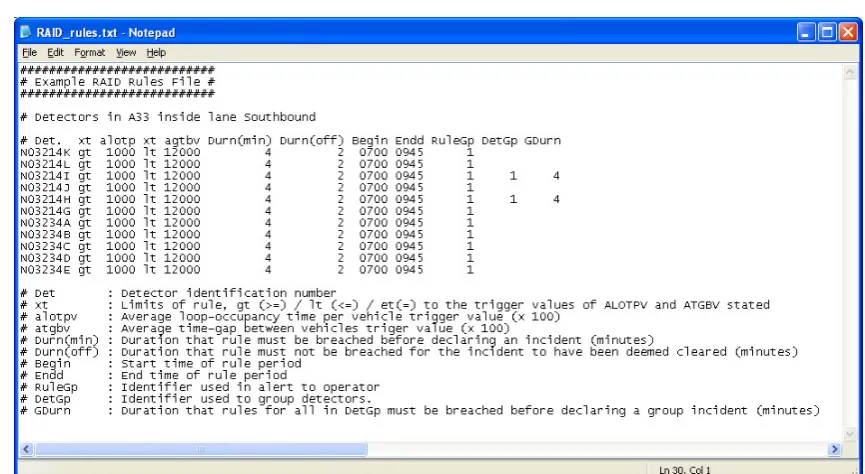
The developed algorithm (RAID – Remote Automatic Incident Detection) is based on a series of operator defined rules (Figure 6) each specifying for a single detector
•
The time period for which the rule is to be used•
The critical threshold (for ALOTPV and/or ATGBV) to be exceeded•
The continuous duration for which the threshold(s) must be exceeded to raise an alarm [image:7.595.78.511.436.673.2]•
The continuous duration for which the threshold(s) must not be exceeded to clear an alarmFigure 6. Example RAID rules file
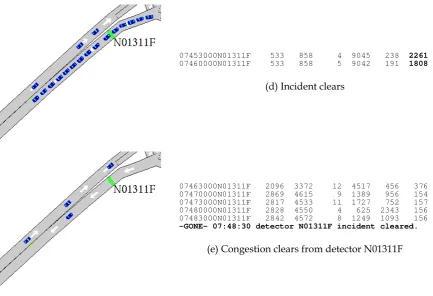
Because of its responsive nature to U06 messages the RAID algorithm can be simulated in the post-step GETRAM Extension function immediately following the generation of the U06 messages. This enables the full sequence of events involved in a traffic incident to be simulated (Figure 7), where a short duration incident produces a significant (but not complete) reduction in vehicle flow. The simulated RAID rule for the detector specifies that an ALOTPV threshold of 1000 (the average vehicle in a thirty second period taking 2.5 seconds to cross a two metre detector) must be exceeded for more than three minutes to raise an alarm and not exceeded for more than two minutes to cancel the alarm.
Simulated Congestion Simulated Algorithm Response
Speed x100 Occupancy
Time Detector mph kmph Flow %x100 ATGBV ALOTPV
07333000N01311F 2838 4566 6 937 1510 156 07340000N01311F 2829 4551 8 1250 1093 156 07343000N01311F 2845 4578 5 778 1844 155 07350000N01311F 2866 4611 8 1238 1095 154
(a) Free flowing traffic over detector N01311F
07353000N01311F 2846 4579 7 1087 1273 155 ...
07400000N01311F 2863 4606 8 1236 1095 154 07403000N01311F 2860 4602 6 928 1511 154 07410000N01311F 2862 4604 7 1120 1268 160 07413000N01311F 2410 3877 8 1726 1034 215
07420000N01311F 1062 1709 6 6411 598 1068
(b) Incident occurs, queue reaches detector N01311F
07423000N01311F 537 864 5 9138 172 1827
07430000N01311F 533 858 4 9045 238 2261
07433000N01311F 533 858 5 9042 191 1808
07440000N01311F 533 858 5 8937 212 1787
07443000N01311F 533 858 5 8937 212 1787
07450000N01311F 533 858 5 8937 212 1787
-WARN- 07:45:00 detector N01311F incident detected.
07453000N01311F 533 858 4 9045 238 2261
07460000N01311F 533 858 5 9042 191 1808
(d) Incident clears
07463000N01311F 2096 3372 12 4517 456 376 07470000N01311F 2869 4615 9 1389 956 154 07473000N01311F 2817 4533 11 1727 752 157 07480000N01311F 2828 4550 4 625 2343 156 07483000N01311F 2842 4572 8 1249 1093 156
-GONE- 07:48:30 detector N01311F incident cleared.
[image:9.595.80.514.77.373.2](e) Congestion clears from detector N01311F
Figure 7. Stages of a RAID alarm
While the effectiveness of the algorithm increases with the degree of library detail and the extent to which the thresholds and durations have been defined for the different detectors and periods of the day, initial guide values can be created by returning to the simulation model. A comparison of the simulated ALOTPV values at different detector locations for both simulated incident and non-incident scenarios established that rules based on the 85th percentile value of ALOTPV under
non-incident conditions could be used as an initial threshold at which to trigger non-incident alarms. Repeated simulation runs using this guide ALOTPV trigger threshold on detectors where high levels of congestion were observed suggested that breaches lasting more than three consecutive minutes during off-peak periods and four minutes during peak periods were sufficiently unusual to warrant further investigation by the operator. Such repeated runs with identical incident types and sensitivity analysis with respect to trigger duration would not have been possible without the simulation model.
During these simulation runs, considerable numbers of false alarms were simulated for both peak (Figure 8) and off-peak values when the trigger duration was less than two minutes (trigger levels set at 85th percentile level for each detector). In designing RAID it was considered important to only
0 5 10 15 20 25 30 35 40 45 50
0.5 1 1.5 2 2.5 3 3.5 4 4.5 5
Trigger Duration (minutes)
N
u
m
b
e
r
o
f
R
A
ID
A
la
rm
s
N03214A
N03214B
N03214D
Figure 8. Impact of trigger duration on false alarm rate for three detector locations
Implementation of Algorithm within UTC
As part of the PRIME project, RAID was installed in the Southampton UTC system operated through the ROMANSE project (Wren & Jones 1996) and tested using real-time data from inductive loop detectors situated on roads with and without traffic signals. As the RAID algorithm is integrated into the UTC system it has direct access to thirty second aggregated data and continually checks the status of the detectors listed in the rules file against the trigger values of ALOTPV and ATGBV declared by the operator. RAID alarms (and end of alarms) are produced in the form of U15 (and U16) messages identical in format to those developed for the simulation of the algorithm.
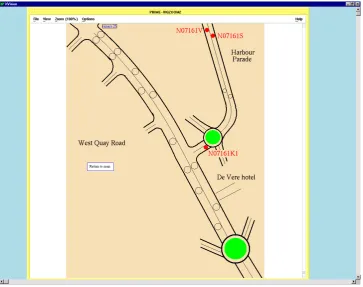
With the volume of other text information already presented to the control room operator, it was also considered necessary to provide a more user friendly medium to present the alarms. Within the PRIME project and subsequent developments, two further interfaces were created
•
An interface between RAID and the UTC map editor to enable the U15 (alarm on) and U16 (alarmoff) messages to be represented on maps of the network via flashing detectors or links. When a detector in the area of the map triggers a RAID alarm, the particular road section (or individual detector) flashes red (Figure 9).
Figure 9. Map based display of RAID alarms
It should be noted that while a RAID alarm could be due to a number of reasons (such as abnormally heavy congestion, a vehicle-on-vehicle impact or a broken down or illegally parked vehicle), there are also several specific detector faults which can produce similar data to those that would be expected during queuing conditions. It must therefore be remembered that an alarm does not automatically imply an abnormal traffic situation but can also encompass a range of detector faults which produce similar output to that which would be created by queuing or stationary vehicles. While the control room operator still has to independently verify a RAID alarm (via CCTV or simple ‘street watch’ schemes where businesses or private houses near detector stations could be contacted to verify alarms raised by the system) the benefits of RAID are in its clear early warning of developing traffic problems.
The results of a substantial trial of the RAID system have been described in detail elsewhere (Cherrett, Waterson & McDonald forthcoming). Simultaneous logs of RAID alarms and actual incidents were kept for 167 consecutive days for the A33 Bassett Avenue and A35 Winchester Road. During this period, 32 incidents were recorded on the A33 Bassett Avenue and 49 on the A35 Winchester Road, with 181 and 334 RAID triggers respectively. The RAID detection rate of verified incidents was 69% (22) and 92% (45) respectively, with the low detection rate on the A33 being due to five incidents during off-peak periods which caused no congestion and therefore could not be detected by RAID. While this may seem to suggest that RAID suffers from a high false alarm rate, providing information which would not be acted on by the control room operators, further discussions and analysis of the control room logs showed such alarms were still beneficial to the control room operators however as one in every 3.8 RAID warnings resulted in either a delay message through Variable Message Signs or a radio traffic bulletin being issued by the control room to the general public. Thirty eight of the recorded RAID alarms on the A33 resulted from verified detector faults.
Within rapidly changing urban traffic networks substantial benefits can be obtained by early detection of traffic incidents and episodes of abnormal congestion. Identifying these conditions can be difficult however when operators are required to monitor the output from multiple surveillance systems simultaneously. The uniqueness (and fortunate rarity of the severest) of such incidents however hinders the development and calibration of automatic algorithms to detect the changing traffic conditions they create.
By creating a simulation of a common data message produced by an urban traffic control system it has been possible to provide a platform to aid in the development of a new incident detection algorithm and whereby the performance of the algorithm can be assessed. The simulation is based on the established AIMSUN traffic simulation model, enabling realistic modelling of congestion and queue development within the model for both incident and non-incident scenarios. An additional module has been developed to replicate the U06 operator message, produced by STCL urban traffic control systems, which provides information about the traffic state at inductive loop detectors within the network every thirty seconds.
Using the simulation platform a new algorithm known as RAID (Remote Automatic Incident Detection) has been developed to sit within the urban traffic control system and monitor the U06 messages produced for each detector. Each dataset is then compared against a list of operator defined rules to assess whether an alarm should be raised and the operator alerted. The simulation platform enables the repeated modelling of a wide range of common traffic incidents, providing a means for the generation of initial trigger values and associated durations for which they must be exceeded to raise alarms, as well as demonstrating the operation of the system to potential users. The development of the simulation platform has therefore been fundamental to the design, calibration and testing of RAID.
Acknowledgements
The authors wish to acknowledge the help and support of the staff of the ROMANSE traffic control centre, Southampton, UK and Siemens Traffic Controls Ltd, UK for their cooperation in this research.
References
•
Abdel-Rahim, A., Taylor, W.C. and Bangia, A. (1998) “The SCATS effect”, Traffic Technology International,February/March, 57-60.•
Bretherton, D., Bodger, M. and Baber, N. (2004) “SCOOT – the future”, Proceedings of the 12thInternational Conference on Road Transport Information and Control, 301-306.
•
Cherrett T.J., Bell H.A. and McDonald M. (2000) “Traffic management parameters from single inductive loop detectors”, Transportation Research Record 1719, 112-120.•
Cherrett, T.J., McLeod, F., Bell, H. and McDonald, M. (2002) “Journey time estimation using single inductive loop detectors on non-signalised links”, Journal of the Operational Research Society53, 610-619.
•
Cherrett, T., Waterson, B. and McDonald, M. (forthcoming) “Remote automatic Incident detection (RAID) using inductive loop detectors”, forthcoming in Proceedings of the Institution of Civil Engineers: Transport.•
Department for Transport (1997) National road traffic forecasts (Great Britain) 1997, (http://www.dft.gov.uk/stellent/groups/dft_transstrat/documents/page/dft_transstrat_02833 2.hcsp)•
Freight Transport Association (2003) Roads – Congestion is the real toll, Press release 29th December 2003. (http://www.fta.co.uk/news/pressreleases/archive/20031229Roads-.htm)•
Kirkham, R. (1997) “Making the most of SCATS”, Traffic Technology International, Annual Review, 32-34.•
Royal Society for the Prevention of Accidents (2000)Road safety engineering factsheet. Cost effective local safety schemes,(http://www.rospa.org.uk/cms/STORE/Road%20Safety/2_engineering_files/engineering.htm)
•
Traffic Advisory Unit (1999) “The ‘SCOOT’ urban traffic control system”, Traffic Advisory Leaflet7/99, London: Department of Transport.