Abstract
In fundraising, it is common for the donor to see how much a charity has received so far. What is the impact of this information on a) how much people choose to donate and b) which charity they choose to donate to? Conditional cooperation suggests that people will donate to the charity that has received the most prior support, while the Underdog Effect suggests increased donations to the charity with the least support. Across 2 laboratory experiments, an online study (combined N = 494) and a qualitative survey (N = 60), a consistent preference to donate to the charity with the least prior support was observed. Thus, the Underdog Effect was supported. We suggest people will show a preference for the underdog if there are two or more charities to donate to, one of the charities is at a disadvantage and people have little pre-existing loyalty to either charity.
It is becoming increasingly common for charities to allow potential donors to be able to observe others’ prior donations (Butt & Shah, 2012). It is believed that the visibility of previous donations provides social information that potential donors can use to help inform their own donation decisions. A number of studies examining this type of social information have shown that people have a preference to give to a charity/organization with a larger number of previous donations (Frey & Meier, 2004; Martin & Randal, 2008). However, many of these studies prevented direct comparison of information across charities by using between subjects designs, whereby participants were presented with information about either one charity or another (Frey & Meier, 2004; Martin & Randal, 2008). A more realistic scenario is that potential donors are able to compare information on previous donations across charities simultaneously. This is akin to online fundraising where donation
information for a variety of charities can be compared. Therefore, we investigate whether, under this donation scenario, donors would show a preference to donate to either the most supported or the least supported charity. If participants do prefer the least supported charity, we ask: is this because they are motivated by the desire to make their donation have a bigger impact on the charity (the impact donor) or are they motivated by a preference to support those at a disadvantage (the underdog donor)? Theoretically, this paper explores the potential role of an underdog effect in charitable decisions. First, we review the theories that support the preference to give to a charity with greater prior support. We then review the theories supporting the preference to contribute to a charity with the least prior support. Finally, we explore how these preferences may be moderated by the observability of prior donations before outlining the current research.
Preferences for giving to a charity with greater prior support
contribute (Fischbacher, Gachter, & Fehr, 2001). That is, if a large number of people are known to have donated to one charity compared to another, then conditional co-operators should be more likely to contribute to the charity with a greater number of prior donations. For example, Frey and Meier (2004) informed students that either 64% or 46% of past students contributed to two student funds. Those students were 2.3% more likely to donate to the charity to which they believed 64% of previous students had donated. Quality Signaling theory suggests that individuals give to charities that already have high levels of contributions because they are perceived to be: (1) of higher quality, (2) more likely to use donations effectively, and (3) more likely to receive future donations (Vesterlund, 2003).
Preferences for giving to a charity with least prior support
Duncan's (2004) ‘Impact Philanthropy’ model defines an alternative type of philanthropic donor, known as an impact donor. Impact donors derive satisfaction from knowing their contribution makes a real difference to the level of goods and/or services provided by a charity. If other donors have given substantially to a charity then, potentially, any additional donations will have a smaller effect on increasing the level of goods and/or services that the charity provides. To test this model empirically, Borgloh, Dannenberg, and Aretz, (2013), gave participants the option of donating to a charity that has a small (€40,000-300,000) or large (€5-11 million) annual revenue. They found that 73% of participants choose to give to the charity with the smaller revenue, which resulted in an additional €323 being donated to that charity. Borgloh et al (2013) suggested donations to the charity with a smaller revenue would have greater impact since the donors’ contributions would have the largest effect on increasing the endowment of the charity.
An alternative explanation focuses on the ‘Underdog Effect’ where one favors a
phenomenon observed in voting behavior, brand loyalty, and sports spectators’ choice of team (Goldschmied & Vandello, 2012; Goldschmied & Vandello, 2009; Shirai, 2017). The Underdog Effect may then be plausibly extended to charitable decision making, predicting that donors should give to the charity with the least revenue since that charity is at a relative disadvantage (i.e. less funding). Indeed, the concept of the underdog is highly accessible (Kim et al., 2008) and a lay conception of the underdog is overly optimistic regarding the likelihood of the underdog succeeding (Goldschmied & Vandello, 2012). However, if the charity with lower revenue were perceived to be at a deserved disadvantage due to
squandering donations (i.e. high staffing costs) then it would not be perceived as an underdog.
Effects of Observability on Donations
An ongoing, prominent debate in the charitable donation literature is whether the observability of a donation act increases the amount donated (Jones & Linardi, 2012; Mason, 2016). The evidence for observability is mixed, with some researchers finding evidence that it increases donations, both inside and outside the laboratory (Andreoni & Petrie, 2004; Soetevent, 2005; van Leeuwen & Wiepking, 2013), whilst other researchers find no correlation between the level of observability and the amount donated (Dufwenberg & Muren, 2006; Jones & Linardi, 2012). Thus, studies 1 and 2 include an observability manipulation to contribute to the evidence on the effects of observability on donations.
Present research
best explains the behavior? Conversely, if the greater-supported charity is favored, which explanation (conditional cooperation or quality signaling) is preferred? These questions are addressed in four studies.
Study 1
The first study explores whether participants donate more on average to a charity with more existing support than that with less existing support.
Method
Participants.
Table 1.
Table 1]
Design.
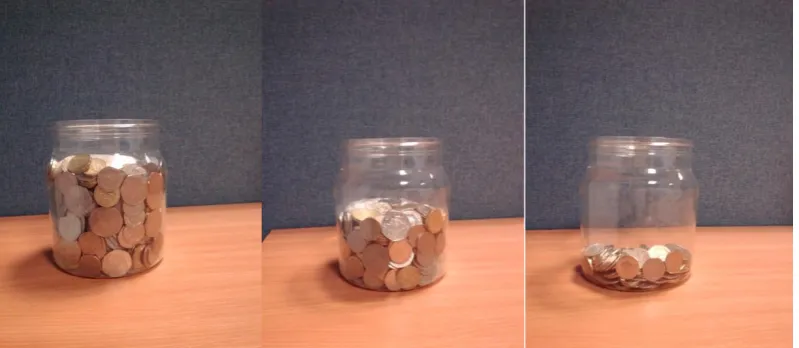
would remain private and anonymous. Degree of support was manipulated via a screen entitled ‘Donations made by participants so far’. On the screen, there were two clear perspex
jars filled with money. Each was labeled with the name of a charity (British Heart
Foundation: BHF or Cancer Research UK: CRUK). The degrees of support in the jars varied across three conditions: 1) BHF is 80% full and CRUK is 20% full, 2) BHF is 20% full and CRUK is 80% full and 3) BHF is 50% full and CRUK is 50% full (see Figure 1). The 50:50 condition was included to check whether one charity was preferred over another. Distribution of Resources is the amount of money in the jars within each of the three conditions
(20%:80%, 80%:20%, 50%:50%).
[Insert Figure 1 Here]
Procedure.
The study was conducted in three sequential stages: (1) a money earning task, (2) a charity dictator game and (3) an online questionnaire. In the money earning task, participants pressed the ‘z’ then ‘x’ key in that sequence for a period of five minutes (following Ariely, Bracha, & Meier, 2007). Participants had been told that to earn £4 they must make 200 ‘zx’ responses, which all the participants did (zx responses: M = 962.62, SD = 247.49). The next screen informed the participants whether their donation would be public or private.
completed the study, they each read out their donation decisions to the rest of the participants. The questionnaire collected data on gender, course of study, current level of study and two questionnaires: Moral Foundation Questionnaire (MFQ) and Reluctant Altruism scale. The MFQ and reluctant altruism scale are not of current interest so are not discussed further. Participants were reimbursed with any money they chose to keep and all charitable donations were given to the relevant charities.
Results & Discussion
The donations in the charity dictator game were not normally distributed (Skewness and Kurtosis test: χ² = 992.86, p < .001) therefore non-parametric methods were used (D’Agostino, Belanger, & D’Agostino Jr, 1990).
Charity Preference
The 50:50 conditions were included to identify any preference bias for donating to either the BHF or CRUK. There was no significant difference in either the amount donated to the BHF (M= £0.81, SD = £0.84) or CRUK (M= £0.86, SD = £0.75; Wilcoxon Signed Rank test: z = -1.26, p = .21) or in terms of the frequency of donations to the BHF (Number
Donated = 13) or CRUK (Number Donated = 16; Chi-Square Goodness of Fit test χ² = 0.31., p = .58). There was also no difference in the average amount donated between the 20-80% condition and 80-20% charity conditions (Wilcoxon Rank Sum test: z = -1.42, p = .15).
Preference Based on Distribution of Resources
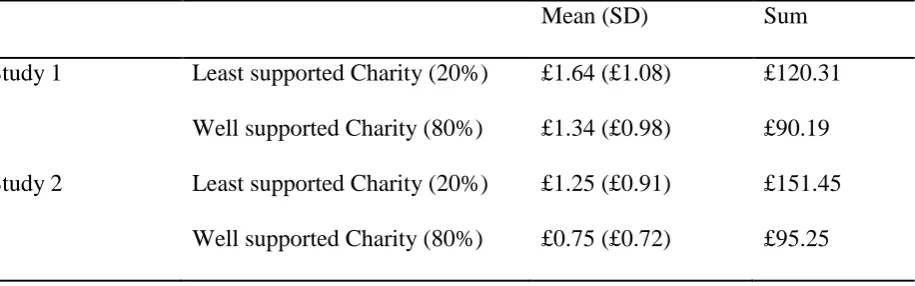
resources (80%) (M= £1.34, SD = £.98) (Wilcoxon Signed Rank test z = 2.89, p < .01; see Table 2). Over the course of the study, the charity with the least distribution of resources received an additional £30.12 (see Table 2).
Effects of Observability
There was no significant effect of observability between donations in the public (M = £1.78, SD = £1.54) and private conditions (M = £2.02, SD = £1.59; Wilcoxon Rank Sum test: z = 0.79, p = .43).
Thus, the overall results showed a preference to donate to the least supported charity compared to the more supported charity and no effect of observability on donations.
Study 2
This study aims to replicate the findings of study 1 regarding preference for the charity with least support (with three design changes). First, to check that the lack of an observability effect was not due to a relatively small sample size, a large number of participants were recruited. Second, we reduce the amount earned in the earning task to £3. Third, we did not include the 50:50 condition because study 1 showed no charity preference bias.
Method
Participants.
Design.
The study used a similar design to study 1 with a 2 (Observability: Public vs Private) by 2 (Degree of Support: 20:80 vs 80:20) by 2 (Distribution of Resources across 80:20) mixed design. The study consisted of three sequential stages: (1) money earning task, (2) charity dictator game (same as study 1) and (3) an online questionnaire. The questionnaire
collected gender, educational attainment, past charitable behavior, level of risk, level of trust and the reluctant altruism scale. The present research does not focus on these measures and they are not discussed further.
Procedure.
First, participants completed the money earning task where they were told that to earn £3 they must make 200 ‘zx’ responses (zx responses: M = 966.14, SD = 241.7). All
participants had over 200 zx responses and earned £3. The rest of the procedure is identical to study 1.
Results
Donations in the charity dictator game were not normally distributed (Skewness and Kurtosis test: χ² = 27.46, p < .001) so nonparametric methods were used.
Charity preference.
Preference Based on Distribution of Resources
Table 2 shows that the charity with the least distribution of resources received significantly higher average donations (M= £1.25 SD = £0.91) than the charity with the greater distribution of resources (M= £0.75 SD = £0.72) (Wilcox Signed Rank test, z = 4.76, p <0.001). The charity with the least distribution of resources received £56.20 more than the charity with the greater distribution of resources.
Effects of Observability.
As in study 1, there was no effect of observability on average amounts donated (z = 0.11, p = .91) (private M = £2.01, SD = £1.08 vs public M = £1.97, SD = £1.11).
[Insert Table 2 Here]
Combined Analysis of Study 1 and Study 2.
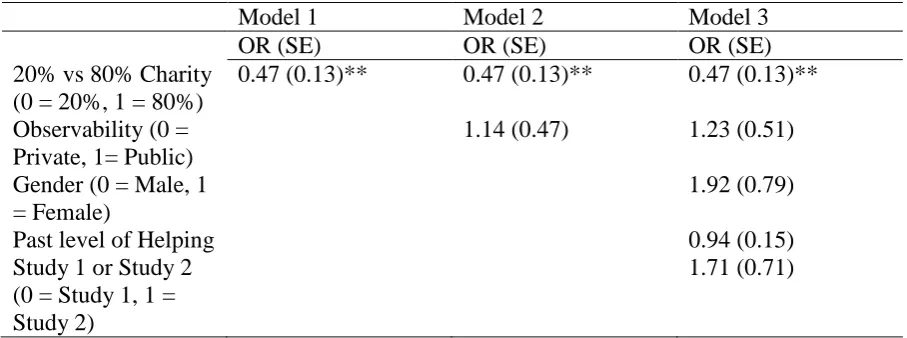
donated to the least supported charity (OR = 0.47, SE = 0.13, p < .01) whilst no effect of observability was found (OR = 1.23, SE = 0.13, p = .62).
[Insert Table 3 Here]
[Insert Table 4 Here]
Discussion
Both study 1 and study 2 extended the previous literature by showing that in a more naturalistic setting for crowd-sourcing where prior charitable donations are simultaneously observable, participants preference is to donate to the charity with the least prior support. Previous work by Borgloh et al., (2013) showed that when participants could review total annual revenue secured by charities they preferred to give to the poorer charity. Thus, we replicate the preference for a relatively under-resourced charity in a different funding context.
The findings of studies 1 and 2 also suggest that observability did not influence donating to a charity. This is at odds with the majority of the literature (Bereczkei, Birkas, & Kerekes, 2007; Haley & Fessler, 2005). However, the sample sizes were relatively small. As such, we combined the data from studies 1 and 2 giving a total N of 266 which is larger than sample sizes reported in other studies that found observability effects (Ariely et al., 2009, N = 161; Kataria & Regner, 2014, N = 185), however, the non-significant effect remained.
Study 3
the threshold should only change the behavior of a donor motivated to maximize impact versus support the underdog. Before the presence of a threshold, impact donors should give to the charity that has the least support to maximize any increase in the charity’s revenue
(Borgloh, Dannenberg, & Aretz, 2013). For an impact donor, when the amount of support already given makes the specified threshold for a charity achievable, their donation will have a greater impact with respect to achieving the goal, than when the amount of support already given means the specified threshold is far from achievable. In contrast, donors motivated to help the underdog should be more likely to donate to the charity with the least prior support, even though their donation is likely to have little impact on the charity achieving its specified threshold. To test this, we set up a study whereby five schools all needed to reach the same specified threshold but varied in how close they are to achieving it. Any donor population will be heterogeneous and made up of both underdog and impact donors, amongst others. We can, therefore, estimate those who are impact donors and those who are underdog donors by identifying those who give the most to the school that is closest to achieving its specified threshold (impact donors) versus those who give to the school that is furthest away from the specified threshold (underdog donors). Thus, we can examine the relative proportion of impact vs underdog donors.
Method
Sample.
decision task remunerated. Participants either earned up to £10 that they could keep or donate (some, none or all) to a local school in the form of book tokens.
Design and Procedure.
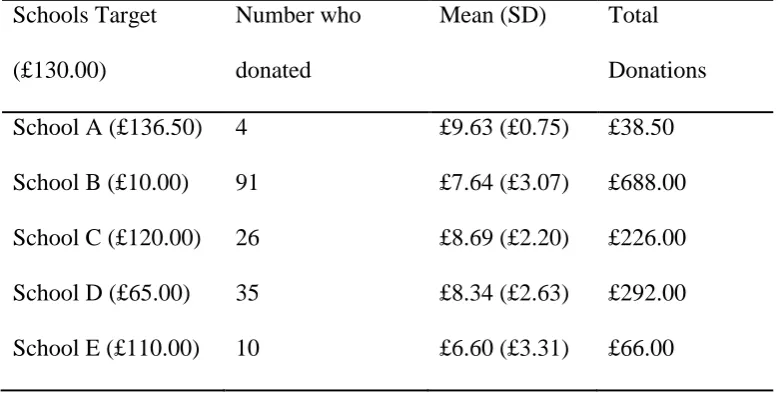
Participants were shown a hypothetical crowd fundraising profile describing five schools’ fundraising efforts to raise £130 to buy ten fruit trees to plant on its school grounds (based on a real-life campaign²). Participants were informed that five schools were running exactly the same campaign but had raised different amounts of money, and at that point, all schools had only two weeks left to raise the remaining amount (see Table 5). One school (School B) had the least previous support (£10) and was the furthest from the specified threshold of £130, meaning no single donor could help them achieve it. One school (school C) was £10 away from the specified threshold, meaning one donor could make up the difference. Thus, contributions to schools B and C are key to establishing the relative
proportion of the underdog and impact donors. Participants were informed that if a school did not raise the required £130 within a two-week period, they would not be able to buy the ten fruit trees. From the presentation of stimuli, there is no reason to believe that one school is less deserving of a donation than another. For example, participants were informed that the participating schools were identical in size, Ofsted reports³ and academic attainment. From this crowd funding project, participants had to a) decide whether they would be willing to donate to one of the five schools (a discrete choice task) and if they decided to donate to one of the schools, then b) decide how much of a £10 endowment they would like to give or keep for themselves.
Results
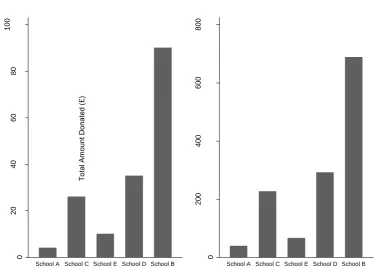
91 participants out of the 166 participants who donated to a school chose to donate (54.82%; see Table 6 and Figure 2Figure 1) to the school with the least previous support and furthest away from the threshold. A chi-square goodness of fit test, comparing the frequency of donations across the five schools against an expected frequency of chance (20%), indicated significant differences between the schools (χ² (4) = 144.81, p < .01). The school that had the least support, and was furthest from the specified threshold (School B), received a
significantly higher number of donations than the school just below the threshold (School C, z = 8.18, p < .001) and all other schools (Bonferroni corrections were applied) (School A z = 12.96, p < .001; School D z = 6.75, p < .001), p < .001; School E z = 11.39, p < .001)
(Sharpe, 2015). The total donated to the school that had raised the least (School B) was £688, which is more than double any other school (see Table 6 and Figure 1). However, this school also had the second to the lowest mean amount donated (M = £7.64 SD = £3.07), although a Kruskal-Wallis test showed there was no significant difference in the average levels of giving across the five schools (H (4) = 6.06, p = .20)
[Insert Table 6 Here]
[Insert Figure 2 Here]
Discussion
The introduction of the threshold indicated that most donors had a preference to contribute to the school with the least previous support and furthest away from the specified threshold. These are underdog donors. A smaller proportion donated to the school nearest the threshold and these are impact donors. However, while this effect was found for the
endowment leading to higher donations overall. Second, donors who want to maximize their impact must give £10 to push School C to the threshold, whilst donors wishing to support the least supported school cannot push it over the threshold with their contribution, hence they have more choice about the amount to donate.
Study 4
Study 3 provides some evidence that the preference for the least supported charity is due to the Underdog Effect. However, the Underdog Effect implies that there is an
assumption that other potential donors are less willing generally to donate to the underdog. Thus, this study presents exactly the same scenario used in study 3 but as well as asking participants which school they would choose and how much they would donate, we ask participants which school they believe others would choose, and how much they expect others would be willing to donate. Open-ended free-response questions were also asked to assess why the participant chose to donate to the school they selected and why they expected other people to donate to the school they selected. If the Underdog Effect drives the
preference for the least supported school, the open responses should include terms referring to its relative disadvantage (i.e. “has the least”) (Vandello, Goldschmied, & Richards, 2007) whereas, if donations are due to impact donating, responses should include making a
difference (e.g. “biggest impact”) (Duncan, 2004). We choose a free-response format to avoid creating any demand characteristics and constraining participants within theoretical
frameworks.
Method
Sample.
Design and Procedure.
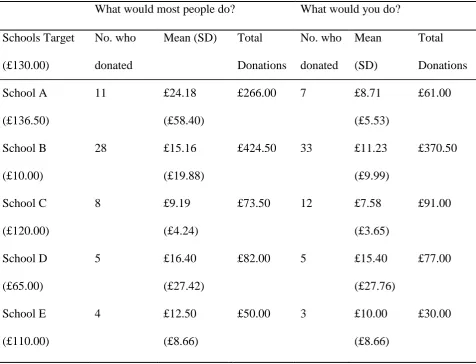
Participants were asked to read the same crowd fundraising scenario used in study 3. They were then asked to answer the following six questions: i) “what school do you think most people would give to?”, ii) “how much do you think others would give?”, iii) “why do you think most people would give to that school?” iv) “what school would you give to?”, v) “how much would you give?” and vi) “why would you give to this school?”.
Results
Four participants did not respond to either: “what school do you think most people would give to?” (N = 1) or “how much do you think others would give?” (N = 3) therefore, they were excluded from those analyses. Inter-rater reliability for the deductive content analysis on the qualitative responses was moderate (κ = .58, z = 8.26, p < .001) between the
two raters. All disagreements were discussed between the two raters until an agreement was reached.
School Preference.
E z = 7.13, p < .01) and expected others to do the same (School A z = 3.65, p < .05; School D z = 5.69, p < .05; School E z = 6.05, p < .05) These results replicate study 3 and indicate that the effect has a normative component.
[Insert Table 7 Here]
Qualitative Analyses of Relatively Poor School Preference. Responses to ‘why do you think most people would give?’
Of those who gave to the most supported school (School A: already over the threshold), the majority (8 out of 12; 67%) focused on the fact that it had raised the most money (see Table 8). Whereas those who donated to the least supported school (School B) were concerned most with the relative disadvantage the school was at (24 out of 30; 80%). For example, one respondent wrote, "It is furthest away from the target." Those who donated to the school just below the threshold (School C) did so to a) make a difference (2 out of 8; 25%) and b) to help it reach its target (8 out 8; 100%). One participant wrote, "by donating the final £10 I feel like I am making a difference."
Responses to: ‘why you gave to this school?’
Choosing the most supported school (School A) was partly explained by quality signaling, with 2 out of 7 (29%) focusing on the fact that it had raised the most. The dominant response for giving to the least supported school (School B) was due to its relative
[Insert Table 8 here]
Discussion
These results replicated the effects found in study 3, that most people choose to donate to the least supported school compared to any other school. The open responses provide support for the idea that participants gave to the least supported school because they were the underdog at a relative disadvantage. A small number of participants (4 out of 33; 12%) in response to why they, not most others, would give to the least supported school suggested they were motivated by equality so were donating to school B to reduce its
shortfall in donations. This indicates that there are competing explanations for supporting the least supported school with the dominant motive being the Underdog Effect. An unusual
finding in this data concerns the donations made to school A, which has already reached its target. Participants’ qualitative responses revealed that people took the amount that ‘school A’ had already raised as a sign of its quality. This motivation is consistent with Vesterlund’s, (2003) idea that contributions to charity can be perceived by potential donors as a sign of the charity’s quality and thus make it appear more attractive for them to donate to. One caveat to
the findings of the qualitative analysis is that self-report responses are subject to bias (i.e., demand characteristics). However, the strength of study 4 is that it allows us to move beyond inferring donor motivations from behavioral decisions alone, to directly recording
motivations. Indeed, the results of the choice task replicate the results of study 3, thus we can have some confidence in the validity of the motivations reported.
General Discussion
This is important as many online fundraising campaigns set a threshold to be attained. Two possible explanations for the preference of selecting the charity/organization with the least support have been suggested (i.e. ‘Impact Model’ and the ‘Underdog Effect’). The results provide support for the heterogeneity of preferences, with the Underdog Effect being the most likely explanation for giving to a charity with least support.
However, other studies find that the charity with greater support is preferred. Why is this? Studies that find a preference for giving to the more supported charity have focused on charity campaigns that may have an immediate benefit to the donors. The Frey and Meier (2004) study focused on students contributing to a student welfare scheme, the Shang and Croson (2009) study examined contributions from supporters/listeners to a local public radio station and Martin and Randal (2008) explored support to an art gallery by visitors. In all these examples the donor could immediately benefit and as such may be more inclined to help when they see others contributing as ultimately this will help them (i.e. they receive the hardship payments, their public radio station stays open, and their gallery stays open). In contrast, our study and the Borgloh et al. (2013) study do not have this immediate benefit to the donor. In the Borgloh et al. (2013) study, the charities were described in terms of general categories (e.g. medical research etc.) and as such, the participants would be less likely to know if they could personally benefit. In our studies, the charities were either specific medical charities (Cancer or Heart Disease), that young students are unlikely to have any immediate benefit from. Similarly, in the school’s crowdsourcing study, the participants will have no immediate benefit from donating to the schools. So it may be the case that
conditional cooperation operates when there is an immediate personal benefit favoring the better-supported charity and the ‘Underdog Effect’ is observed when there is no immediate personal benefit (Kim et al., 2008). Therefore, we hypothesize that a charity based
unattainable by a single donation and (2) when donors do not directly benefit from their donations. This will be the case for a charity that is seen as deserving but disadvantaged with respect to resources.
Implications
This paper is important because it shows that when people have social information of the levels of support a charity receives and can compare this information across multiple charities they prefer to donate to the least supported charity. This suggests that fundraisers should take care to present their campaigns in real world and online contexts where their charity will appear less supported compared to their competitors. Conversely, if a charity is well supported and cannot change the real world or online contexts in which it presents itself, it might benefit from highlighting aspects of its current situation that make it appear at an undeserved disadvantage relative to some of its competitors. One way this could be achieved is by developing an underdog biography (Nagar, 2017). The work of Paharia, Keinan, Avery, and Schor, (2011) shows that businesses that managed to develop an underdog biography enjoyed increased consumer purchasing and greater brand loyalty. Theoretically, this paper demonstrates that the underdog effect is an important and underexplored motivation that charities could target to increase support and enhance their revenues.
Conclusions
equally deserving. Further work is needed to explore how factors that are known to influence donation decisions like charities effective use of resources, charities impact on the cause, perceived worthiness and their reputation moderate the ‘Underdog Effect’(Bekkers & Wiepking, 2010). In particular, Michniewicz and Vandello (2013) showed that unfairly disadvantaged job applicants were rated by participants as attractive, compared to fairly disadvantaged job applications. Future work could examine the additional impact of the fairness of the disadvantage in accentuating the ‘Underdog Effect’.
End Notes
¹ Past level of helping behavior is a composite sum score measure of six yes/no items designed to measure charitable activity. For example, “Have you ever taken part in any of these charitable actives: Fundraising events, donating blood, helping in old folks home, helping in children home, donating money, and helping in a hospital”)
² The crowdfunding pages were from a project called Fruitshare which was a TV Campaign launched by Hugh Fearnely Whittingstall to get children growing fruit trees at schools across Britain. The campaign raised £13,790 with a total of 97 projects (CrowdFunder, 2013).
³Ofsted is an acronym well known in these samples for the ‘Office for Standards in Education, Children’s Services and Skills’. They inspect schools assessing the quality of
education provision provided (see www.gov.uk/government/organisations/ofsted).
Acknowledgements
References
Andreoni, J., & Petrie, R. (2004). Public goods experiments without confidentiality: a glimpse into fund-raising. Journal of Public Economics, 88(7–8), 1605–1623.
https://doi.org/10.1016/S0047-2727(03)00040-9
Ariely, D., Bracha, A., & Meier, S. (2007). Doing good or doing Well ? Image motivation and
monetary incentives in behaving prosocially. Retrieved from
http://people.duke.edu/~dandan/Papers/Other/doingGoodOrWell.pdf
Bekkers, R., & Wiepking, P. (2010). A Literature Review of Empirical Studies of Philanthropy: Eight Mechanisms That Drive Charitable Giving. Nonprofit and Voluntary Sector
Quarterly (Vol. 40). https://doi.org/10.1177/0899764010380927
Bereczkei, T., Birkas, B., & Kerekes, Z. (2007). Public charity offer as a proximate factor of evolved reputation-building strategy: an experimental analysis of a real-life situation.
Evolution and Human Behavior, 28(4), 277–284.
https://doi.org/10.1016/j.evolhumbehav.2007.04.002
Borgloh, S., Dannenberg, A., & Aretz, B. (2013). Small is beautiful—Experimental evidence of donors’ preferences for charities. Economics Letters, 120(2), 242–244.
https://doi.org/10.1016/j.econlet.2013.04.011
Butt, H., & Shah, R. (2012). Why technology and innovation are key to increasing charity donations. Retrieved from
http://www.theguardian.com/voluntary-sector-network/2012/nov/29/technology-innovation-increase-charity-donations CrowdFunder. (2013). Fruitshare Project. Retrieved from
http://www.crowdfunder.co.uk/campaign/fruitshare
and Informative Tests of Normality. The American Statistician, 44(4), 316–321. de Hoop, T., van Kempen, L., & Fort, R. (2012). Do Cash Transfers Crowd Out Community
Investment in Public Goods? Lessons from a Field Experiment on Health Education.
Nonprofit and Voluntary Sector Quarterly, 41(2), 232–256.
https://doi.org/10.1177/0899764011401414
Dufwenberg, M., & Muren, A. (2006). Generosity, anonymity, gender. Journal of Economic
Behavior & Organization, 61(1), 42–49. https://doi.org/10.1016/j.jebo.2004.11.007
Duncan, B. (2004). A theory of impact philanthropy. Journal of Public Economics, 88(9–10), 2159–2180. https://doi.org/10.1016/S0047-2727(03)00037-9
Fischbacher, U., Gachter, S., & Fehr, E. (2001). Are people conditionally cooperative ? Evidence from a public goods experiment. Economics Letters, 71, 397–404.
Frey, B. S., & Meier, S. (2004). Social Comparisons and Pro-social Behavior : Testing in a Field Experiment “ Conditional Cooperation .” The American Economic Review, 94(5), 1717– 1722.
Goldschmied, N. P., & Vandello, J. a. (2012). The Future is Bright: The Underdog Label, Availability, and Optimism. Basic and Applied Social Psychology, 34(May 2015), 34–43. https://doi.org/10.1080/01973533.2011.637726
Goldschmied, N., & Vandello, J. (2009). The Advantage of Disadvantage: Underdogs in the Political Arena. Basic and Applied Social Psychology, 31(1), 24–31.
https://doi.org/10.1080/01973530802659810
Haley, K. J., & Fessler, D. M. T. (2005). Nobody’s watching? Subtle cues affect generosity in an anonymous economic game. Evolution and Human Behavior, 26(3), 245–256. https://doi.org/10.1016/j.evolhumbehav.2005.01.002
Heterogeneity in Reputation Concerns, (412). Retrieved from
http://www.linardi.gspia.pitt.edu/wp-content/uploads/2012/07/Wallflowers_JonesLinardi2012.pdf
Kim, J., Allison, S. T., Eylon, D., Goethals, G. R., Markus, M. J., Hindle, S. M., & McGuire, H. a. (2008a). Rooting for (and then abandoning) the underdog. Journal of Applied Social
Psychology, 38, 2550–2573. https://doi.org/10.1111/j.1559-1816.2008.00403.x
Martin, R., & Randal, J. (2008). How is donation behaviour affected by the donations of others? Journal of Economic Behavior & Organization, 67(1), 228–238.
https://doi.org/10.1016/j.jebo.2007.08.001
Mason, D. P. (2016). Recognition and Cross-Cultural Communications as Motivators for Charitable Giving A Field Experiment. Nonprofit and Voluntary Sector Quarterly, 45(1), 192–2014. https://doi.org/10.1177/0899764015576408
Nagar, K. (2017). Support for the underdog brand biography: Effects on consumer attitude and behavior. Journal of Marketing Communications.
https://doi.org/10.1080/13527266.2017.1356349doi.org/10.1080/13527266.2017.135 6349
Shirai, M. (2017). Underdog effects: the role of consumption domain and retail crowding.
Journal of Consumer Marketing, 34(5), 384–392.
https://doi.org/10.1108/JCM-07-2016-1872
Soetevent, A. R. (2005). Anonymity in giving in a natural context—a field experiment in 30 churches. Journal of Public Economics, 89(11–12), 2301–2323.
https://doi.org/10.1016/j.jpubeco.2004.11.002
https://doi.org/10.1177/0899764012467084
Vandello, J. a, Goldschmied, N. P., & Richards, D. a R. (2007). The appeal of the underdog.
Personality and Social Psychology Bulletin, 33, 1603–1616.
https://doi.org/10.1177/0146167207307488
Vesterlund, L. (2003). The informational value of sequential fundraising. Journal of Public
Table 1
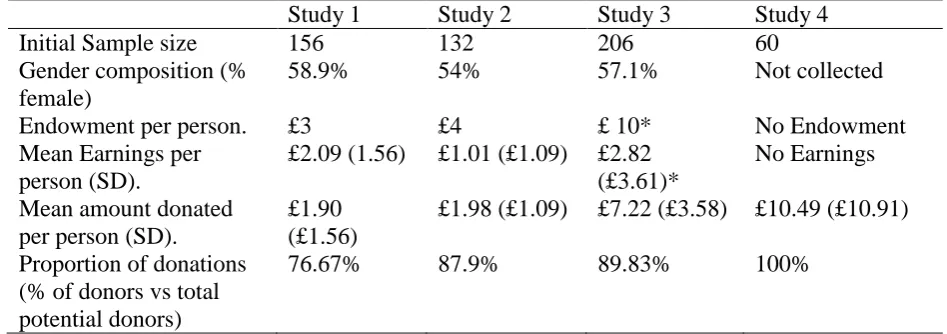
Comparison of sample size, gender composition, average endowment and earnings across all
four studies.
Study 1 Study 2 Study 3 Study 4
Initial Sample size 156 132 206 60
Gender composition (% female)
58.9% 54% 57.1% Not collected
Endowment per person. £3 £4 £ 10* No Endowment
Mean Earnings per person (SD).
£2.09 (1.56) £1.01 (£1.09) £2.82 (£3.61)*
No Earnings Mean amount donated
per person (SD).
£1.90 (£1.56)
£1.98 (£1.09) £7.22 (£3.58) £10.49 (£10.91) Proportion of donations
(% of donors vs total potential donors)
76.67% 87.9% 89.83% 100%
Table 2
Average and total donations to Well and Poorly supported Charities in Study 1 and Study 2
Mean (SD) Sum
Study 1 Least supported Charity (20%) £1.64 (£1.08) £120.31 Well supported Charity (80%) £1.34 (£0.98) £90.19 Study 2 Least supported Charity (20%) £1.25 (£0.91) £151.45
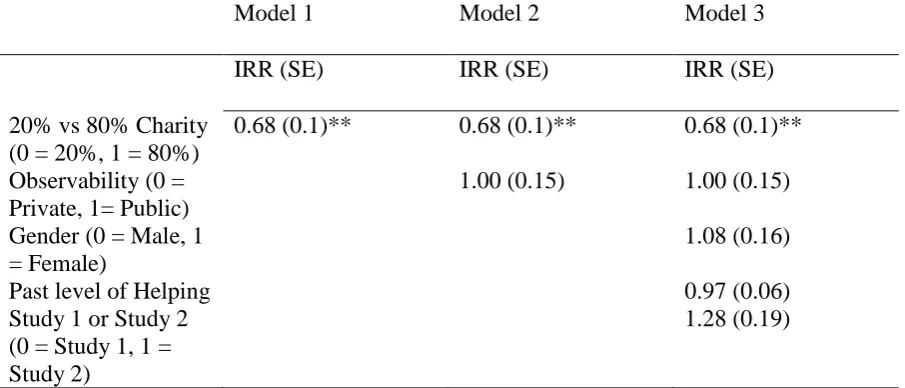
Table 3
A multilevel negative binomial regression model exploring the effect that the Underdog Effect
has on donations made to charity during studies 1 and 2.
Model 1 Model 2 Model 3
IRR (SE) IRR (SE) IRR (SE)
20% vs 80% Charity (0 = 20%, 1 = 80%)
0.68 (0.1)** 0.68 (0.1)** 0.68 (0.1)** Observability (0 =
Private, 1= Public)
1.00 (0.15) 1.00 (0.15) Gender (0 = Male, 1
= Female)
1.08 (0.16)
Past level of Helping 0.97 (0.06)
Study 1 or Study 2 (0 = Study 1, 1 = Study 2)
1.28 (0.19)
Table 4
A multilevel logistic regression model exploring the effect that the Underdog Effect has on
the frequency of donations to charity during studies 1 and 2.
Model 1 Model 2 Model 3
OR (SE) OR (SE) OR (SE)
20% vs 80% Charity (0 = 20%, 1 = 80%)
0.47 (0.13)** 0.47 (0.13)** 0.47 (0.13)** Observability (0 =
Private, 1= Public)
1.14 (0.47) 1.23 (0.51) Gender (0 = Male, 1
= Female)
1.92 (0.79)
Past level of Helping 0.94 (0.15)
Study 1 or Study 2 (0 = Study 1, 1 = Study 2)
1.71 (0.71)
Note 3.OR = Incident Rate Ratio’s, SE = Standard Error, * = p < .05, ** = p < .01 .Model 1 χ²(1) =
Table 5
The amount raised by the five different schools over the first week of the campaign.
The amount raised so far by the different schools are:
Table 6
Average and Total donations to the five schools.
Schools Target (£130.00)
Number who donated
Mean (SD) Total Donations
Table 7
Average and total donations to the five schools across what most people would do and what
the participant would do.
What would most people do? What would you do?
Schools Target (£130.00)
No. who donated
Mean (SD) Total Donations No. who donated Mean (SD) Total Donations School A (£136.50)
11 £24.18
(£58.40)
£266.00 7 £8.71
(£5.53)
£61.00
School B (£10.00)
28 £15.16
(£19.88)
£424.50 33 £11.23
(£9.99)
£370.50
School C (£120.00)
8 £9.19
(£4.24)
£73.50 12 £7.58
(£3.65)
£91.00
School D (£65.00)
5 £16.40
(£27.42)
£82.00 5 £15.40
(£27.76)
£77.00
School E (£110.00)
4 £12.50
(£8.66)
£50.00 3 £10.00
(£8.66)
Table 8
Number and percentage of donors whose qualitative responses indicated Underdog, Impact
donor or Equality motivations driving their choice of school.
Theories
Underdog Impact Donor Equality Quality
Signalling Constructs Relative
Disadvantage
Making a difference
Easy Reach of Target
Equality Quality Signalling Examples Least, Fewer
etc. Difference, Change etc. Achieve, Closest etc. Equal, Same etc. Most raised. Why would most people give? (N = 59)
School A N = 12 (n (%))
0 (0%) 0 (0%) 0 (0%) 0 (0%) 8 (67%)
School B N = 30 (n (%))
24 (80%) 0 (0%) 0 (0%) 1( 3.33%) 0 (0%)
School C N = 8 (n (%))
0 (0%) 2 (25%) 8 (100%) 0 (0%) 1 (13%)
School D N = 5
(n (%))
0 (0%) 0 (0%) 3 (60%) 0 (0%) 0 (0%)
School E N = 4 (n (%))
0 (0%) 0 (0%) 1 (25%) 0 (0%) 0 (0%)
School A N =7 (n (%))
0 (0%) 0 (0%) 0 (0%) 0 (0%) 2 (29%)
School B N = 33 (n (%))
22 (67%) 1(3%) 0 (0%) 4(12%) 0 (0%)
School C N = 12 (n (%))
0 (0%) 1 (8%) 10 (83%) 0 (0%) 1 (8.33%)
School D N = 5 (n (%))
0 (0%) 0 (0%) 3 (60%) 0 (0%) 0 (0%)
School E N = 3 (n (%))
0 (0%) 0 (0%) 1 (33%) 0 (0%) 0 (0%)
Note 4. Words used to record relative disadvantage were: Least/Fewer/ Lower/ Less/Furthest. The words
Figure 1. The total frequency and total amount (£) donated to each school. 0 20 40 60 80 100 Fr e q u e n c y o f P e o p le w h o D o n a te d ( Y e s /N o )
School A School C School E School D School B
0 200 400 600 800 To ta l A m ou nt D on at ed ( £)
School A School C School E School D School B