This is a repository copy of
Polarization filtering for automatic picking of seismic data and
improved converted phase detection
.
White Rose Research Online URL for this paper:
http://eprints.whiterose.ac.uk/430/
Article:
Reading, A.M., Mao, W.J. and Gubbins, D. (2001) Polarization filtering for automatic
picking of seismic data and improved converted phase detection. Geophysical Journal
International, 147 (1). pp. 227-234. ISSN 0956-540X
https://doi.org/10.1046/j.1365-246X.2001.00501.x
[email protected]
https://eprints.whiterose.ac.uk/
Reuse
See Attached
Takedown
If you consider content in White Rose Research Online to be in breach of UK law, please notify us by
R E S E A R C H N O T E
Polarization filtering for automatic picking of seismic data and
improved converted phase detection
Anya M. Reading,* Weijian Mao
{
and David Gubbins
Department of Earth Sciences, University of Leeds, Leeds,LS2 9JT,UK
Accepted 2001 April 30. Received 2001 March 19; in original form 2000 August 17
S U M M A R Y
Data-adaptive polarization filtering is used to improve the detection of converted seismic phases. Both direct waves and mode-convertedPSandSParrivals may be more easily picked on the filtered records. An autopicking routine is applied that cuts the polarization filtered traces according to the modelled traveltime of each phase through an initial structure. Use of forward-modelled, source–receiver times reduces the likelihood of an automatic pick being incorrectly made on spurious spikes in the polarization filtered trace. It is therefore a realistic way of automatically picking multiphase data sets or, more generally, linearly polarized phases where low signal-to-noise ratios may be encountered. The method is suitable for any three-component seismic data and is here applied to local earthquakes recorded in North Island, New Zealand. Intermediate energy is observed between the directPandSarrivals due to phase conversion at the interface between the Indo-Australian and subducting Pacific plates. The amplitudes of these converted arrivals are often too low for them to be identified above the P-wave coda but polarization filtering of the records enables the yield of converted phase picks to be greatly increased.
Key words:automatic picking, converted phase, New Zealand, polarization filtering.
1 I N T R O D U C T I O N
Regions of the Earth characterized by major structural dis-continuities lend themselves to investigation using converted seismic phases. The traveltime of the converted arrival places a constraint on the depth of the converting interface and hence improves the modelled seismic velocity structure. Converted phases have been successfully used to model discontinuities within the earth on a variety of scales from mantle discon-tinuities (Shearer 1995; Thirotet al.1998) and deep subducted slabs (Nakamuraet al.1998; Helffrich & Stein 1993) to shallower features in both continental and oceanic lithosphere (Jones & Phinney 1998; Hasegawaet al.1994; Stephenset al.1990).
In order to use the information inherent in converted arrivals, it has previously been necessary to pick large data sets by hand, a time-consuming process, before applying a tomo-graphic inversion routine. Moreover, the amplitude of a
con-verted phase is often less than that of theP-wave coda, making it difficult to see on the seismogram. This work aims to improve picking speed and converted phase yield, and is particularly suited to data sets used for multiphase tomography.
1.1 Tectonic background and motivation
In southern North Island, New Zealand, at the boundary between the Australian and subducting Pacific plate [see the companion paper, Readinget al.(2001), for a full summary of the tectonic setting] intermediate phases occurring between the directPandSarrivals have been observed for several decades (Eberhart-Phillips & Reyners 1999; Ansell & Bannister 1996; Richardson 1989; Bannister 1988; Kayal 1986; Calhaemet al.
1977; Adams & Ferris 1976; Smith 1970). They occur for earthquakes located at depths below the top of the subducted slab and have arrival times consistent with phase conversion at the interface between the top of the slab and the overlying plate (Reading 1996). The ray geometry is shown in Fig. 1. Earthquakes with a thrust-fault focal mechanism, which might help define the location of the plate interface, are rare (Ansell & Bannister 1996) and the interface is approximated by the upper
* Now at: Research School of Earth Sciences, Australian National University, Canberra, ACT 0200, Australia. E-mail: [email protected]
envelope of the diffuse Wadati–Benioff zone of seismicity. The depth of the upper surface of the slab could be directly investigated using the traveltimes of converted arrivals if they were identified above theP-wave coda in sufficient numbers.
1.2 Polarization filtering
Polarization analysis may be applied to three-component data to improve phase identification significantly and to facilitate the use of automatic detection algorithms. Consider the problem of a converted-mode wave and the scattered arrivals of the
P-wave coda arriving nearly simultaneously at a recording station. If the frequency content of the converted-mode wave is different then it may be separated by using a frequency-domain approach (Parket al.1987). If it is necessary to separate waves of similar frequency content arriving close together (for example, multiple conversions at successive crustal discontinuities) then the time-domain method of Bataille & Chui (1991) is more appropriate. If the scattered waves have a broad frequency content then a method based on data variance distribution may be used (Roberts & Christoffersson 1991; Ruud & Husebye 1992). Alternatively (as used here) data-adaptive filters may be constructed on the basis that the noise is less polarized than the signal of interest (Samson & Olson 1981). Other methods, e.g. Wagner & Owens (1996) and references therein, may be more suitable if array processing methods are to be applied.
1.3 Automatic picking
Automated phase detection and traveltime picking forPwaves has been carried out for some time (e.g. Allen 1978). In principle, many such algorithms should also pickSwaves, but as they arrive (for local earthquakes) during theP-wave coda, the success rate is lower. Conventional means of automatic picking have such a poor success rate of picking converted arrivals that this is seldom even attempted. Problems in automatically picking later phases, often in the presence of other energy from the same source, are common to both teleseismic and local recordings. A review of the methods used to detect teleseismic phases is given by Witherset al.(1998). Time-domain approaches based on short-term average verses long-term average are widespread (Ruud & Husebye 1992;
Allen 1982; Earle & Shearer 1994; Patane & Ferrari 1999) but it is also possible to use frequency-domain techniques (Gledhill 1985), particle motion considerations (Klumpen & Joswig 1993; Fedorenko & Husebye 1999), fractal-based algorithms (Boschettiet al. 1996) and neural networks (Dai & MacBeth 1995; Zhao & Takano 1999). Cepstral techniques, which have been used to identify depth phases in the P-wave coda (Woodgold 1999), are not appropriate for converted phases on local records since the method requires a coda several times longer than the differential time between direct and reflected (or converted) wave. The work in this paper uses polarization filtering followed by a time-domain picking method to improve the automatic detection of direct and, most importantly, converted phase arrivals.
2 D A T A
[image:3.595.49.288.50.196.2]Records from the Leeds Tararua (LT) broad-band, three-component array (Stuartet al.1995) augmented by temporary short-period, three-component instruments (Reading 1996) and three-component stations from the New Zealand national network are used to sample the subducted slab across the width of southern North Island, New Zealand (Fig. 2). The stations are used independently, rather than as units of an array. During the period of data acquisition (4 February–10 April 1992), 301 earthquakes occurred within the 150r150 km region defining a box (shown in Fig. 2) oriented with sides parallel to the dip of the subducted slab as determined by Robinson (1986). 10–15 station records from the whole 301-event data set show intermediate phases of comparable amplitude to the direct phases (Fig. 3), which have been interpreted as clear converted phases. On records from about 60 events, there is an indication of intermediate energy on two or more stations (ruling out the possibility of a shallow conversion near the receiver) but it is more difficult to assign arrival times to the phases.
Figure 1.Converted phase ray geometry for an earthquake occurring in the subducted Pacific plate underneath southern North Island, New Zealand.
Figure 2. Map of the study area (boxed) in southern North Island, New Zealand, and seismic stations used.
228 A. M. Reading, W. Mao and D. Gubbins
[image:3.595.309.552.478.707.2]3 M E T H O D S
3.1 Manual picking procedure
Direct and converted arrivals were first picked manually after the application of a 1 Hz high-pass filter to the data (SAC 1992) and arrival times written to an ASCII file. Even for this relatively small data set, over 10 000 traces were closely examined. Particular interest was paid to intermediate phases, thus increasing the time taken to pick the data set. From these observed traveltime values,Tobs, traveltime residuals,Tres, were calculated with respect to an initial 2-D model structure based
on that of Robinson (1986) such that
Tres¼TobsÿTmod: (1)
[image:4.595.137.466.54.537.2]This gave a carefully analysed data set for comparison with later polarization-filtered and automatically picked records. Some converted arrivals could be picked manually from the high-pass-filtered data but many more remained that could just be seen, although they could not be picked, and it was likely that still more existed that were totally swamped by thePcoda and could not be seen at all. The following methods were applied with the aim of picking more, and more accurate, converted phase arrival times.
3.2 Polarization filtering
The polarization filter was designed, following Samson & Olson (1981), using the degree of polarization of the input. LetFN denote the discrete Fourier transform onNpoints,
Xk¼½FNð Þx k¼
X
Nÿ1
l¼0
xleÿ2
nikl=N, (2)
andFx1
N the inverse discrete Fourier transform,
xl¼ Fÿ1Nð ÞX
l¼ 1 N X Nÿ1 k¼0
Xke2nikl=N: (3)
The input data were windowed to produce segments (0.2 s long in this case) ofNsamples. Each segment was transformed to giveZ(k,l), wherekcountsx1is frequency andlcounts is the
time of the centre of the window.
The 3r3 spectral matrix, S, was formed from the three components ofZ:
Sijðk,lÞ ¼Ziðk,lÞZjðk,lÞ: (4)
A high degree of linear polarization in the window is indicated by a single, dominant eigenvaluelmax, such that the quantity
Pðk,lÞ ¼ jmax
j1þj2þj3ƒ1 (5)
is equal to unity for perfectly linearly polarized signals. All eigenvalues are non-negative (Samson 1973).P(k,l) raised to an appropriate powerg(typically between 4 and 6) defines the filter in the frequency domain for the time windowl.
Filtering is accomplished by multiplication in the frequency domain and inverse transformation to give outputyl:
yl¼Fÿ1N½Zðk,lÞPgðk,lÞ: (6)
The filtered trace is computed by sliding the window through the entire seismogram.
3.3 Automatic picking procedure
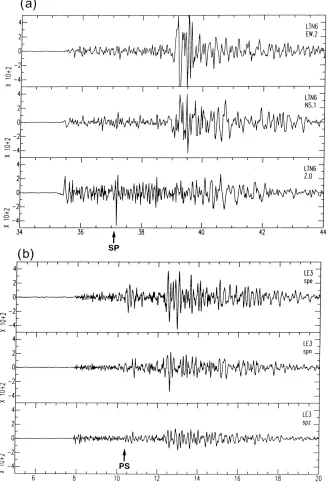
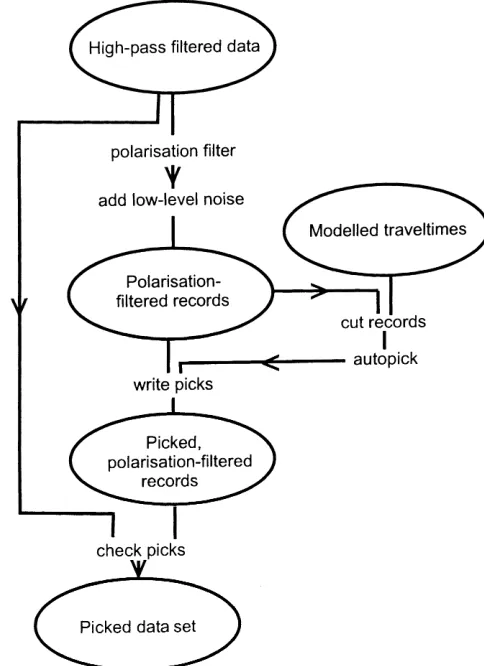
Fig. 4 shows the stages in the autopicking process. Three-component records were high-pass filtered, then the data-adaptive polarization filtering algorithm was applied. Examples of high-pass filtered and polarization-filtered traces are shown in Figs 5(a) and (b). Although the polarization-filtered trace is quite acceptable for manual picking, an automatic algorithm will pick very small excursions from the zero level. A low level of synthetic background noise was added to the polarization-filtered data to minimize mispicks against the near-zero back-ground level on the polarization-filtered traces (Fig. 5c). In this case, a 10 Hz sine wave at approximately one-tenth of the amplitude of the smallest signal of interest was added, successfully preventing many mispicks. An alternative for some autopicking algorithms would be to assign a threshold value below which picks are discarded. The standard SAC auto-picking algorithm,apk(SAC 1992), compares functions based on long- and short-term averages, so a fixed threshold approach is not used here.
The autopicker was applied to small sections (length 4 s) of data cut from each individual trace. The cut times were determined from theP- andS-wave traveltimes between source/
receiver pairs calculated from the 2-D seismic velocity model of the area. These traveltimes were already determined in order to calculate the residual traveltimes for subsequent inversion. The automatic picking of arrival times might thus be viewed as part of the first stage of the tomography.
Polarization filtering highlights changes in the degree of polarization along the trace. The data generally showed sharp breaks corresponding to the arrival of the incoming phases. This allowed automatic picking of later-arriving phases using simple short-term average/long-term average procedures. Many of the difficulties traditionally associated with automatic pick-ing algorithms, especially when applied to later or emergent phases, were thus removed and approximately 3–4 times as many converted phases can be seen in the polarization-filtered traces compared with the unfiltered traces. It is also possible to automate the picking of converted phases. PickingSPand
[image:5.595.306.548.51.384.2]PS phases from the polarization-filtered data requires non-standard parameters (Allen 1978) of the SAC apk function (SAC 1992). These parameters allow for shorter events and less pronounced amplitude changes than the default function and are therefore suited to intermediate phases. The addition of a low level of ‘noise’ to the polarization-filtered trace remains essential to minimize mispicks of very small-amplitude excursions. Cutting a section of the trace containing only the converted phase of interest is difficult since they often occur close to the directPandSphases. If the direct phases are picked first, the section of seismogram supplied to the autopicker
Figure 4. Flow diagram showing the stages in polarization filtering and picking from the filtered traces.
230 A. M. Reading, W. Mao and D. Gubbins
should be based on the correctP-arrival pick. Thus the trace examined for converted-mode energy will not include the onset of the direct arrival. Analyst review of direct and converted autopicks remains important, but, if the autopicking algorithm operates with a high degree of success, significant time is saved over a totally manual procedure. The few spurious auto-matic picks were deleted and manually re-picked using the
polarization-filtered traces. The key to effective automatic picking thus lies in the combination of polarization filtering and careful cutting of the data. It is rare that the autopicker is triggered by noise since the window around the arrival of the
[image:6.595.141.455.47.271.2]P or S phase is only a few seconds long and the impulsive nature of the polarization-filtered arrivals gives a good chance of a correct pick.
Figure 5.Traces showing the addition of a low level of synthetic noise to minimize mispicks against the near-zero level of the polarization-filtered trace. The records show aParrival and coda after the application of (a) a high-pass filter, (b) a polarization filter and (c) synthetic noise. Without adding noise, the small excursion just before 43 s (from the start of the file) would be picked by the autopicker.
[image:6.595.119.482.421.692.2]4 R E S U L T S
4.1 Automatic picking and converted phase yield
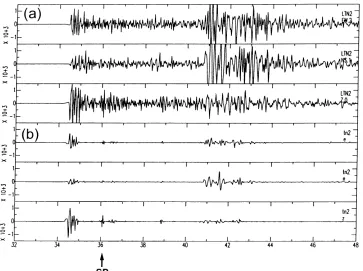
98 per cent of the P arrivals and 95 per cent of S arrivals that were picked manually from high-pass-filtered records were successfully picked automatically after polarization filtering. Many more intermediate arrivals can be seen on the polarization filtered data in comparison with those on the manually picked traces. Without polarization filtering they number 455SPand 83PSphases; with filtering, this count improves to 528SPand 482PSphases.PSwaves, arriving just prior toSwaves, are the hardest to pick manually and gave a vastly improved yield after polarization filtering. The energy in theSP orPSconverted arrivals is more linearly polarized than the predominantly scattered energy in theP-wave coda; they are therefore much easier to identify and pick than on the original high-pass-filtered plots. Fig. 6 is an example of an intermediate phase shown on the original and polarization-filtered records for comparison. It is a clear example of anSP arrival that would have been difficult to pick without first applying a polarization filter.
The automatic picking routine fails when there is some other polarized energy in the cut section passed to the autopicker and the pick is made wrongly on this extra phase. Such energy is likely to be scattered or diffracted between source and receiver. This is the main cause of mispicks and hence it is not instructive to establish a reliability measure in the form of signal-to-noise ratio or the degree of polarization.
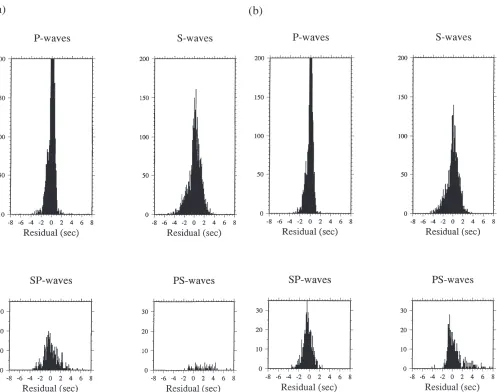
The full set of traveltime residuals,tobsxtmod(the difference between observed traveltimes and the traveltime calculated from the initial input model), is shown in Fig. 7. They are shown for both the hand-picked data set and that prepared by polarization filtering and autopicking. The spread of the SP
[image:7.595.55.552.313.705.2]residual distribution is narrower in Fig. 7(b), showing that the converted phase picks are more accurate as well as larger in number. All picks are included in these plots, although the few with large residuals (due to book-keeping errors, usually a mis-match between an LE array record and an LT array archived event) would not carry through to any subsequent analysis. A component of the slight negative skew in theS-wave plots may be due to a few picks being made early whenPSarrivals were misidentified asSarrivals. Anisotropy is also a source of scatter
Figure 7.Histograms of traveltime residuals of data picked (a) manually from high-pass-filtered records and (b) from the same data set by polarization filtering and automatic picking. The polarization filtering vastly improves both the yield and accuracy of theSPandPSpicks.
232 A. M. Reading, W. Mao and D. Gubbins
in theS-wave plots; in the shallow region between the sources and receivers in this study the effects are largely unsystematic (Gledhill & Stuart 1996).
5 D I S C U S S I O N
5.1 Application and development of methods
The value of polarization filtering in the detection of seismic phase arrivals reported by Fedorenko & Husebye (1999) is confirmed by this study. In addition, this paper highlights the improvements that may be made in the yield of mode-converted phases. This approach to automatic picking is particularly useful in tomographic studies where approximate theoretical arrival times are known; see e.g. the companion paper (Readinget al.2001). Subduction zones under land areas (e.g. New Zealand, Japan, Andean South America) are suit-able targets where the interface between the plates constitutes a discontinuity likely to give rise to converted phases. Recent developments in ocean bottom seismometer technology enable high-quality three-component records to be obtained over active tectonic areas. Such data sets also promise high converted phase yields. Thus, the topography of subducting slabs could also be mapped directly under ocean areas. At present, the topo-graphy on subducting slabs is usually inferred from earthquake locations and focal mechanisms and the interface between plates may not be constrained directly.
Stacking seismic signals is sometimes used in order to identify converted seismic phases but the methods described in this paper do not require such large data sets before constraints may be placed on the depth of structural interfaces. Data sets large enough for stacking may be re-interpreted to determine topography on the converting interfaces at higher resolution if the conversions are considered individually. The limit is the size of the Fresnel zone of the converted phase at the interface.
6 C O N C L U S I O N S
The combination of polarization filtering and automatic picking is a powerful method of processing multiphase data sets. The dramatic increase in converted phase yield makes it particularly suited to probing any region containing an interface between two units of contrasting seismic impedance. If the data set is to be used in a subsequent inversion of the traveltime residuals, the required picking windows will be calculated anyway. Automatic multiphase picking can therefore be regarded as an integral part of the inverse procedure.
A C K N O W L E D G M E N T S
The Leeds Tararua array was installed as part of the POMS project (NERC grant GR3/7699). This work was performed while AMR held a NERC PhD studentship and WM was supported by AMOCO (UK) under contract No. RAD 23(90). We are grateful for assistance and loan of equipment from the Victoria University of Wellington, the New Zealand Institute of Geological and Nuclear Sciences and the UK NERC Geo-physical Equipment Pool. Dave Francis and Mark Chadwick are thanked for their key roles in data acquisition and archiving.
R E F E R E N C E S
Adams, R. & Ferris, B., 1976. A further earthquake at exceptional depth beneath New Zealand,Geophys. J. Int.,19,269–273. Allen, R., 1978. Automatic earthquake recognition and timing from
single traces,Bull. seism. Soc. Am.,68,1521–1532.
Allen, R., 1982. Automatic phase-pickers: their present use and future prospects,Bull. seism. Soc. Am.,72,S225–S242.
Ansell, J. & Bannister, S., 1996. Shallow morphology of the subducted Pacific plate along the Hikurangi margin, New Zealand,Phys. Earth planet. Inter.,93,3–20.
Bannister, S., 1988. Microseismicity and velocity structure in the Hawke’s Bay region New Zealand: fine structure of the subducting Pacific plate,Geophys. J.,95,45–62.
Bataille, K. & Chui, J., 1991. Polarization analysis of high frequency, three-component seismic data,Bull. seism. Soc. Am.,81,622–642. Boschetti, F., Dentith, M. & List, R., 1996. A fractal based algorithm
for detecting first arrivals on seismic traces, Geophysics, 61,
1095–1102.
Calhaem, I., Haines, A. & Lowry, M., 1977. An intermediate depth earthquake in the central region of the South Island used to determine a local crustal structure, N. Z. J. Geol. Geophys., 20,
353–361.
Dai, H. & MacBeth, C., 1995. Automatic picking of seismic arrivals in local earthquake data using an artificial neural network,Geophys. J. Int.,120,758–774.
Earle, P. & Shearer, P., 1994. Characterisation of global seismograms using an automatic-picking algorithm, Bull. seism. Soc. Am., 84,
366–376.
Eberhart-Phillips, D. & Reyners, M., 1999. Plate interface properties in the northeast Hikurangi subduction zone, New Zealand, from converted seismic waves,Geophys. Res. Lett.,26,2565–2568. Fedorenko, Y. & Husebye, E., 1999. First breaks—automatic phase
pickings of P- and S-onsets in seismic records,Geophys. Res. Lett.,
26,3249–3252.
Gledhill, K., 1985. An earthquake detector employing frequency domain techniques,Bull. seism. Soc. Am.,75,1827–1835.
Gledhill, K. & Stuart, G., 1996. Seismic anisotropy in the fore-arc region of the Hikurangi subduction zone, New Zealand,Phys. Earth planet. Inter.,95,211–225.
Hasegawa, A., Horiuchi, S. & Umino, N., 1994. Seismic structure of the northeastern Japan convergent margin—a synthesis,J. geophys. Res.,
99,22 295–22 311.
Helffrich, G. & Stein, S., 1993. Study of the structure of the slab-mantle interface using reflected and converted seismic waves,Geophys. J. Int.,115,14–40.
Jones, C. & Phinney, R., 1998. Seismic structure of the lithosphere from teleseismic converted arrivals observed at small arrays in the southern Sierra Nevada and vicinity, California, J. geophys. Res.,
103,10 065–10 090.
Kayal, J., 1986. Analysis of strong phases other than P and S from a microearthquake survey in the Wellington region, New Zealand,
Bull. seism. Soc. Am.,76,1347–1354.
Klumpen, E. & Joswig, M., 1993. Automated reevaluation of local earthquake data by application of generic polarization patterns for P-onset and S-onset,Computers Geosci.,19,223–231.
Nakamura, M., Ando, M. & Ohkura, T., 1998. Fine structure of deep Wadati-Benioff zone in the Izu-Bonin region estimated from S-to-P converted phase,Phys. Earth planet. Inter.,106,63–74.
Park, J., Vernon, F. & Lindberg, C., 1987. Frequency dependent polarization analysis of high-frequency seismograms, J. geophys. Res.,92,12 664–12 674.
Patane, D. & Ferrari, F., 1999. Asdp: a PC-based program using a multi-algorithm approach for automatic dectection and location of local earthquakes,Phys. Earth planet. Inter.,113,57–74.
Reading, A.M., Gubbins, D. & Mao, W., 2001. A multiphase seismic investigation of the shallow subduction zone, North Island, New Zealand,Geophys. J. Int.,147,215–226 (this issue).
Richardson, W., 1989. The Matata earthquake sequence of 1977, Bay of Plenty, New Zealand,PhD thesis,Victoria University, Wellington. Roberts, R. & Christoffersson, A., 1991. Seismic signal detection—a
better mousetrap?,Bull. seism. Soc. Am.,81,2511–2515.
Robinson, R., 1986. Seismicity, structure and tectonics of the Wellington region, New Zealand, Geophys. J. R. astr. Soc., 87,
379–409.
Ruud, B. & Husebye, E., 1992. A new three component detector and automatic single-station bulletin production,Bull. seism. Soc. Am.,
82,221–237.
SAC, 1992. SAC, Seismic Analysis Code—Command Reference Manual,Lawrence Livermore National Laboratory, CA.
Samson, J.C., 1973. Descriptions of the polarisation states of vector processes: applications to ulf magnetic fields, Geophys. J. R. astr. Soc.,34,403–419.
Samson, J.C. & Olson, J.V., 1981. Data-adaptive polarization filters for multichannel geophysical data,Geophysics,46,1423–1431. Shearer, P.M., 1995. Seismic studies of the upper-mantle and transition
zone,Rev. Geophys.,33,321–324.
Smith, W.D., 1970. S to P conversion as an aid to crustal studies,
Geophys. J. R. astr. Soc.,19,513–519.
Stephens, C., Page, R. & Lahr, J., 1990. Reflected and mode-converted seismic-waves within the shallow Aleutian subduction zone, southern Kenai Peninsula, Alaska,J. geophys. Res.,95,6883–6897. Stuart, G., Francis, D., Gubbins, D. & Smith, G., 1995. Tararua
broadband array, North Island, New Zealand,Bull. seism. Soc. Am.,
85,325–333.
Thirot, J., Montagner, J. & Vinnik, L., 1998. Upper-mantle seismic discontinuities in a subduction zone (Japan) investigated from P to S converted waves,Phys. Earth planet. Inter.,108,61–80.
Wagner, G. & Owens, T., 1996. Signal detection using multi-channel seismic data,Bull. seism. Soc. Am.,86,221–231.
Withers, M., Aster, R., Young, C., Beiriger, J., Harris, M., Moore, S. & Trujillo, J., 1998. A comparison of selected trigger algorithms for automated global seismic phase and event detection,Bull. seism. Soc. Am.,88,95–106.
Woodgold, C.R.D., 1999. Wide-aperture beamforming of depth phases by timescale contraction,Bull. seism. Soc. Am.,89,165–177. Zhao, Y. & Takano, K., 1999. An artificial neural network approach
for broadband seismic phase picking, Bull. seism. Soc. Am., 89,
670–680.
234 A. M. Reading, W. Mao and D. Gubbins