Open Access
Research article
Novel markers for differentiation of lobular and ductal invasive
breast carcinomas by laser microdissection and microarray analysis
Gulisa Turashvili
1, Jan Bouchal*
1, Karl Baumforth
2, Wenbin Wei
2,
Marta Dziechciarkova
3, Jiri Ehrmann
1, Jiri Klein
4, Eduard Fridman
5,
Jozef Skarda
1, Josef Srovnal
3, Marian Hajduch
3, Paul Murray
2and
Zdenek Kolar
1Address: 1Laboratory of Molecular Pathology, Institute of Pathology, Palacky University, Olomouc, Czech Republic, 2Cancer Research U.K.
Institute of Cancer Studies, University of Birmingham, UK, 3Laboratory of Experimental Medicine, Department of Pediatrics, Palacky University,
Olomouc, Czech Republic, 4Department of Surgery, Palacky University, Olomouc, Czech Republic and 5Department of Pathology, Tel Aviv
University, Chaim Sheba Medical Center and Sackler School of Medicine, Tel Aviv, Israel
Email: Gulisa Turashvili - [email protected]; Jan Bouchal* - [email protected]; Karl Baumforth - [email protected]; Wenbin Wei - [email protected]; Marta Dziechciarkova - [email protected]; Jiri Ehrmann - [email protected];
Jiri Klein - [email protected]; Eduard Fridman - [email protected]; Jozef Skarda - [email protected]; Josef Srovnal - [email protected]; Marian Hajduch - [email protected]; Paul Murray - [email protected]; Zdenek Kolar - [email protected]
* Corresponding author
Abstract
Background: Invasive ductal and lobular carcinomas (IDC and ILC) are the most common histological types of breast cancer. Clinical follow-up data and metastatic patterns suggest that the development and progression of these tumors are different. The aim of our study was to identify gene expression profiles of IDC and ILC in relation to normal breast epithelial cells.
Methods: We examined 30 samples (normal ductal and lobular cells from 10 patients, IDC cells from 5 patients, ILC cells from 5 patients) microdissected from cryosections of ten mastectomy specimens from postmenopausal patients. Fifty nanograms of total RNA were amplified and labeled by PCR and in vitro transcription. Samples were analysed upon Affymetrix U133 Plus 2.0 Arrays. The expression of seven differentially expressed genes (CDH1, EMP1, DDR1, DVL1, KRT5, KRT6, KRT17) was verified by immunohistochemistry on tissue microarrays. Expression of ASPN mRNA was validated by in situ hybridization on frozen sections, and CTHRC1, ASPN and COL3A1 were tested by PCR.
Results: Using GCOS pairwise comparison algorithm and rank products we have identified 84 named genes common to ILC versus normal cell types, 74 named genes common to IDC versus normal cell types, 78 named genes differentially expressed between normal ductal and lobular cells, and 28 named genes between IDC and ILC. Genes distinguishing between IDC and ILC are involved in epithelial-mesenchymal transition, TGF-beta and Wnt signaling. These changes were present in both tumor types but appeared to be more prominent in ILC. Immunohistochemistry for several novel markers (EMP1, DVL1, DDR1) distinguished large sets of IDC from ILC.
Conclusion: IDC and ILC can be differentiated both at the gene and protein levels. In this study we report two candidate genes, asporin (ASPN) and collagen triple helix repeat containing 1 (CTHRC1) which might be significant in breast carcinogenesis. Besides E-cadherin, the proteins validated on tissue microarrays (EMP1, DVL1, DDR1) may represent novel immunohistochemical markers helpful in distinguishing between IDC and ILC. Further studies with larger sets of patients are needed to verify the gene expression profiles of various histological types of breast cancer in order to determine molecular subclassifications, prognosis and the optimum treatment strategies.
Published: 27 March 2007
BMC Cancer 2007, 7:55 doi:10.1186/1471-2407-7-55
Received: 27 November 2006 Accepted: 27 March 2007
This article is available from: http://www.biomedcentral.com/1471-2407/7/55
© 2007 Turashvili et al; licensee BioMed Central Ltd.
Background
Invasive ductal (IDC) and lobular carcinomas (ILC) are the most common histological types of breast cancer [1,2]. The terminology of ductal and lobular carcinomas is considered to be controversial as on purely anatomical grounds there is no justification for this nomenclature. Both carcinomas are derived from the terminal duct lobu-lar unit (TDLU), and the differences in their morphology are likely to reflect the differences in mechanisms of car-cinogenesis rather than the anatomical origin of the lesions. At presentation the clinical pathological parame-ters such as tumor site, size, grade and stage are similar for both tumor types [3], however, clinical follow-up data and the patterns of metastasis suggest that their develop-ment and progression are different [4,5]. Treatdevelop-ment for stage-matched tumors is similar [6], but ILCs are often resistant to neoadjuvant therapy [7]. Although patients with ILCs are older, have low grade tumor and less lym-phatic invasion, they have no survival advantage com-pared with IDCs [8,9].
Expression profiling using microarrays is a powerful tech-nology which enables the simultaneous study of the expression of thousands of genes and, in conjunction with laser capture microdissection, the high-throughput genetic analysis of morphologically distinct cell subpopu-lations within tumor tissue [10,11]. Microarray analysis has a number of applications, including tumor classifica-tion, molecular pathway modeling, functional genomics, and comparison of gene expression profiles between groups [12]. The study of gene expression in primary breast tumor tissues is complicated for two major reasons. First, breast cancer consists of many different cell types, including normal epithelial, stromal, adipose and endothelial cells. Second, tumor cells are morphologically and genetically diverse [13]. The recent development of laser capture microdissection has provided an opportu-nity to generate gene expression signatures from individ-ual cell types [14-20].
Microarrays were used for analysis of breast tumor sub-classes with clinical implication [21,22], for analysis of gene expression changes in single breast cancer cells from within the same tumor [14], for expression analysis of dif-ferent gene families in breast cancer [23,24], and for anal-ysis of gene expression in different cellular and tumor types [25-28]. ER status of the tumor was the most impor-tant discriminator of expression subtypes. Unsupervised hierarchical clustering segregated these tumors into two main clusters based on their basal (predominantly ER negative) and luminal (predominantly ER positive) char-acteristics [29]. Ductal breast cancer classes have been identified with aggressive phenotype and poor prognosis versus those with good prognosis [30-32]. Another study
reported distinct expression patterns based on BRCA1 and BRCA2 status [33].
To date, few papers have been published on gene expres-sion profiles of normal cell populations in the mammary gland [34]. Several studies suggest differences in expres-sion profiles of IDC and ILC. Inactivating mutations of E-cadherin gene are very frequent in ILC [35]. However, the loss of E-cadherin expression was shown to be an inde-pendent prognostic marker for recurrence, especially in node-negative breast cancer patients, irrespective of the histological type [36]. Abnormal cytoplasmic and nuclear localization of p120, a member of the E-cadherin/catenin adhesion complex, is mediated by E-cadherin loss and occurs in the early stages of ILC [37]. Non-microdissected IDC and ILC tissues have also been used to study specific gene expression profiles of lobular and ductal tumors [38,39]. We aimed to identify genes differentially expressed between normal cell types (ductal and lobular), between tumor cells and normal cells as well as between tumor types (ductal no special type and lobular). Despite examining limited number of patients, our study is the first full genome analysis of microdissected ductal and lobular tumor and normal cells which allowed us to detect normal mammary epithelium- and cancer-specific genes.
Methods
Laser capture microdissection and RNA isolation
Altogether ten surgical specimens with either invasive ductal carcinoma NST (no special type) (n = 5) or invasive lobular carcinoma (n = 5) were investigated. This research protocol was approved by the ethics committee at Palacky University. Tumor and normal tissues from the same mammary gland were identified by an experienced pathologist, snapfrozen in liquid nitrogen and stored at -80°C for further analysis. For microdissection, frozen tis-sues were embedded in TissueTek medium and cut on standard cryostat (Leica CM1850, Leica Microsystems GmbH, Wetzlar, Germany). Frozen sections (7 μm) were immediately fixed in acetone, stained by hematoxylin and dehydrated in alcohol and xylene. All solutions were pre-pared using diethyl pyrocarbonate-treated water. RNase free instruments and RnaseZap (Sigma, St Louis, MO, USA) were used throughout.
myoepithelial cells are preserved. Second, it is impossible to exclude contamination with or entrapment of myoepi-thelial cells during the microdissection procedure. Caps with captured cells were directly placed in 100 μl lysis buffer (Qiagen, Hilden, Germany). Total cellular RNA was isolated (RNeasy® Micro Kit, Qiagen) according to
manu-facturer's recommendations and subsequently quantified on a Nanodrop spectrophotometer (Nanodrop Technolo-gies, Wilmington, DE, USA).
RNA amplification, microarray target synthesis and hybridization
Fifty nanograms of total RNA were reverse transcribed and amplified by Microarray Target Amplification Kit (Roche diagnostics, Basel, Switzerland). In brief, total RNA (50 ng) was converted into cDNA using a modified oligo (dT) primer (TAS-T7 Oligo (dT)24). A unique Target Amplifica-tion Sequence (TAS) with no homology to any known sequences in public databases generated the 3' anchor on the cDNA for subsequent PCR amplification. In order to include a 5' anchor sequence on the cDNA, the TAS-(dN)10 primer was used for the initiation of the second strand cDNA synthesis. After purification using the Micro-array Target Purification Kit (Roche), PCR was performed using the TAS primer and Expand PCR Enzyme Mix which is optimized for long (>1 kb) and unbiased PCR products. In order to ensure that messages were not amplified to sat-uration, the optimal number of PCR cycles was estimated by preliminary PCR and agarose electrophoresis of PCR products from cycles 21, 24, 27, 30 and 33. The optimal number of PCR cycles was set either to 27 cycles for patients 3, 4, 8, 9, and 10 or 29 cycles for patients 1, 2, 5, 6, and 7. All three populations from each patient were amplified by the same number of PCR cycles. If higher PCR cycling was needed for any cell population, new microdissection, RNA isolation, cDNA synthesis and PCR amplification were performed until the same PCR cycling was possible. After purification with the Microarray Target Purification Kit (Roche), the PCR products were labeled with biotin-14-CTP (Invitrogen, CarlsBad, CA, USA) and biotin-16-UTP (Roche) by in vitro transcription using Microarray RNA Target Synthesis Kit T7 (Roche). The labeled cRNA was purified using the Microarray Target Purification Kit (Roche), quantified by spectrophotome-ter and checked by agarose electrophoresis. The entire amplification and labeling process was monitored by GeneChip® Eukaryotic Poly-A RNA Control Kit
(Affyme-trix, Santa Clara, CA, USA) with exogenous positive con-trols which were spiked into the total RNA before cDNA synthesis. In all cases, 25 μg of each biotinylated cRNA preparation was fragmented, assessed by gel electrophore-sis, and placed in hybridization cocktail containing bioti-nylated hybridization controls (GeneChip™ Eukaryotic Hybridization Control Kit, Affymetrix). Samples were first hybridized to Test3 Arrays for 16 hours, washed, stained
using antibody-mediated signal amplification and scanned. After passing this quality control stage, the sam-ples were hybridized onto the large Human Genome U133 Plus 2.0 Arrays (Affymetrix).
Microarray data analysis
Scanned images of microarray chips were analysed by the GCOS (GeneChip Operating Software) from Affymetrix with the default settings except that the target signal was set to 100. Differentially expressed genes between cell types were identified using the GCOS change algorithm and Rank Products (RP) [40] following RMA (Robust Multiarray Analysis) [41]. GCOS pairwise analysis was performed to compare gene expression levels among the normal lobular, normal ductal and tumor cells within individual patients and between lobular and ductal carci-noma cells of different patients. For each comparison between two cell types, the number of increase and decrease calls of each probe set was calculated using MS Excel and probe sets with the highest number of consist-ent changes among all paticonsist-ents were idconsist-entified. Probe level quantile normalization [40] and robust multiarray analysis [41] on the raw. CEL files were performed using the Affymetrix package of the Bioconductor [42]. The cut-off value of percentage of false-positives for RP analysis was set to 10%. Gene lists were uploaded to DAVID (Data-base for Annotation, Visualization and Integrated Discov-ery) [43], and functional annotation was performed. Further informations on genes were obtained from public databases, such as Gene Cards [44] and NETAFFX Analysis Center [45]. Hierarchical clustering was performed using dChip software [46]. The data discussed in this publica-tion have been deposited in NCBI Gene Expression Omnibus (GEO) [47], and are accessible through GEO Series accession number GSE5764.
Validation by immunohistochemistry
Seven differentially expressed genes were verified by immunohistochemical staining on tissue microarrays (TMA), which were constructed from 119 breast cancer cases and contained 278 cores of 2.0 mm diameter. They consisted of 80 ductal carcinomas, 29 lobular carcinomas, one tubular carcinoma, 3 medullary carcinomas, 2 tubu-lar-lobular carcinomas, 2 mixed ductal-lobular carcino-mas, one mucinous and one papillary carcinoma. The construction of the tissue microarrays was done using a tissue arrayer (Beecher Instruments, Inc., Sun Prairie, WI, USA) [48]. The paraffin sections from 22 additional breast cancer samples containing normal mammary gland struc-tures were used for comparison.
D5/16 B4, Dako, Denmark) and E-cadherin (dilution 1:50, clone NCH-38, Dako), polyclonal mouse antibodies against EMP1 (epithelial membrane antigen 1; dilution 1:100, clone 2D4-1G9, Abnova), DDR1 (discoidin domain receptor 1; dilution 1:100, Abnova) and DVL1 (human homolog of the Drosophila dishevelled gene; dilution 1:100, Abnova) were used. Microwave antigen retrieval was performed in citrate buffer (pH 6.0). For antigen visualization, the EnVision/HRP system and DAB+ (Dako) were used, slides were subsequently coun-terstained with hematoxylin, dehydrated and mounted in Canadian balsam. Immunohistochemical procedure was optimized by testing different antigen retrieval methods and negative controls. We regarded cells as immunoreac-tive when an obvious membranous or submembranous (E-cadherin, DDR1, EMP1) and cytoplasmic (cytokerat-ins, DVL1) staining was seen. Immunoreactivity was scored as follows: retained (++) when more than 50% of membrane/cytoplasm were strongly positive, reduced (+) when 10–50% of the membrane/cytoplasm were positive, and absent (-) when 0–10% of the membrane/cytoplasm were positive. Frequencies of positive and negative stain-ing in tumor and normal tissues were compared by Fisher's exact test (Statistica 6.0, StatSoft, Prague, Czech Republic).
Validation by in situ hybridization
Asporin mRNA expression was verified by chromogenic in situ hybridization (CISH) on frozen sections. Fluorescein labeled oligonucleotide (5'AAG TTG GTG GTA AGC CTT TAG GAA CTG AGG-FAM) was designed to the junction of exons five and six of the asporin mRNA (Generi Biotech, Hradec Kralove, Czech Republic). Sections were mounted on Superfrost Plus slides and stored at -80°C until further staining. Before CISH, the sections were heated at 50°C for 2 min, and then dried at room temperature for 30 min. Tissues were delipidized in chloroform at room tempera-ture for 5 min and dried to evaporate the chloroform. Block of endogenous peroxidase activity was followed by incubation of tissue sections in 10% paraformaldehyde for 7 min, then washed in PBS for 3 min and in 2× SSC (1× SSC contains 150 mM NaCl, 15 mM sodium citrate; pH 7.2) twice for 5 min. The sections were covered with 100
μl hybridization buffer (60% formamide, 5× SSC) con-taining 150 ng/ml of probe and incubated in moist cham-ber at 37°C for 22 hours. After the hybridization, unbound probe was washed from the sections at 37°C by 2× SSC for 5 min, then three times with 60% formamide in 0.2× SSC at 37°C for 5 min, and twice with 2× SSC at room temperature for 5 min. Then polyclonal rabbit anti-FITC/HRP (dilution 1:40, Dako) was applied at room temperature for 45 min, followed by washing in 2× SSC twice for 10 min. For visualization, DAB+ (Dako) was used, slides were subsequently counterstained with hema-toxylin, dehydrated and mounted in Canadian balsam.
Validation by PCR
Products after PCR amplification (see RNA amplification, microarray target synthesis and hybridization) were used for verification of CTHRC1, ASPN and COL3A1 gene expression using gene specific PCR. The primers were as follows: CTHRC1 forward 5'ACA AGT GCC AAC CCA GAT AGC AAC, reverse 5'ATC GCA CTT CTT CTG TGG AAG GAC (20 cycles of 95°C, 59°C and 72°C 1 min each, product length 79 bp, kindly provided by Dr. Danuta Radzioch, McGill University, Montreal, Canada), ASPN
forward 5'GTT CAG CTT GGG AAC TTT GGA ATG TAA, reverse 5'ACT GCA ATA GAT GCT TGT TTC TCT CAA CCC (20 cycles of 95°C, 58.5°C and 72°C 1 min each, product length 243 bp [modified from [49]], and COL3A1 forward 5'TTG TCA ACC AGT GCA AGT GAC CGA C, reverse 5'TGG TGA GCA CAG TCA TTG CTC TGC A (20 cycles of 95°C, 59°C and 72°C 1 min each, product length 276 bp) [50]. PCR products were separated on 10% polyacry-lamide gels, stained with ethidium bromide and captured using a gel documentation system (DIANA II with cooled CCD camera, Raytest, Germany). Band intensities, expressed as "OD (optical density) × cm", were assessed by Multi-Analyst densitometric software (Bio-Rad, USA). The results were correlated with fluorescence signals from the relevant Affymetrix probe sets by Spearman coefficient using Statistica 6.0 software (StatSoft, Czech Republic).
Results
Unsupervised clustering
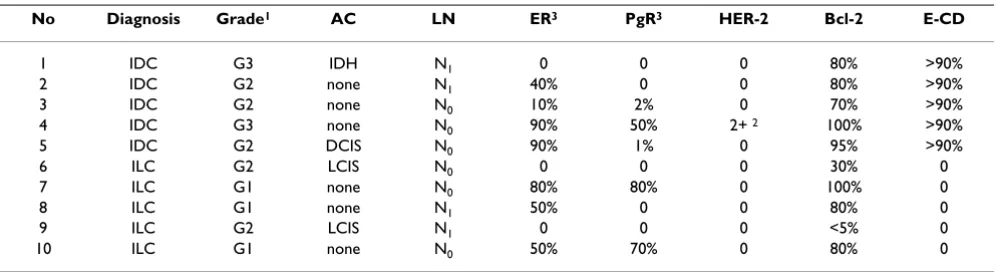
The clinical and histopathological characteristics includ-ing lymph node status, tumor grade, expression of estro-gen/progesterone receptors (ER/PgR), c-erbB-B2/HER2/ neu and accompanying lesions of ten breast cancer patients are shown in Table 1. We microdissected normal and tumor cells from these cases which resulted in a total of 30 samples for gene expression profiling (10 normal ductal, 10 normal lobular, 5 tumor ductal and 5 tumor lobular). Unsupervised clustering of all samples was per-formed using all probe sets without filtering. No tumor types were grouped together but two large clusters were evident: one mainly consisted of tumor cells and the other cluster mainly of normal cells. This clearly suggests differ-ences in global gene expression profiles of tumor and nor-mal cells (Figure 1).
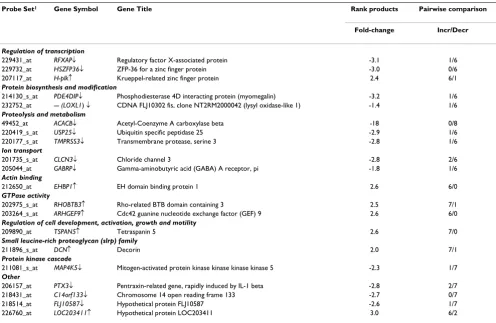
Genes differentially expressed between normal ductal and lobular cells
useful to separate two cell types. Genes encoding proteins involved in proteolysis and metabolism (USP25,
TMPRSS3, ACACB), protein biosynthesis and
modifica-tion (PDE4DIP, LOXL1), ion transport (CLCN3, GABRP) and protein kinase cascade (MAP4K5) as well as genes reg-ulating transcription (RFXAP, HSZFP36) were upregu-lated in ductal cells. However, genes regulating cell growth, activation and motility (TSPAN5), genes encod-ing actin-bindencod-ing proteins (EHBP1), small leucine-rich proteoglycan (DCN), and proteins with GTPase activity
(RHOBTB3, ARHGEF9) were overexpressed in lobular
cells (Table 2). Hierarchical clustering of normal cell types based on the 82 probe sets found by both RP and pairwise comparison showed that gene expression profiles of nor-mal ductal and lobular cells from the same patients were similar, and they could not be well separated from each other (Figure 2).
Genes differentially expressed between tumor cell types and normal cells
A comparison of ductal carcinoma cells with normal duc-tal cells identified 1055 probe sets by pairwise analysis, 604 probe sets by RP and 326 probe sets by both methods. A comparison of ductal carcinoma cells with normal lob-ular cells identified 792 probe sets by pairwise analysis, 347 probe sets by RP and 171 probe sets by both methods. A comparison of lobular carcinoma cells with normal ductal cells identified 1022 probe sets by pairwise analy-sis, 350 probe sets by RP and 201 probe sets by both methods. A comparison of lobular carcinoma cells with normal lobular cells identified 983 probe sets by pairwise analysis, 344 probe sets by RP and 208 probe sets by both methods (see Additional file 1). In pairwise comparisons, the differentially expressed genes were identified by select-ing those with count of changes more than 4 (out of 5, either increase or decrease).
Comparison between lobular carcinoma and normal cells
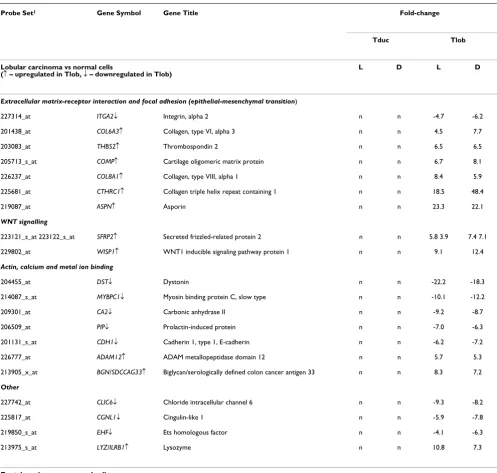
Combined pairwise analysis and RP have identified 106 differentially expressed probe sets (84 named genes) com-mon to lobular carcinoma versus normal ductal and lob-ular cells. Of these probe sets, several genes encoding proteins involved in extracellular matrix (ECM)-tumor interaction and focal adhesion (COL6A3, COL8A1,
CTHRC1, THBS2, COMP) were upregulated, whereas
ITGA2gene with the same function was downregulated in
tumor cells. ASPN (asporin) was one of the upregulated genes with the highest fold change. It encodes a protein with porin activity which belongs to a family of leucine-rich repeat (LRR) proteins associated with the cartilage matrix.
[image:5.612.58.557.99.235.2]Of the differentially expressed genes involved in Wnt sig-naling, SFRP2 (secreted frizzled-related protein 2) and WISP1 (WNT1 inducible signaling pathway protein 1) were upregulated in lobular carcinomas. Several genes encoding proteins involved in actin, calcium and metal ion binding were downregulated (MYBPC1, DST, PIP, CA2), and some genes with the same function (BGN, ADAM12) were upregulated in lobular carcinomas. CDH1 (E-cadherin) was downregulated in lobular tumors accompanied by downregulation of ITGA2 (integrin, alpha 2) which it is a ligand of. Several other genes were differentially expressed between lobular carcinomas and normal cells. LYZ/LILRB1 was upregulated in lobular can-cer cells. Other downregulated genes were as follows: CGNL1 is a cellular myosin that appears to play a role in cytokinesis, cell shape, and specialized functions such as secretion and capping; EHF encodes a protein that belongs to an ETS transcription factor subfamily charac-terized by epithelial-specific expression (ESEs). This pro-tein may be involved in epithelial differentiation and carcinogenesis; CLIC6 encodes a member of the chloride Table 1: Clinical and histopathological characteristics of breast cancer patients involved in microarray analysis
No Diagnosis Grade1 AC LN ER3 PgR3 HER-2 Bcl-2 E-CD
1 IDC G3 IDH N1 0 0 0 80% >90%
2 IDC G2 none N1 40% 0 0 80% >90%
3 IDC G2 none N0 10% 2% 0 70% >90%
4 IDC G3 none N0 90% 50% 2+ 2 100% >90%
5 IDC G2 DCIS N0 90% 1% 0 95% >90%
6 ILC G2 LCIS N0 0 0 0 30% 0
7 ILC G1 none N0 80% 80% 0 100% 0
8 ILC G1 none N1 50% 0 0 80% 0
9 ILC G2 LCIS N1 0 0 0 <5% 0
10 ILC G1 none N0 50% 70% 0 80% 0
1Tumors were graded using the Nottingham combined histologic grading system. 2No gene amplification was detected by fluorescent in situ hybridization.
3A complete H-score was calculated by summing the products of the percentage cells stained at a given staining intensity (0–100) and the staining
intensity (0–3).
intracellular channel family of proteins and is involved in ion transport (Table 3).
Comparison between ductal carcinoma and normal cells
Combined pairwise analysis and RP have identified 90 differentially expressed probe sets (74 named genes) com-mon to ductal carcinoma versus normal ductal and lobu-lar cells. In particulobu-lar, transcription regulators (ATF3, PIGR), genes encoding proteins with cytokine and growth factor activity (PTN, CX3CL1) and genes encoding pro-teins involved in ion transport and metabolism (ATP1A2, MMP7) were downregulated in ductal carcinomas when compared with normal cells (Table 3).
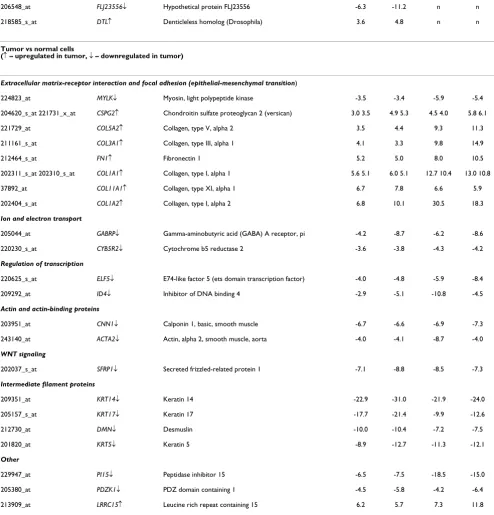
Comparison between both types of tumor cells and normal cells
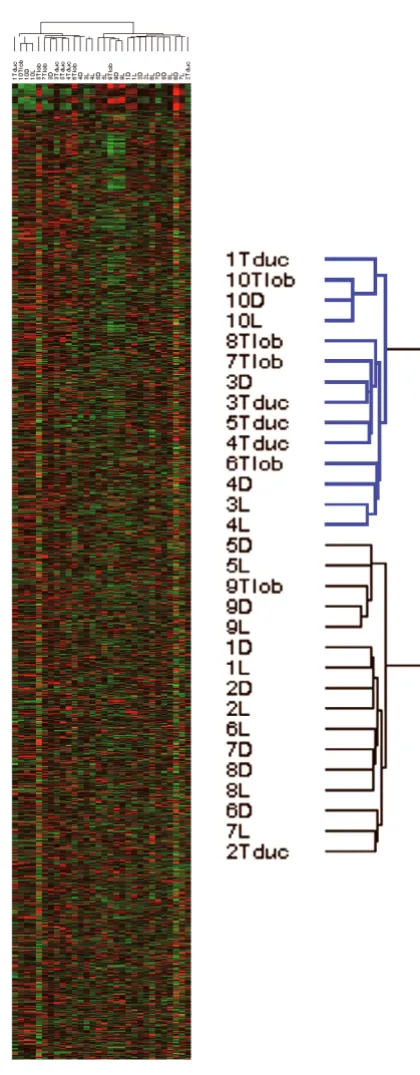
Of 90 probe sets differentially expressed between ductal carcinoma and both normal cells, and 106 probe sets dif-ferentially expressed between lobular carcinoma and both normal cells, only 25 probe sets were common (Table 3). Hierarchical clustering based on those 25 probe sets showed that tumor samples were grouped together, how-ever, gene expression profiles of normal cell types from cases 10 and 3 were different from other normal cells, and tumor cells from case 2 were different from other tumor cells (Figure 3).
Several upregulated genes (collagen type I, III, V, XI, fibronectin 1, versican) were related to tumor- ECM inter-actions and focal adhesion. However, another gene medi-ating focal adhesion, MYLK, was downregulated in tumor cells. This gene encodes a myosin light polypeptide kinase containing 1 fibronectin type-III domain. Genes encoding proteins involved in ion and electron transport (CYB5R2,
GABRP), and genes encoding proteins with transcription
factor and regulator activity (ELF5, ID4) were downregu-lated in both populations of tumor cells. They have also been implicated as regulators of cell proliferation, differ-entiation, and transformation. In addition, genes involved in cell differentiation and apoptosis (PDZK1) and genes encoding actin and actin-binding proteins (CNN1, ACTA2) were also downregulated in both types of tumor cells. Wnt signaling molecules were differentially expressed in our samples. Of these, SFRP1 (secreted friz-zled-related protein 1) was downregulated in tumor cells, and genes involved in calcium regulation pathway were not significantly changed. Structural constituents of cytoskeleton such as type I (14, 15, 17, 23) and type II (5) keratins were downregulated in tumor cells. Several other genes were also differentially expressed between tumor and normal cells. PI15 (peptidase inhibitor 15) was downregulated, whereas LRRC15 (leucine rich repeat con-taining 15) was upregulated in both tumor cells.
[image:6.612.66.276.82.620.2]Unsupervised hierarchical clustering of all samples using all probe sets
Figure 1
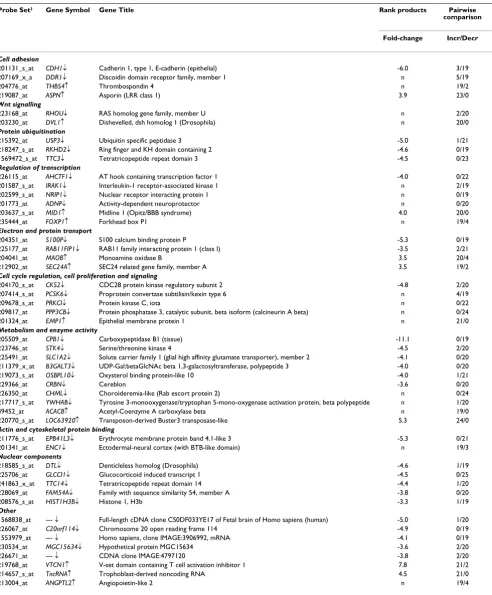
Genes differentially expressed between ductal and lobular carcinomas
In this comparison 208 probe sets were identified by pair-wise comparison, 122 probe sets by RP, and 32 probe sets (28 named genes) by both methods (Table 4). In pairwise comparisons, the differentially expressed genes were iden-tified by selecting those with count of changes more than 19 (out of 25 inter-patient comparison, every ductal carci-noma against every lobular carcicarci-noma, either increase or decrease). These tumors were well separated by hierarchi-cal clustering based on all 325 probe sets identified by RP and/or pairwise analysis (Figure 4). The expression of genes encoding proteins involved in cell adhesion was changed. Although CDH1 (E-cadherin), a classical mem-ber of the cadherin superfamily, was downregulated,
THBS4 encoding calcium-binding adhesive glycoprotein,
thrombospondin-4, was upregulated in all lobular carci-nomas. DDR1 encoding receptor tyrosine kinase was over-expressed in ductal carcinomas.
The DVL1 gene encoding protein involved in Wnt
signal-ing and the leucine-rich repeat protein ASPN (asporin) were upregulated in lobular carcinomas. Ductal
carcino-mas showed upregulated genes which are involved in cell proliferation, signaling and cell cycle regulation, includ-ing RHOU, member of the Rho family of GTPases stimu-lating quiescent cells to reenter the cell cycle; PCSK6
encoding a calcium-dependent serine endoprotease;
PRKCI encoding calcium-independent and
phospholipid-dependent protein kinase C; PPP3CB encoding protein phosphatase 3; and CKS2 encoding a component of the CDC28 protein kinase. Epithelial membrane protein 1 (EMP1) was the only upregulated gene involved in cell growth and proliferation in lobular carcinomas. These changes were accompanied by the differential expression of transcription regulators. Majority of genes with this function were upregulated in ductal carcinomas such as
AHCTF1, IRAK1, NRIP1, ADNP. Overexpressed genes in
lobular carcinomas were the tumor suppressor FOXP1
and another transcription regulator MID1.
The genes encoding proteins involved in ubiquitin-medi-ated proteolysis, such as USP3, RKHD2 and TTC3, and nuclear components, such as DTL, GLCC11, TTC14,
FAM54A, HIST1H3B, were upregulated in ductal
[image:7.612.57.553.99.422.2]carcino-mas. Majority of genes encoding proteins with enzyme Table 2: Genes differentially expressed between normal lobular versus normal ductal cells by both rank products and pairwise analysis
Probe Set1 Gene Symbol Gene Title Rank products Pairwise comparison
Fold-change Incr/Decr
Regulation of transcription
229431_at RFXAP↓ Regulatory factor X-associated protein -3.1 1/6
229732_at HSZFP36↓ ZFP-36 for a zinc finger protein -3.0 0/6
207117_at H-plk↑ Krueppel-related zinc finger protein 2.4 6/1
Protein biosynthesis and modification
214130_s_at PDE4DIP↓ Phosphodiesterase 4D interacting protein (myomegalin) -3.2 1/6
232752_at --- (LOXL1) ↓ CDNA FLJ10302 fis, clone NT2RM2000042 (lysyl oxidase-like 1) -1.4 1/6
Proteolysis and metabolism
49452_at ACACB↓ Acetyl-Coenzyme A carboxylase beta -18 0/8
220419_s_at USP25↓ Ubiquitin specific peptidase 25 -2.9 1/6
220177_s_at TMPRSS3↓ Transmembrane protease, serine 3 -2.8 1/6
Ion transport
201735_s_at CLCN3↓ Chloride channel 3 -2.8 2/6
205044_at GABRP↓ Gamma-aminobutyric acid (GABA) A receptor, pi -1.8 1/6
Actin binding
212650_at EHBP1↑ EH domain binding protein 1 2.6 6/0
GTPase activity
202975_s_at RHOBTB3↑ Rho-related BTB domain containing 3 2.5 7/1
203264_s_at ARHGEF9↑ Cdc42 guanine nucleotide exchange factor (GEF) 9 2.6 6/0
Regulation of cell development, activation, growth and motility
209890_at TSPAN5↑ Tetraspanin 5 2.6 7/0
Small leucine-rich proteoglycan (slrp) family
211896_s_at DCN↑ Decorin 2.0 7/1
Protein kinase cascade
211081_s_at MAP4K5↓ Mitogen-activated protein kinase kinase kinase kinase 5 -2.3 1/7
Other
206157_at PTX3↓ Pentraxin-related gene, rapidly induced by IL-1 beta -2.8 2/7
218431_at C14orf133↓ Chromosome 14 open reading frame 133 -2.7 0/7
218514_at FLJ10587↓ Hypothetical protein FLJ10587 -2.6 1/7
226760_at LOC203411↑ Hypothetical protein LOC203411 3.0 6/2
↑ – upregulated in normal lobular cells; ↓ – downregulated in normal lobular cells
1Affymetrix probe set number; If there was more than one probe set for the particular gene found among top 20 changed genes (according to the
activity or implicated in metabolism were also upregu-lated in ductal carcinomas (STK4, SLC1A2, B3GALT3,
OSBPL10, CRBN, CHML, YWHAB).
Two lobular and three ductal carcinomas were estrogen receptor-negative, whereas three lobular and two ductal carcinomas were estrogen receptor-positive. Hierarchical clustering using all probe sets was performed to determine whether receptor-positive and receptor-negative tumors could be separated. The tumors of the same histological type showed similar gene expression profiles without dif-ferences in relation to ER status as well as to other clinical parameters such as nodal status, stage and the expression of other immunohistochemical markers (data not shown).
Validation by immunohistochemistry on tissue microarrays
Seven differentially expressed genes (KRT5, KRT6 and
KRT17 between tumor and normal cells, CDH1, EMP1,
DDR1 and DVL1 between lobular and ductal carcinomas)
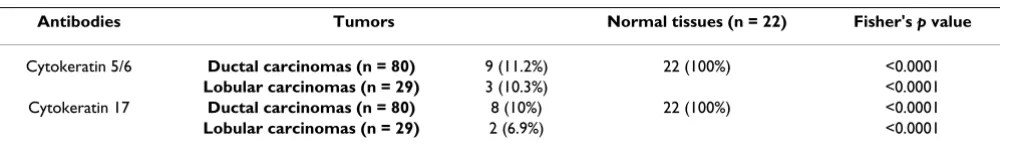
were verified by immunohistochemical detection of pro-teins on TMA slides comprising of cores from 119 cases. The clinical and histopathological characteristics of these patients are shown in Table 5. The reduced expression or absence of cytokeratins 5/6 and 17 (KRT5, KRT6, KRT17) was found in both tumor tissues in comparison to termi-nal duct lobular units in 22 normal mammary tissues (p < 0.0001) (Table 6 and Figure 5). In a majority of ducts and lobules including TDLU, these cytokeratins were expressed in both basal and luminal cells, verifying the previously described variability of the expression of basal cytokeratins and their relationship to the cellular origin [51]. Cytokeratin 5 and 17 have also been found in a sub-set of breast cancer and identified patients with poor clin-ical outcome [31].
E-cadherin (CDH1) has successfully separated ductal and lobular invasive carcinomas. It was absent in 93.3% of lobular tumors compared with only 15% of ductal tumors (p < 0.0001). Epithelial membrane protein 1 (EMP1), dis-coidin domain receptor 1 (DDR1) and human homolog of the Drosophila dishevelled gene (DVL1) were found by pairwise comparison analysis to be differentially expressed between lobular and ductal carcinomas. Immu-nohistochemistry confirmed higher expression of DVL1 and EMP1 in lobular carcinomas and of DDR1 in ductal carcinomas (p < 0.0001) (Table 7 and Figure 5). Of the special type carcinomas included on TMA slides, a papil-lary and two medulpapil-lary carcinomas were positive for basal cytokeratins, one out of three medullary carcinomas was positive for EMP1 and E-cadherin, a ductal-lobular noma was positive for DDR1, all other special type carci-nomas were negative for these markers, and finally none were positive for DVL1 (data not shown).
Hierarchical clustering of normal ductal and lobular cells based on 82 probe sets found by both rank products and pairwise analysis
Figure 2
Table 3: Genes differentially expressed between tumor versus normal cells by both rank products and pairwise analysis
Probe Set1 Gene Symbol Gene Title Fold-change
Tduc Tlob Lobular carcinoma vs normal cells
(↑ – upregulated in Tlob, ↓ – downregulated in Tlob) L D L D
Extracellular matrix-receptor interaction and focal adhesion (epithelial-mesenchymal transition)
227314_at ITGA2↓ Integrin, alpha 2 n n -4.7 -6.2
201438_at COL6A3↑ Collagen, type VI, alpha 3 n n 4.5 7.7
203083_at THBS2↑ Thrombospondin 2 n n 6.5 6.5
205713_s_at COMP↑ Cartilage oligomeric matrix protein n n 6.7 8.1
226237_at COL8A1↑ Collagen, type VIII, alpha 1 n n 8.4 5.9
225681_at CTHRC1↑ Collagen triple helix repeat containing 1 n n 18.5 48.4
219087_at ASPN↑ Asporin n n 23.3 22.1
WNT signalling
223121_s_at 223122_s_at SFRP2↑ Secreted frizzled-related protein 2 n n 5.8 3.9 7.4 7.1
229802_at WISP1↑ WNT1 inducible signaling pathway protein 1 n n 9.1 12.4
Actin, calcium and metal ion binding
204455_at DST↓ Dystonin n n -22.2 -18.3
214087_s_at MYBPC1↓ Myosin binding protein C, slow type n n -10.1 -12.2
209301_at CA2↓ Carbonic anhydrase II n n -9.2 -8.7
206509_at PIP↓ Prolactin-induced protein n n -7.0 -6.3
201131_s_at CDH1↓ Cadherin 1, type 1, E-cadherin n n -6.2 -7.2
226777_at ADAM12↑ ADAM metallopeptidase domain 12 n n 5.7 5.3
213905_x_at BGN/SDCCAG33↑ Biglycan/serologically defined colon cancer antigen 33 n n 8.3 7.2
Other
227742_at CLIC6↓ Chloride intracellular channel 6 n n -9.3 -8.2
225817_at CGNL1↓ Cingulin-like 1 n n -5.9 -7.8
219850_s_at EHF↓ Ets homologous factor n n -4.1 -6.3
213975_s_at LYZ/ILRB1↑ Lysozyme n n 10.8 7.3
Ductal carcinoma vs normal cells
(↓ – upregulated in Tduc, ↓ – downregulated in Tduc)
Regulation of transcription
202672_s_at ATF3↓ Activating transcription factor 3 -4.5 -7.7 n n
226147_s_at PIGR↓ Polymeric immunoglobulin receptor -4.8 -10 n n
Cytokine and growth factor activity
209466_x_at 211737_x_at PTN↓ Pleiotrophin -5.8 -7.1 -8.3 -12.5 n n
823_at CX3CL1↓ Chemokine (C-X3-C motif) ligand 1 -3.6 -8.3 n n
Ion transport and metabolism
203296_s_at ATP1A2↓ ATPase, Na+/K+ transporting, alpha 2 -8.2 -9.6 n n
212353_at SULF1↓ Sulfatase 1 4.6 4.0 n n
Other
1553602_at LOC118430↓ Small breast epithelial mucin -7.1 -10.4 n n
223623_at ECRG4↓ Esophageal cancer related gene 4 protein -6.6 -5.6 n n
206548_at FLJ23556↓ Hypothetical protein FLJ23556 -6.3 -11.2 n n
218585_s_at DTL↑ Denticleless homolog (Drosophila) 3.6 4.8 n n
Tumor vs normal cells
(↑ – upregulated in tumor, ↓ – downregulated in tumor)
Extracellular matrix-receptor interaction and focal adhesion (epithelial-mesenchymal transition)
224823_at MYLK↓ Myosin, light polypeptide kinase -3.5 -3.4 -5.9 -5.4
204620_s_at 221731_x_at CSPG2↑ Chondroitin sulfate proteoglycan 2 (versican) 3.0 3.5 4.9 5.3 4.5 4.0 5.8 6.1
221729_at COL5A2↑ Collagen, type V, alpha 2 3.5 4.4 9.3 11.3
211161_s_at COL3A1↑ Collagen, type III, alpha 1 4.1 3.3 9.8 14.9
212464_s_at FN1↑ Fibronectin 1 5.2 5.0 8.0 10.5
202311_s_at 202310_s_at COL1A1↑ Collagen, type I, alpha 1 5.6 5.1 6.0 5.1 12.7 10.4 13.0 10.8
37892_at COL11A1↑ Collagen, type XI, alpha 1 6.7 7.8 6.6 5.9
202404_s_at COL1A2↑ Collagen, type I, alpha 2 6.8 10.1 30.5 18.3
Ion and electron transport
205044_at GABRP↓ Gamma-aminobutyric acid (GABA) A receptor, pi -4.2 -8.7 -6.2 -8.6
220230_s_at CYB5R2↓ Cytochrome b5 reductase 2 -3.6 -3.8 -4.3 -4.2
Regulation of transcription
220625_s_at ELF5↓ E74-like factor 5 (ets domain transcription factor) -4.0 -4.8 -5.9 -8.4
209292_at ID4↓ Inhibitor of DNA binding 4 -2.9 -5.1 -10.8 -4.5
Actin and actin-binding proteins
203951_at CNN1↓ Calponin 1, basic, smooth muscle -6.7 -6.6 -6.9 -7.3
243140_at ACTA2↓ Actin, alpha 2, smooth muscle, aorta -4.0 -4.1 -8.7 -4.0
WNT signaling
202037_s_at SFRP1↓ Secreted frizzled-related protein 1 -7.1 -8.8 -8.5 -7.3
Intermediate filament proteins
209351_at KRT14↓ Keratin 14 -22.9 -31.0 -21.9 -24.0
205157_s_at KRT17↓ Keratin 17 -17.7 -21.4 -9.9 -12.6
212730_at DMN↓ Desmuslin -10.0 -10.4 -7.2 -7.5
201820_at KRT5↓ Keratin 5 -8.9 -12.7 -11.3 -12.1
Other
229947_at PI15↓ Peptidase inhibitor 15 -6.5 -7.5 -18.5 -15.0
205380_at PDZK1↓ PDZ domain containing 1 -4.5 -5.8 -4.2 -6.4
213909_at LRRC15↑ Leucine rich repeat containing 15 6.2 5.7 7.3 11.8
Tduc – ductal tumor; Tlob – lobular tumor; D – normal ductal cells; L – normal lobular cells; n – not differentially expressed among top 20 genes.
1Affymetrix probe set number; If there was more than one probe set for the particular gene found among top 20 changed genes (according to the
[image:10.612.58.552.153.668.2]fold change), the probe set with the highest fold change is used and number of other probe set is indicated.
Validation of asporin expression by in situ hybridization
Combined RP and pairwise comparison showed that
ASPN was one of the most upregulated genes in lobular
carcinomas, when compared with normal ductal (fold change 23.3) and lobular (fold change 22.1) cells as well as with ductal carcinomas (fold change 3.9). None of the available antibodies against asporin worked on paraffin sections, therefore we utilised chromogenic in situ hybrid-ization to detect asporin mRNA in frozen sections. All five lobular carcinomas appeared positive, whereas five cases of ductal carcinomas were negative or weakly and focally positive which is in agreement with the microarray data (Figure 6).
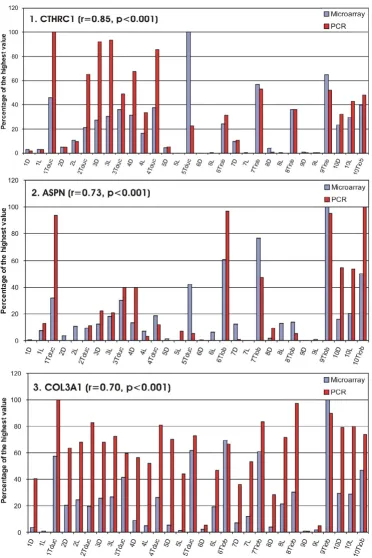
Validation of CTHRC1, ASPN and COL3A1 by PCR
Besides asporin, CTHRC1 was also upregulated in lobular cancer cells, when compared with normal ductal cells (fold change 48.4) and lobular cells (fold change 18.5),
and COL3A1 was upregulated in both IDC and ILC cells,
when compared with normal ductal cells (fold change 3.3 and 14.9, respectively) and lobular cells (fold change 4.1 and 9.8, respectively). As both RNA and cDNA were fully utilized for amplification, we used PCR amplification
products (see Methods) for validation by another PCR with specific primers. The results of semi-quantitative PCR correlated with the microarray data. Spearman coeffi-cients were r = 0.85, r = 0.73 and r = 0.70 for CTHRC1,
ASPN and COL3A1, respectively (all significant at p < 0.0001) (Figure 7).
Discussion
We examined 30 samples (microdissected tumor and nor-mal ductal and lobular cells) from postmenopausal patients with lobular and ductal invasive breast carcino-mas using Affymetrix arrays. Genes differentially expressed between the normal ductal and lobular cell types, which are less likely to be affected by fluctuating levels of female hormones as they were derived from post-menopausal women, are involved in ion transport and protein kinase cascade, protein biosynthesis and modifi-cation, proteolysis and metabolism, regulation of tran-scription and cell growth. However, hierarchical clustering of normal cell types based on the 82 probe sets identified by both RP and pairwise comparison showed that the gene expression profiles of normal ductal and lobular cells taken from the same patient are more similar to each other than ductal cells or lobular cells from differ-ent patidiffer-ents, and thus could not be well separated from each other. This may suggest expected similarities between expression signatures in normal epithelial (ductal and lobular) cells of the mammary gland. Since both IDC and ILC are believed to start in the terminal duct lobular unit (TDLU) of the breast [1,2], and these normal cell popula-tions showed similar gene expression profiles, it is likely that the different morphological appearances of the two tumor types are mediated by differences in their mecha-nisms of carcinogenesis.
Combined pairwise comparison and RP analysis revealed that ductal and lobular carcinomas have a number of genes in common, however, they can be discriminated both at the gene and protein levels in our study. cDNA microarrays have previously been used to distinguish between IDC and ILC [38,39]. Unsupervised clustering of tumors failed to separate the two subtypes. There were 8 genes identified by MaxT permutation analysis using t tests, significance analysis for microarrays (SAM) and pre-diction analysis for microarrays (PAM) (E-cadherin, sur-vivin, cathepsin B, TPI1, SPRY1, SCYA14, TFAP2B, and thrombospondin 4), and an additional 3 were identified by SAM and PAM (osteopontin, HLA-G, and CHC1) [38]. It has also been found that over half of ILCs differed from IDCs in global transcription programs, whereas the remaining ILCs closely resembled IDCs. Fifty two percent of the ILCs ("typical" ILCs) clustered together and dis-played different gene expression profiles from the IDCs, whereas the other ILCs ("ductal-like" ILCs) were distrib-uted between different IDC subtypes. Many of the
differ-Hierarchical clustering of tumor and normal samples based on 25 probe sets common to ductal and lobular carcinoma versus normal cells identified by both rank products and pair-wise analysis
Figure 3
Table 4: Genes differentially expressed in lobular versus ductal invasive carcinomas by rank products and/or pairwise analysis
Probe Set1 Gene Symbol Gene Title Rank products Pairwise
comparison Fold-change Incr/Decr
Cell adhesion
201131_s_at CDH1↓ Cadherin 1, type 1, E-cadherin (epithelial) -6.0 3/19
207169_x_a DDR1↓ Discoidin domain receptor family, member 1 n 5/19
204776_at THBS4↑ Thrombospondin 4 n 19/2
219087_at ASPN↑ Asporin (LRR class 1) 3.9 23/0
Wnt signalling
223168_at RHOU↓ RAS homolog gene family, member U n 2/20
203230_at DVL1↑ Dishevelled, dsh homolog 1 (Drosophila) n 20/0
Protein ubiquitination
215392_at USP3↓ Ubiquitin specific peptidase 3 -5.0 1/21
218247_s_at RKHD2↓ Ring finger and KH domain containing 2 -4.6 0/19
1569472_s_at TTC3↓ Tetratricopeptide repeat domain 3 -4.5 0/23
Regulation of transcription
226115_at AHCTF1↓ AT hook containing transcription factor 1 -4.0 0/22
201587_s_at IRAK1↓ Interleukin-1 receptor-associated kinase 1 n 2/19
202599_s_at NRIP1↓ Nuclear receptor interacting protein 1 n 0/19
201773_at ADNP↓ Activity-dependent neuroprotector n 0/20
203637_s_at MID1↑ Midline 1 (Opitz/BBB syndrome) 4.0 20/0
235444_at FOXP1↑ Forkhead box P1 n 19/4
Electron and protein transport
204351_at S100P↓ S100 calcium binding protein P -5.3 0/19
225177_at RAB11FIP1↓ RAB11 family interacting protein 1 (class I) -3.5 2/21
204041_at MAOB↑ Monoamine oxidase B 3.5 20/4
212902_at SEC24A↑ SEC24 related gene family, member A 3.5 19/2
Cell cycle regulation, cell proliferation and signaling
204170_s_at CKS2↓ CDC28 protein kinase regulatory subunit 2 -4.8 2/20
207414_s_at PCSK6↓ Proprotein convertase subtilisin/kexin type 6 n 4/19
209678_s_at PRKCI↓ Protein kinase C, iota n 0/22
209817_at PPP3CB↓ Protein phosphatase 3, catalytic subunit, beta isoform (calcineurin A beta) n 0/24
201324_at EMP1↑ Epithelial membrane protein 1 n 21/0
Metabolism and enzyme activity
205509_at CPB1↓ Carboxypeptidase B1 (tissue) -11.1 0/19
223746_at STK4↓ Serine/threonine kinase 4 -4.5 2/20
225491_at SLC1A2↓ Solute carrier family 1 (glial high affinity glutamate transporter), member 2 -4.1 0/20 211379_x_at B3GALT3↓ UDP-Gal:betaGlcNAc beta 1,3-galactosyltransferase, polypeptide 3 -4.0 0/20
219073_s_at OSBPL10↓ Oxysterol binding protein-like 10 -4.0 1/21
229366_at CRBN↓ Cereblon -3.6 0/20
226350_at CHML↓ Choroideremia-like (Rab escort protein 2) n 0/24
217717_s_at YWHAB↓ Tyrosine 3-monooxygenase/tryptophan 5-mono-oxygenase activation protein, beta polypeptide n 1/20
49452_at ACACB↑ Acetyl-Coenzyme A carboxylase beta n 19/0
220770_s_at LOC63920↑ Transposon-derived Buster3 transposase-like 5.3 24/0
Actin and cytoskeletal protein binding
211776_s_at EPB41L3↓ Erythrocyte membrane protein band 4.1-like 3 -5.3 0/21
201341_at ENC1↓ Ectodermal-neural cortex (with BTB-like domain) n 19/3
Nuclear components
218585_s_at DTL↓ Denticleless homolog (Drosophila) -4.6 1/19
225706_at GLCCI1↓ Glucocorticoid induced transcript 1 -4.5 0/25
241863_x_at TTC14↓ Tetratricopeptide repeat domain 14 -4.4 1/20
228069_at FAM54A↓ Family with sequence similarity 54, member A -3.8 0/20
208576_s_at HIST1H3B↓ Histone 1, H3b -3.3 1/19
Other
1568838_at --- ↓ Full-length cDNA clone CS0DF033YE17 of Fetal brain of Homo sapiens (human) -5.0 1/20
226067_at C20orf114↓ Chromosome 20 open reading frame 114 -4.9 0/19
1553979_at --- ↓ Homo sapiens, clone IMAGE:3906992, mRNA -4.1 0/19
230534_at MGC15634↓ Hypothetical protein MGC15634 -3.6 2/20
226671_at --- ↓ CDNA clone IMAGE:4797120 -3.8 2/20
219768_at VTCN1↑ V-set domain containing T cell activation inhibitor 1 7.8 21/2
214657_s_at TncRNA↑ Trophoblast-derived noncoding RNA 4.5 21/0
213004_at ANGPTL2↑ Angiopoietin-like 2 n 19/4
↑ – upregulated in lobular carcinoma; ↓ – downregulated in lobular carcinoma; n – gene not found by rank products at the level of 10% of false positives, Incr/decr – increase or decrease in lobular versus ductal carcinoma by pairwise comparison.
1All 32 probe sets identified by combined pairwise comparison and rank products are included, also a number of genes found by pairwise
entially expressed genes encode for proteins involved in cell adhesion/motility, lipid/fatty acid transport and metabolism, immune/defense response, and electron transport. Many genes distinguishing between typical and ductal-like ILCs are involved in regulation of cell growth and immune response [39]. However, these two previous studies examined whole tumor tissues without microdis-section, suggesting that expression of a number of genes could be related not only to tumor cells but also to other components of mammary tissue such as stromal, adipose, endothelial etc. Our study is the first full genome analysis
of microdissected ductal and lobular tumor and normal cells reporting both normal mammary epithelium- and cancer-specific genes expression profiles.
Importantly, CDH1 (E-cadherin gene) was downregulated in our lobular carcinomas, and immunohistochemistry confirmed this loss at the protein level within tumors. E-cadherin is considered to be the most important cell adhe-sion molecule in the mammary gland. It acts as a tumor suppressor inhibiting invasion and metastasis. Mutations of this gene are correlated with gastric, breast, colorectal, thyroid and ovarian cancer. During tumor progression, E-cadherin can be functionally inactivated or silenced by different mechanisms such as post-translational control, somatic mutations, downregulation of gene expression through promoter hypermethylation, histone deacetyla-tion, and transcriptional repression [52,53]. The latter induces cellular responses leading to the conversion of epithelial cells into invasive mesenchymal-like cells with increased motility and invasiveness, and this process is called an epithelial-mesenchymal transition (EMT) [52]. To date, it is believed that lost, non-polar or cytoplasmic expression of E-cadherin protein and/or transcriptional repression of its mRNA are hallmarks of EMT in cancer progression [53-55]. It has also been shown that several proteins such as fibronectin and integrin αvβ6 [54], Ets, TGFβ, FGF-1,-2,-8, α-SMA, collagen type I, III and throm-bospondins increase in abundance during EMT [56], con-versely, amongst proteins that decrease in abundance are E-cadherin and cytokeratins [54]. According to our results, collagen type I and III, fibronectin and Ets domain tran-scription factor are upregulated and cytokeratins are downregulated in both tumor cell types. The expression of collagens and other mesenchyme-associated genes in microdissected breast cancer cells was also confirmed by Nishidate and co-workers [57]. In addition, pairwise com-parisons revealed that thrombospondin 4 was upregu-lated only in lobular cancer cells, which agrees with the literature [38]. Thus we propose that the EMT plays a role in both tumor types but appears to be more important in lobular carcinomas. The EMT phenomenon seems to be promising because multiple molecules involved in EMT, such as receptor- and SRC-family tyrosine kinases, RAS and other small GTPases, can be envisioned as targets for anti-EMT therapy [58].
The tissue microenvironment, including the ECM-cell and cell-cell interactions, plays an important role in both nor-mal mammary gland development and cancer. Neoplastic transformation of cells dramatically alters the synthesis of proteoglycans and other ECM proteins both in tumor and the surrounding matrix [59]. This can stimulate the growth and spread of tumor cells by decreasing the adhe-sive functions of the ECM [60]. Both tumor types exam-ined show upregulated genes involved in tumor-ECM
Hierarchical clustering of invasive ductal and lobular breast carcinomas based on 325 probe sets identified by rank prod-ucts and/or pairwise analysis
Figure 4
interactions, cell adhesion and migration processes including metastasis. Expression of majority of the pro-teins encoded by these genes is related to TGFβ or Wnt sig-naling, and both the TGFβ and Wnt pathways may affect ECM.
Asporin is a cartilage extracellular protein that has been reported to be associated with knee and hip osteoarthritis. This leucine-rich repeat protein was shown to interact with and inhibit TGFβ signaling which is thought to lead to insufficient quantities of aggrecan and type II collagen in osteoarthritis [61,62]. Asporin was more upregulated in our lobular carcinomas when compared with ductal tumors as well as with normal cell types. Overexpression of asporin mRNA in lobular carcinomas was then con-firmed by chromogenic in situ hybridization and PCR. In support of our findings, upregulation of this gene has also been described in microdissected androgen-independent prostate cancer cells using Affymetrix Human Genome U133A GeneChips [63]. The authors did not discuss it and importantly, asporin has not been related to carcino-genesis to date.
We have found another candidate gene, collagen triple helix repeat containing 1 (CTHRC1), which was upregu-lated in ILC in comparison with normal cells, and its expression was also validated by PCR. Aberrant expression
of CTHRC1 has recently been reported in human solid
tumors, including cancers of the gastrointestinal tract,
lung, breast, thyroid, ovarian, cervix, liver, and the pan-creas. It is associated with cancer tissue invasion and metastasis and potentially plays important functional roles in cancer progression, perhaps by increasing cancer cell migration [64]. TGFβ upregulates CTHRC1, versican, ADAM12, and downregulates SFRP1 and E-cadherin [65-67]. The loss of SFRP1 is known to be associated with breast cancer progression and poor prognosis in early stages [68], and a similar expression profile is seen in our study. SFRP1 is downregulated and versican is upregu-lated in both tumor types. Furthermore, pairwise compar-ison identified other overexpressed genes in lobular carcinoma such as SFRP2 and ADAM12. E-cadherin, which is downregulated in lobular cancer cells, can also be repressed by TGFβ-induced expression of transcription factor complexes [69]. TGFβ signaling inhibitors have been shown to prevent EMT, to inhibit mammary tumor viability and to block metastasis in various murine mod-els [70]. According to these results, we propose that dereg-ulated TGFβ signaling is likely to be more important in lobular carcinogenesis.
Wnt signaling molecules are also expressed in our samples in several comparisons. The Wnt proteins are small secreted glycoproteins which are involved in the self-renewal of stem cells and may be responsible for the maintenance of mature tissues [71]. On binding to Friz-zled receptors, Wnts can activate canonical (β -catenin-dependent) and/or non-canonical (β
-catenin-independ-Table 6: Immunohistochemical staining of cytokeratins in tumor and normal tissues
Antibodies Tumors Normal tissues (n = 22) Fisher's p value
Cytokeratin 5/6 Ductal carcinomas (n = 80) 9 (11.2%) 22 (100%) <0.0001
Lobular carcinomas (n = 29) 3 (10.3%) <0.0001
Cytokeratin 17 Ductal carcinomas (n = 80) 8 (10%) 22 (100%) <0.0001
[image:14.612.55.555.99.246.2]Lobular carcinomas (n = 29) 2 (6.9%) <0.0001
Table 5: Clinical and histopathological characteristics of TMA cases
Features IDC ILC
G1 6 (7.5%) 15 (51.7%)
G2 57 (71.3%) 11 (37.9%)
G3 17 (21.2%) 3 (10.3%)
ER+ 57 (71.3%) 19 (65.5%)
PgR+ 50 (62.5%) 17 (58.6%)
HER-2+ 12 (15%) 1 (3.4%)
Bcl-2+ 13 (16.3%) 4 (13.8%)
N0 56 (70%) 21 (72.4%)
N1 16 (20%) 6 (20.7%)
N2 8 (10%) 2 (6.9%)
Total number of cases 80 29
ER, estrogen receptor; G1-3, grade 1–3; IDC, invasive ductal carcinoma; ILC, invasive lobular carcinoma; N0–1, lymph node status; PgR,
[image:14.612.55.560.656.729.2]ent Wnt/planar cell polarity pathway and Wnt/Ca2+ path-way) Wnt signaling [72,73]. Downregulation of frizzled related proteins has been described in breast cancer [68]. Of these, SFRP1 is downregulated in both types of our tumor cells, and genes involved in calcium regulation
pathway are not significantly changed. The promoter of fibronectin 1 contains LEF/TCR-binding sites, making it a direct target of canonical Wnt signaling [59,74]. Fibronec-tin 1 is also upregulated in both tumor types. However, there is a difference in Wnt signaling between ILC and
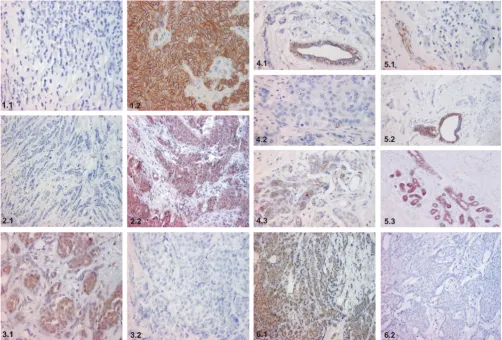
[image:15.612.54.556.87.426.2]Representative immunohistochemical staining for the selected proteins: E-cadherin, DDR1, DVL1, cytokeratin 5/6, cytokeratin 17 and EMP1
Figure 5
Representative immunohistochemical staining for the selected proteins: E-cadherin, DDR1, DVL1, cytokeratin 5/6, cytokeratin 17 and EMP1. 1.1. E-cadherin is negative in lobular carcinoma; 1.2. E-cadherin is positive in ductal carci-noma; 2.1. DDR1 is negative in lobular carcicarci-noma; 2.2. DDR1 is positive in ductal carcicarci-noma; 3.1. DVL1 is positive in lobular carcinoma; 3.2. DVL1 is negative in ductal carcinoma; 4.1. Cytokeratin 5/6 is negative in lobular carcinoma cells, but its expres-sion is retained in normal ductal epithelial cells; 4.2. Cytokeratin 5/6 is negative in ductal carcinoma cells; 4.3. Duct lobular unit in normal mammary gland tissue is positive for cytokeratin 5/6; 5.1. Cytokeratin 17 is negative in lobular carcinoma cells, but its expression is retained in normal ductal epithelial cells; 5.2. Cytokeratin 17 is negative in ductal carcinoma cells, but its expres-sion is retained in normal ductal epithelial cells; 5.3. Duct lobular unit in normal mammary gland tissue is positive for cytokera-tin 17; 6.1. EMP1 is positive in lobular carcinoma; 6.2. EMP1 is negative in ductal carcinoma.
Table 7: Immunohistochemistry differentiates ductal and lobular carcinomas
Antibodies Ductal carcinomas (n = 80) Lobular carcinomas (n = 29) Fisher's p value
E-cadherin 68 (85%) 2 (6.7%) <0.0001
DVL1 20 (25%) 28 (96.5%) <0.0001
EMP1 13 (16.3%) 27 (93.1%) <0.0001
[image:15.612.53.553.657.728.2]IDC. SULF1 (sulfatase 1) is upregulated and MMP7 is downregulated only in IDCs. MMP7 is a confirmed Wnt target [75] and it has been shown to be activated in both canonical [76,77] and non-canonical Wnt signaling [78]. Binding Wnt ligands to frizzled receptors is regulated by the 6-O sulfation-desulfation of cell surface heparan sul-fates (HSs) by sulfatase 1. Sulfated HSs bind to Wnt ligand with high affinity and inhibit Wnt signaling. Sulfatase 1 removes 0–6 sulfates from HSs and reduces their binding to Wnt ligands which in turn allows the formation of functional Wnt-Frizzled complexes and thus promotes Wnt signaling [79,80]. Frizzled-related proteins also have heparin-binding domains that promote the formation of Wnt-Frizzled complexes [81]. Although SULF1 is upregu-lated, SFRP1 and MMP7 are downregulated in ductal can-cer cells, whereas SFRP2 and other Wnt molecules, such as
DVL1 and WISP1, are upregulated in lobular cancer cells. This suggests that Wnt signaling is activated in ILC cells but not in IDC cells. Since mRNA level of β-catenin was not changed between normal and tumor cells, the expres-sion of Wnt molecules appears to be β -catenin-independ-ent, favoring the non-canonical Wnt signaling in ILC. There is evidence that Wnts acting through the non-canonical pathway can promote tumor progression [82,83] which may also be true in ILC.
In addition to Wnt molecules such as DVL1, pairwise comparison revealed that EMP1, gene encoding a tumor-associated membrane protein involved in cell-cell interac-tions and proliferation control [84], was upregulated, whereas DDR1, epithelial-specific receptor kinase capable of binding Wnt5 and regulating the adhesion of mam-mary cells [85,86], was downregulated in ILCs. Immuno-histochemistry has also confirmed the same differential expression of these three proteins in IDC and ILC on
tis-sue microarrays. Thus all the evidence suggests that the two tumor types can be distinguished both at the gene and protein levels. Specific changes in gene and protein expression are likely to reflect the differences in mecha-nisms of carcinogenesis as well as the specific histological and clinical characteristics of these tumors derived from the same anatomical compartment, TDLU.
Conclusion
Microdissection of normal and tumor cell types from the breast and full genome expression analysis by Affymetrix arrays allowed us to provide novel data on breast cancer. Invasive lobular and ductal breast carcinomas can be dif-ferentiated both at the gene and protein levels. Despite analyzing only thirty samples from ten patients, the results are in good accordance with previous literature [14,38,39,57,64]. Our data provide evidence for deregu-lated TGFβ and Wnt signaling accompanied by the over-expression of mesenchyme-associated genes like the collagens, asporin and others which might be occurring in conjunction with an altered EMT. We propose that dereg-ulated TGFβ signaling and EMT phenomenon are involved in both tumor types, but they seem to be more important in lobular carcinomas which is in concordance with the loss of E-cadherin expression and their distinct morphology from ductal tumors. In this study we report two candidate genes, asporin (ASPN) and collagen triple helix repeat containing 1 (CTHRC1), which might be sig-nificant in mammary gland carcinogenesis and may also be important either in cancer diagnosis or therapy. Besides E-cadherin, the proteins validated on tissue microarrays by immunohistochemistry (EMP1, DVL1, DDR1) may represent novel tissue markers helpful in the differentiation of ductal and lobular cancers. Further stud-ies with larger sets of patients are needed to verify the gene
[image:16.612.55.554.88.241.2]Asporin mRNA detection by chromogenic in situ hybridization
Figure 6
PCR validation of microarray results for CTHRC1 (1), ASPN (2), and COL3A1 (3)
Figure 7
expression profiles of various histological types of breast cancer in order to determine molecular subclassifications, prognosis, and the optimum treatment strategies.
Abbreviations
ADAM12 = ADAM metallopeptidase domain 12; ASPN = Asporin; CK = Cytokeratin; CTHRC1 = Collagen triple helix repeat containing 1; DAVID = Database for Annota-tion, Visualization and Integrated Discovery; DDR1 = Dis-coidin domain receptor 1; DVL1 = Human homolog of the Drosophila dishevelled gene; ECM = Extracellular matrix; EMP1 = Epithelial membrane antigen 1; EMT = Epithelial-mesenchymal transition; ER = Estrogen recep-tor; GCOS = GeneChip Operating Software; IDC = Inva-sive ductal carcinoma; ILC = InvaInva-sive lobular carcinoma; ISH = In situ hybridization; IVT = In vitro transcription; PCR = Polymerase chain reaction; PgR = Progesterone receptor; RMA = Robust multiarray analysis; RNA = Ribo-nucleic acid; RP = Rank products analysis; SFRP1 = Secreted frizzled-related protein 1; TDLU = Terminal duct lobular unit; TGFβ = Transforming growth factor β ; TMA = Tissue microarray; WISP1 = WNT1 inducible signaling pathway protein 1.
Competing interests
The author(s) declare that they have no competing inter-ests.
Authors' contributions
GT and JB contributed equally to this work. GT partici-pated in collecting surgical specimens, cutting and evalu-ation of frozen sections, laser microdissection, immunohistochemistry, ISH, analysis of microarray results and drafting the manuscript. JB participated in the design of the study, collecting surgical specimens, RNA isolation, amplification and labeling, analysis of micro-array results, ISH and PCR validation, drafting the manu-script. KB carried out the hybridization and scanning of the arrays and proofreading of the manuscript. WW per-formed data analysis and participated in drafting the man-uscript. MD and MH were involved in laser microdissection. JEparticipated in collection and evalua-tion of frozen secevalua-tions. JK participated in obtaining surgi-cal specimens. EF and JS participated in tissue microarray construction. JS was involved in RNA isolation and PCR validation. PM participated in analysis of microarray results. ZK conceived of the study, participated in its design and coordination, as well as in collecting surgical specimens, evaluation of frozen sections and drafting the manuscript. All authors read and approved the final man-uscript.
Additional material
Acknowledgements
The work was supported by grants NR 7844-3 and NR 8425-3 from the Czech Ministry of Health and MSM 6198959216 from the Czech Ministry of Education. The authors cordially thank to Jirina Zatloukalova, Jirina Proc-hazkova, Prof. George Burkadze, Dalimil Zurek, Veronika Krejci, Pravomila Abrahamova, Alena Lukasova, Renata Bilkova and Gabriela Korinkova for scientific discussions and kind technical assistance.
References
1. Rosen PP: Rosen's breast pathology Lippincots-Raven Publishers; 1997. 2. Weidner N, Cote R, Suster S, Weiss L: Modern Surgical Pathology
Else-vier Science; 2003.
3. Winchester DJ, Chang HR, Graves TA, Menck HR, Bland KI, Win-chester DP: A comparative analysis of lobular and ductal car-cinoma of the breast: presentation, treatment, and outcomes. J Am Coll Surg 1998, 186:416-422.
4. Silverstein MJ, Lewinsky BS, Waisman JR, Gierson ED, Colburn WJ, Senofsky GM, Gamagami P: Infiltrating lobular carcinoma. Is it different from infiltrating duct carcinoma? Cancer 1994,
73:1673-1677.
5. Toikkanen S, Pylkkanen L, Joensuu H: Invasive lobular carcinoma of the breast has better short- and long-term survival than invasive ductal carcinoma. Br J Cancer 1997, 76:1234-40. 6. Molland JG, Donnellan M, Janu NC, Carmalt HL, Kennedy CW, Gillett
DJ: Infiltrating lobular carcinoma – a comparison of diagno-sis, management and outcome with infiltrating duct carci-noma. Breast 2004, 13:389-396.
7. Newman LA, Buzdar AU, Singletary SE, Kuerer HM, Buchholz T, Ames FC, Ross MI, Hunt KK: A prospective trial of preoperative chemotherapy in resectable breast cancer: predictors of breast-conservation therapy feasibility. Ann Surg Oncol 2002,
9:228-234.
8. Mersin H, Yildirim E, Gulben K, Berberoglu U: Is invasive lobular carcinoma different from invasive ductal carcinoma? Eur J Surg Oncol 2003, 29:390-395.
9. Arpino G, Bardou VJ, Clark GM, Elledge RM: Infiltrating lobular carcinoma of the breast: tumor characteristics and clinical outcome. Breast Cancer Res 2004, 6:R149-156.
10. Perou CM, Jeffrey SS, van de Rijn M, Rees CA, Eisen MB, Ross DT, Pergamenschikov A, Williams CF, Zhu SX, Lee JC, Lashkari D, Shalon D, Brown PO, Botstein D: Distinctive gene expression patterns in human mammary epithelial cells and breast cancers. Proc Natl Acad Sci USA 1999, 96:9212-9217.
11. Schena M, Shalon D, Davis RW, Brown PO: Quantitative monitor-ing of gene expression patterns with a complementary DNA microarray. Science 1995, 270:467-470.
12. Bertucci F, Viens P, Hingamp P, Nasser V, Houlgatte R, Birnbaum D:
Breast cancer revisited using DNA array-based gene expres-sion profiling. Int J Cancer 2003, 103:565-571.
13. Tavassoli FA, Scnitt SJ: Pathology of the breast New York: Elsevier; 1992.
14. Zhu G, Reynolds L, Crnogorac-Jurcevic T, Gillett CE, Dublin EA, Mar-shall JF, Barnes D, D'Arrigo C, Van Trappen PO, Lemoine NR, Hart
Additional File 1
Supplementary tables. The data provided represent supplementary tables listing all differentially expressed probe sets found by both rank products and pairwise analysis between normal ductal and normal lobular cells, ductal carcinoma and normal ductal cells, ductal carcinoma and normal lobular cells, ductal carcinoma and lobular carcinoma cells, lobular carci-noma and normal ductal cells, and lobular carcicarci-noma and normal lobular cells.
Click here for file