promoting access to White Rose research papers
White Rose Research Online [email protected]
Universities of Leeds, Sheffield and York
http://eprints.whiterose.ac.uk/
This is an author produced version of a paper published in Molecular Simulation
White Rose Research Online URL for this paper: http://eprints.whiterose.ac.uk/7691/
Published paper
Chen, B., Harrison, R.F., Hert, J., Mpanhanga, C., Willett, P. and Wilton, D.J. (2005) Ligand-Based Virtual Screening using Binary Kernel Discrimination.
Ligand-Based Virtual Screening Using Binary
Kernel Discrimination
BEINING CHEN
1, ROBERT F. HARRISON
2, JÉRÔME HERT
3,
CHIDO MPANHANGA
1,3, PETER WILLETT
3*
AND DAVID J. WILTON
3Krebs Institute for Biomolecular Research, Departments of Chemistry1, Automatic Control and Systems Engineering2, and Information Studies3, University of Sheffield,
Western Bank, Sheffield S10 2TN, UK
ABSTRACT. This paper discusses the use of a machine-learning technique called binary kernel
discrimination for virtual screening in drug- and pesticide-discovery programmes. Binary kernel
discrimination is compared with several other ligand-based tools for virtual screening in databases
of 2D structure represented by fragment bit-strings, and is shown to provide an effective, and
reasonably efficient, way of prioritising compounds for biological screening.
KEYWORDS. Binary kernel discrimination, Circular substructure, Fingerprints, Similarity
searching, Virtual screening
* To whom all correspondence should be addressed: email [email protected]
INTRODUCTION
Biological testing in pharmaceutical and agrochemical research is resource intensive (in terms of
both time and money), and the cost-effectiveness of such testing is hence increased, when
compared to selecting molecules at random, if it is possible to eliminate from consideration those
molecules that have low a priori probabilities of exhibiting the biological activity of interest. Virtual screening is the name given to the use of computational methods to rank a dataset in decreasing order of such probabilities, so that attention can be focussed on the molecules at the top
of the ranking [1, 2]. There are two main approaches to virtual screening: ligand-based
approaches use information pertaining to molecules that are already known to be active or
inactive; and structure-based approaches additionally exploit information about the
three-dimensional structure of the biological target of the drug or agrochemical. Here, we consider a
Following a general description of the BKD approach, we compare BKD with several other
machine learning methods that can be used for ligand-based virtual screening when heterogeneous
sets of both active and inactive molecules are available for use as training data. These
comparisons involve the NCI AIDS database [3] and pesticide data from the Syngenta corporate
file, and demonstrate the general effectiveness of BKD. We next consider the use of similarity
searching as a virtual screening mechanism. Similarity searching is normally used to identify
those database molecules that are most similar to a single active reference structure, using some quantitative definition of inter-molecular structural similarity [4, 5]. Here, we consider
similarity-based virtual screening techniques that can be used when not one but several different bioactive
reference structures are available, i.e., when the training-set contains only active molecules. A
comparison of several search methods that exploit multiple reference structures, this time using
the MDL Drug Data Report (MDDR) database [6], demonstrates the effectiveness of an approximate form of BKD. The NCI, Syngenta and MDDR experiments involve the molecules
being represented by fingerprints that encode the presence or absence of 2D fragment
substructures and that are generated using the Unity software for chemical information
management produced by Tripos Inc. [7]. We then discuss BKD’s performance when an
alternative type of 2D fingerprint, based on circular substructures, is used, and compare the results
obtained with those reported in a recent study of similarity-based virtual screening using a
different type of circular-substructure descriptor [8]. Finally, we describe current work that
considers the effect of using different types of kernel function (see below) on the performance of
BKD.
BINARY KERNEL DISCRIMINATION
Kernel estimation methods seek to evaluate the density of points in a space surrounding a given
point. In the virtual-screening context, we are interested in the distribution of known active and
inactive molecules in a training-set that are in the immediate vicinity of a test-set molecule of
unknown activity [9]. The BKD method makes use of this information to estimate the likelihood
of activity for molecules, and these likelihoods can then be used for ranking. All
machine-learning approaches involve some training stage; the output from this stage in BKD is a value for
the smoothing parameter λ (see below) that measures the extent of the contribution from the
training-set molecules as a function of their distance in chemical space from the test-set molecule.
Most kernel methods assume the use of real-valued descriptors, but Aitchison and Aitken first
demonstrated the use of a kernel function specifically designed for binary descriptors in a medical
application [10]. The resulting BKD method was first applied to problems in chemoinformatics
by Harper et al. [9], who compared its performance in simulated virtual screening experiments with conventional similarity searching and with a neural network. For two molecules i and j, characterised by binary fingerprints of length M that differ in dij positions, Harper et al. used the
kernel function Kλ(i,j)
)
1
(
),
(
λ
λ
λ = −
−
ij ij d d M j i K
where λ is a smoothing parameter whose optimum value (0.5≤λ≤1.0) is to be determined.
Training-set molecules (i.e., those whose activity or inactivity is already known) are then ranked
using the scoring function
( )
( )
( )
∑
∈
∑
∈
=
Inactive
i
K
i
j
Active
i
K
i
j
j
A
L
,
,
λ λ ,with the optimum value of λ being found from repeated analysis of the training-set. The optimum
is obtained by computing scores for each training-set molecule using the other training-set
molecules for a number of different values of λ in the range 0.50 to 0.99. For each value of λ the
sum of the ranks of the active molecules is computed. If this is plotted against λ a clear minimum
should be observed indicating the optimum λ, i.e., the value that minimises the summed ranks of
the actives in the training-set. It is assumed that the optimal value in the training-set is also
optimal for the test-set: this is clearly a strong assumption, but the results we have obtained
suggest that it does not result in poor predictive performance (and it is difficult to use a
machine-leaning technique like BKD without such an assumption). Once the optimum value has been
obtained, test-set molecules (i.e., those whose activity or inactivity is unknown) are compared
with the actives and inactives in the training-set, and then ranked in decreasing order of the
calculated LA(j) values.
The parameter λ lies at the heart of the BKD procedure, in that it determines how much bigger the
value of the kernel function is for similar molecules than it is for dissimilar molecules.
Specifically, if λ takes its lower bound value of 0.5 then the kernel functions for all of the
training-set molecules contribute equally to the overall score, LA(j), for each individual test-set molecule, j.
dominated by the largest kernel functions. Thus, if some particular test-set molecule is highly
similar to many training-set molecules there will be many significant contributions to LA(j).
Conversely, if some particular test-set molecule resembles only a very few training-set molecules
then that molecule will receive correspondingly few significant contributions to LA(j). The
parameter λ hence tunes BKD to the particular characteristics of the training-set actives and
inactives that are closest to each test-set molecule. It is this tuning facility that enables BKD to be
a highly discriminating tool for classification or ranking.
VIRTUAL SCREENING WITH ACTIVE AND INACTIVE TRAINING DATA Virtual Screening Methods
Similarity methods
The simplest way of predicting the activities of a set of molecules is by computing their similarities to a training-set of known actives and inactives, i.e., a k-nearest neighbour classifier. Two approaches are reported here; experiments with other, less effective similarity approaches are
discussed by Wilton et al. [11]. Given a test-set molecule, j, to be predicted, Smax is defined to be
the similarity to the most similar training-set active, i.e.,
{
S
i
j
}
i
Actives
j
max
S
(
)
=
max
(
,
)
∈
;while SA-I is defined to be the mean similarity to all of the A training-set actives minus the mean
similarity to all of the I training-set inactives, i.e.,
∑
∈
−
∑
∈
=
−
i
Inactives
S
i
j
I
Actives
i
S
i
j
A
I
A
S
1
(
,
)
1
(
,
)
.The similarities in these approaches are calculated using the Tanimoto Coefficient [4]. If a, b and c are the numbers of bits set in one fingerprint, set in the other fingerprint, and set in both fingerprints, respectively, then the Tanimoto coefficient is defined to be
c b
a
c
− +
In these methods, as with all the others considered here, the test-set molecules are ranked in
descending order of the calculated scores, i.e., similarity values in the present context, with the
expectation that the top-ranked molecules have the greatest probability of activity.
Substructural analysis was first described by Cramer et al. [12], and many different weighting schemes have been described for this purpose [13]. For each fragment or bit, j, in the binary fingerprints that characterise the training-set molecules, a weight is calculated that is a function of
the numbers of active and inactive training-set molecules that have the j-th bit set. A score is then computed for a test-set molecule by summing (or otherwise combining) the weights of those bits
that are set in its fingerprint. Here, we report the use of the R1 and R2 weights that performed
well in the comparative study of Ormerod etal. [13]. Let Aj (Ij) be the number of active (inactive)
molecules with bit j set, and let Tj be the total number of molecules with bit j set. Similarly, let A
(I) be the total number of active (inactive) molecules, and let NT be the total number of molecules
in the training-set. Then the two weights are given by
=
T
N
j
T
A
j
A
log
1
R
,
=
I
j
I
A
j
A
log
2
R
.Binary kernel discrimination
Finally, we used the BKD approach that was first reported by Harper et al. [9] and that has been described previously in this paper.
Results And Discussion
We carried out simulated virtual screening experiments on two datasets, one public and one
corporate. The initial experiments used the NCI AIDS file [3], which contains molecules that
have been checked for anti-HIV activity, with 1129 confirmed actives or confirmed moderately
actives and 34862 confirmed inactives. Training-sets were randomly generated, each containing
200 actives and 200 inactives, with the remaining 35591 molecules forming the test-set: three such
training-sets were generated for the experiments. The Syngenta dataset contained 132784
molecules that had been tested in various in vivo whole organism screens; of these 7127 were active in at least one screen, with the remaining 125657 having a response in the screens less than
a pre-defined threshold value. As before, three different training-sets were randomly generated,
each containing 713 actives (i.e., 10% of the total actives) and 713 inactives with the remaining
131358 molecules in each case forming the test-sets.
The test-set and training-set molecules were represented by 988-bit Tripos Unity fingerprints [7]
and scores were calculated for each of the test-set molecules using one of the techniques described
determined by noting the numbers of actives in the top 1% and the top 5% of the ranking. The
results obtained with the three different training-sets were all very similar, in that though there
were variations in the precise values obtained with the different test-sets there was very little
difference in the relative performance of the various methods; we hence consider the results for
only one of the training-sets, as detailed in Table 1. Inspection of this table leads to a simple,
unequivocal conclusion: that the BKD method gives rankings that are far superior to those of the
other ranking methods considered here, and that this is hence the method of choice in terms of the
effectiveness of virtual screening. The difference between BKD and the other approaches in the
table (and the many other approaches discussed by Wilton et al. [11]) is particularly marked with the large Syngenta dataset.
VIRTUAL SCREENING WITH ACTIVE TRAINING DATA
The increasing use of high-throughput screening means that large amounts of active and inactive
training data are likely to become available shortly after the commencement of an agrochemical or
pharmaceutical lead-discovery programme. At the start of a programme, however, the medicinal
chemist may have knowledge of just a few active molecules, such as natural products, or patented,
competitor molecules. In such cases, an alternative type of virtual screening can be used, based on
similarity searching [4, 5]. This involves matching a single bioactive reference structure against
each of the database structures to identify those that are most similar (and hence most likely to
exhibit the same activity as the reference structure). Here, we evaluate three distinct approaches
that can be used when multiple reference structures are available, i.e., when the training-set
contains only actives.
Virtual Screening Methods
Modal fingerprint method
The single fingerprint approach was first described by Shemetulskis et al. in their work on Stigmata [14]. The method generates a modal fingerprint from an input set of molecules that seeks to capture the common chemical features present in the members of this training-set. A bit j is set to “on” in the modal fingerprint if that bit is found in more than a user-defined threshold
percentage of the training-set molecules. The modal fingerprint is then used as a query and
compared to the fingerprints of the molecules in the test-set. We have adopted this idea here,
using the Tanimoto Coefficient to rank the molecules of the database.
Data fusion method
be made than if just a single sensor is employed. The approach has been used in many different
fields; when applied to chemoinformatics applications (where it is sometimes referred to as
consensus scoring) the fusion is effected by combining the results of several database searches using different descriptors or scoring functions [15]. In conventional applications of data fusion, a
single active reference structure is searched against a database in several different ways; in the
present context, we have several different reference structures that are all searched against a
database in exactly the same way (specifically using 2D fingerprints with the Tanimoto
coefficient). We have fused the similarity scores, S(i,j) (1 ≤i≤n, the number of active reference structures) for some molecule j using the Smax fusion rule discussed in the first section of the paper,
i.e., the test-set molecules were ranked on the basis of
{
S
(
i
,
j
)
}
i
∈
Actives
max
Substructural analysis method
A weighting scheme for substructural analysis normally requires access to training-set data for
both actives and inactives. In the present context, however, we do not have access to all of the
necessary information as the training-set consists of just active molecules. However, if we restrict
our attention to those weighting schemes that do not make explicit use of information about the
inactives and also make the assumption that the overall characteristics of the training-set are
mirrored by those of the entire database that is to be searched, then we can use the R1 weight. The
equation for the weight is as given previously; here, however, Tj is the total number of molecules
in the database with bit j set and NT is the total number of molecules in the database (rather than
the total number of molecules in the training-set with bit j set and the total number of molecules in the training-set, respectively, as is the case in conventional substructural analysis).
Binary kernel discrimination
An analogous approximation can be used to enable BKD to be used when only actives are
available for training purposes. Specifically, we make the assumption that the overall
characteristics of the inactives are approximated with a high degree of accuracy by the overall
characteristics of the entire database that is to be searched. If this assumption is accepted then a
training-set can be generated by taking the set of reference structures and adding to it molecules
randomly selected from the database, with the expectation that most, if not all, of these added
molecules are inactive. Since actives are inherently very rare, both this expectation and that
underlying the R1 approximation are not unreasonable.
We have evaluated the various approaches above by means of simulated virtual screening searches
on the MDDR database [6]. After removal of duplicates and molecules that could not be
processed using local software, 102535 molecules were available for searching and these were
represented by Unity fingerprints [7]. These molecules were searched using the eleven sets of
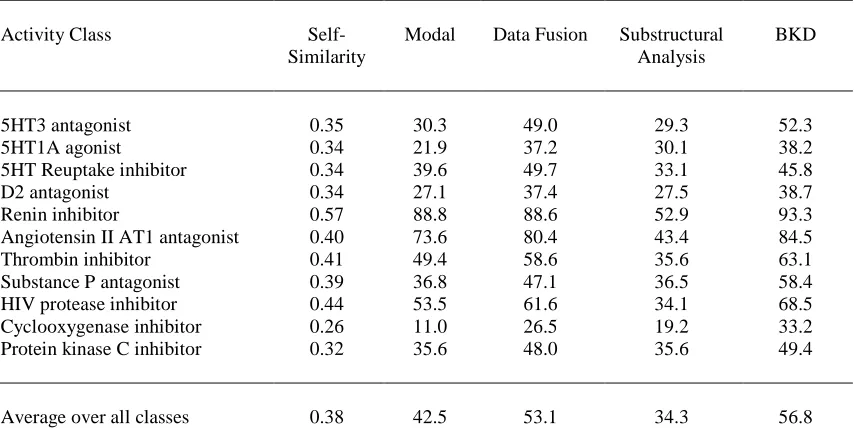
active molecules from MDDR that are listed in Table 2; full details of these experiments are
reported by Hert et al. [16]. A rough guide to the diversity of each of the chosen sets of bioactives is provided by matching each compound with every other in its activity class, calculating
similarities using Unity fingerprint and the Tanimoto coefficient, and computing the mean of these
intra-set similarities. The resulting similarity scores are listed in the second column of Table 2,
where it will be seen that the renin inhibitors are the most homogeneous and the cyclooxygenase
inhibitors are the most heterogeneous.
For each of the 11 activity classes, ten active molecules were selected for use as the training-set.
The selections were done at random, subject to the constraint that no pair-wise similarity in a
group exceeded 0.80 (using Unity fingerprints and the Tanimoto coefficient). Each searching
method was repeated ten times using different training sets, and in each search, a note was made
of the percentage of the active molecules (i.e., those in the same class as those in the training-set)
that occurred in the top 5% of the ranking resulting from that search. The results presented in
Table 2 are the mean recall values, averaged over each set of ten searches (very similar results to
those listed here were obtained if the top 1%, rather than the top 5%, of the rankings were
evaluated).
A large number of searches were carried out to identify the best parameter settings for the various
methods discussed above (and also several other, less effective methods that are described by Hert
et al. [16]). The resulting settings were then used in the main experiments, the results of which are detailed in the body of Table 2. Inspection of this table shows that fusion of the similarity
scores and BKD are the clear methods of choice, consistently out-performing modal fingerprints
and substructural analysis.
With some minor exceptions, the performance of all of the methods tends to increase as the
self-similarity of the active molecules increases. The correlation with intra-class self-similarity is not
unexpected; what is of importance is that good screening performance is obtained even with quite
diverse activity classes (such as the protein kinase C inhibitors and the D2 antagonists). The worst
here, however, the data fusion and BKD runs represent 5.3-fold and 6.6-fold enrichments,
respectively, over a random ranking of the dataset (with average enrichment factors for these two
approaches over all classes being 10.6 and 11.3, respectively).
In the final set of experiments, we sought to quantify the benefit that can be achieved using
multiple reference structures, when compared with the single reference structures that characterise
conventional similarity searching. This was done by using every single active molecule in turn in
each of the 11 chosen activity classes as the reference structure, and recording the minimum, mean
and maximum performance, as detailed in Table 3. The mean values correspond to the
performance that might be expected using an average, individual reference structure and are
clearly much lower than the figures reported in Table 2 for the BKD and data fusion methods (an
average over all classes of 30.6% as against 56.8% and 53.1%, respectively). Thus, the use of ten
actives, rather than just one, results in an increase of over two-thirds in the numbers of actives
retrieved. Perhaps the most interesting figures in Table 3 are those listed under “Maximum”.
These represent the best single similarity searches possible from the many hundreds of individual
bioactive molecules (this number ranges from 349 for the 5HT reuptake inhibitors up to 1236 for
the substance P antagonists). If we consider the average over all activity classes, it will be seen
that this upperbound is only fractionally better than the data fusion result in Table 2 and is actually
worse than the BKD figure. Thus, on average, picking any ten active reference structures and
combining them using BKD (or the Smax data fusion approach) will enable searches to be carried out that are comparable to even the best possible conventional similarity search using a single
active reference structure.
USE OF CIRCULAR SUBSTRUCTURES
Thus far, we have considered the use of a single type of 2D fingerprint, specifically those
produced by the Unity software [7]. We have recently reported a detailed evaluation of 15
different types of 2D fingerprint using the MDDR datasets discussed in the previous section [17].
This comparison demonstrated the general effectiveness of the fingerprints produced by Scitegic
Inc. [18], which are based on circular substructures. A circular substructure is a fragment
descriptor where each atom is represented by a string of extended connectivity codes that are
calculated using a modification of the Morgan Algorithm [19]. The best results in the study were
obtained with the Scitegic Extended Connectivity Fingerprints (ECFPs). The initial code assigned
to an atom is based on the number of connections, the element type, the charge, and the mass.
neighbour atoms is hashed to produce the next order code, which is mapped into an address space
of size 232, and the process iterated until the required level of description has been achieved. Here,
the ECFP_4 fingerprints were used, where the numeric code denotes the diameter in bonds up to
which features are generated.
The Scitegic software represents a molecule by a list of integers, each describing a molecular
feature and each in the range -231 to 231. These integer lists were normalised in two ways, referred
to as method-A and method-B. In method-A, all the features present in the database were
enumerated, so that each feature was given as its new code its rank in the sorted list of codes, with
the length of the resulting fingerprints being the number of distinct features in the database. In
method-B, the integers describing a molecule were hashed to a bit-string of length 1024 bits. This
inevitably means that collisions occur, with the result that method-B loses some of the structural
information that is retained by method-A; however, the latter representation is dependent on the
precise database that is being processed.
Bender et al. have recently used the 11 MDDR datasets of Tables 2 and 3 to test an alternative machine-learning technique based on atom environment fingerprints, information-gain-based
feature selection, and a naïve Bayesian classifier [8]. The atom environments are circular
fragments centred on each heavy atom in a molecule and encoding, like the Scitegic fragments,
the pattern of atoms within a fixed radius of the central atom [20]. The environments are
generated for each molecule in a training-set and the feature-selection procedure is next used to
identify those environments that are best able to discriminate between the sets of active and
inactive molecules in the training-set. The most discriminating environments are then used in a
Bayesian classifier routine that ranks the test-set molecules in decreasing probability of activity,
on the assumption that the presence and absence of individual environments are statistically
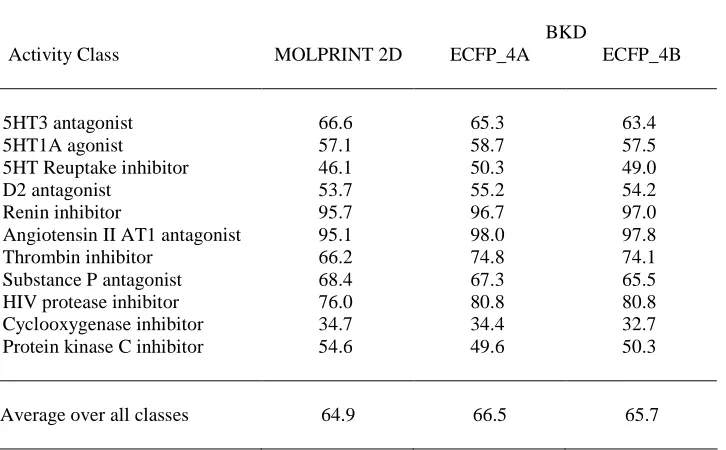
independent of each other. Bender et al. compare their procedure, called MOLPRINT 2D, with the BKD MDDR results discussed in the previous section, and show that MOLPRINT 2D is
noticeably superior [8]. Based on these comparisons (and on comparisons with two other
published accounts of virtual screening), Bender et al. suggest that the superior performance of MOLPRINT 2D is mainly due to the different descriptors that are used. We believe that this is
indeed the case, as discussed further below.
Table 4 details the mean percentage of active molecules retrieved in the top 5% of the ranked
substructures, these results being taken from [8] and [17], respectively. The situation is the same
as for the results in Table 2: the training-set contained 10 actives and 100 (assumed) inactives, and
the results quoted are mean values averaged over ten randomly selected training-sets. The
MOLPRINT 2D results are those obtained when the feature-selection procedure was used to
identify the 250 most discriminating fragments [8]. It will be seen that there is very little
difference between the two approaches: BKD performs better for seven of the datasets and
MOLPRINT 2D for the remaining four, but there are only two cases (thrombin and protein kinase
C) where the difference in mean recall is at all marked. Thus, given a comparable level of
molecular description, the similarity calculations required for BKD seem to be as effective as
those required for MOLPRINT 2D.
USE OF DIFFERENT SIMILARITY COEFFICIENTS
The kernel function suggested by Aitchison and Aitken [10] is based on the number of bit
positions at which two binary strings differ, i.e., the Hamming distance; this was adopted by
Harper et al. in their application of BKD to virtual screening, and has been used for all of the experiments reported thus far. In principle, however, there is no reason why one could not use an
alternative measure of the distance (or similarity) between the fingerprints representing two
molecules. Many different similarity coefficients have been used previously for similarity and
diversity calculations based on 2D fingerprints [4, 21], with these experiments demonstrating that
the Tanimoto coefficient generally, but not consistently, gives the best levels of performance, with
the Hamming Distance normally being notably inferior. We have hence carried out a preliminary
series of experiments in which the Hamming Distance exponent in the kernel function Kλ(i,j) is replaced by one minus one of the similarity coefficients listed in Table 5, rescaled by the
fingerprint length, i.e., M×(1-Coefficient). Each of these similarity coefficients is based on two or more of the following variables: a is the number of bits set to one in the first molecule, b the number of bits set to one in the second fingerprint, c the number of bits set to one in both of the fingerprints (so c≤min{a,b}), and d the number of bits that are not set to one in either of the fingerprints. Thus, M, the length of each fingerprint, is given by (a+b+d-c).
Searches were carried out using the NCI Aids database with a new training-set of 200 actives and
200 inactives, with the remaining molecules forming the test-set. The right-hand columns of
Table 5 list the percentages of active molecules retrieved in the top 1% and the top 5% of the
ranked test-set. There is little difference in recall between the coefficients when just the top 1% is
superior to the Simple Matching Coefficient, with the three association coefficients – the
Tanimoto, Rogers-Tanimoto and Russell-Rao Coefficients – giving comparable, and markedly
inferior results. It would hence seem that the normalisation that characterizes the three association
coefficients may adversely affect the operation of the resulting kernel functions. It was also noted
that the Hamming Distance and Simple Matching Coefficients gave far more well-marked optima
for λ during the training stage than was the case with the other coefficients. Further studies of
this behaviour are currently in progress.
Experiments were also carried out using sets of 200 renin and thrombin inhibitors from the
MDDR datasets discussed previously. In the case of the thrombin inhibitors, we observed a
similar pattern of behaviour to that in the NCI experiments, viz. the Hamming Distance being noticeably superior to the Simple Matching Coefficient, with the Tanimoto, Rogers-Tanimoto and
Russell-Rao Coefficients giving comparable, and markedly inferior, results. It is hence clear that
such coefficients are not appropriate for use in this kernel function, but we do not have any
theoretical rationale for this behaviour at present. With the renin inhibitors, however, there was
very little difference between the various coefficients. We ascribe this behaviour to the fact that
these actives are structurally far more homogeneous (as discussed earlier with respect to Table 2)
than the other two datasets studied here; the active molecules are hence all very similar to each
other and almost any machine-learning technique can be expected to produce a high level of
performance.
CONCLUSIONS
In this paper we have discussed the application of a machine-learning technique, BKD, to the
prediction of biological activity in virtual screening programmes. Our results suggest that BKD
provides an attractive focus for future research: it is effective in operation, in both exact and
approximate forms; it has been applied successfully to both pharmaceutical and agrochemical
datasets; and it is efficient in operation. For example, using the 2D fingerprints for the
132K-molecule Syngenta dataset, with programs written in C and run on a Silicon Graphics R12000
processor, training took about 36 seconds for each value of λ that was tested, and the subsequent
scoring of the test-set (comprising 98.9% of the entire dataset) using the optimal value of λ took
about 10 CPU hours. The method is hence clearly applicable to very large chemical databases.
We can regard a kernel function as a new type of similarity measure and it is hence of interest to
representation, the similarity coefficient and the weighting scheme that are used. We have already
started to investigate the use of different types of similarity coefficient (as discussed above). In
the future, we hope additionally to investigate the use of weighted fingerprints, with the bits being
assigned weights derived from substructural analysis of training-set molecules, and the use of
alternative types of structure representation.
ACKNOWLEDGEMENTS
We thank the following: Novartis Institutes for BioMedical Research for funding JH; the Department of Health for funding CM; Syngenta for funding DJW; John Delaney, Kevin Lawson and Graham Mullier (Syngenta) and Pierre Acklin, Kamal Azzaoui, Edgar Jacoby and Ansgar Schuffenhauer (Novartis) for helpful comments on this work; MDL Information Systems Inc. for the provision of the MDDR database; and the Royal Society, Scitegic Inc., Tripos Inc. and the Wolfson Foundation for software and laboratory support. The Krebs Institute for Biomolecular Research is a designated biomolecular sciences centre of the Biotechnology and Biological Sciences Research Council.
REFERENCES
1. H.-J. Böhm and G. Schneider, Eds. Virtual Screening for Bioactive Molecules. Wiley-VCH, Weinheim, 2000.
2. G. Klebe, Ed. Virtual Screening: an Alternative or Complement to High Throughput Screening. Kluwer, Dordrecht, 2000.
3. The NCI AIDS database is available at URL http://dtp.nci.nih.gov/. The details of the NCI assay are at URL http://dtp.nci.nih.gov/docs/aids/anti-hiv-screening.html
4. P. Willett, J.M. Barnard and G.M. Downs, “Chemical similarity searching.” Journal of Chemical Information and Computer Sciences,38, 983 (1998).
5. R.P. Sheridan and S.K. Kearsley, “Why do we need so many chemical similarity search methods?” Drug Discovery Today, 7,903 (2002).
6. The MDL Drug Data Report database is available from MDL Information Systems Inc. at http://www.mdli.com
7. The Unity software is available from Tripos Inc. at http://www.tripos.com
8. A. Bender, H.Y. Mussa, R.C. Glen, and S. Reiling, “Similarity searching of chemical databases using atom environment descriptors (MOLPRINT 2D): evaluation of performance.” Journal of Chemical Information and Computer Sciences, 44, 1708 (2004).
9. G. Harper, J. Bradshaw, J.C. Gittins, D.V.S. Green and A.R. Leach, A. R. “Prediction of biological activity for high-throughput screening using binary kernel discrimination.” Journal of Chemical Information and Computer Sciences, 41, 1295 (2001).
10. J. Aitchison and C.G.G. Aitken, “Multivariate binary discrimination by the kernel method.” Biometrika, 63, 413 (1976).
11. D.J. Wilton, P. Willett, K. Lawson and G. Mullier, “Comparison of ranking methods for virtual screening in lead-discovery programs. Journal of Chemical Information and Computer Sciences, 43, 469 (2003).
12. R.D. Cramer, G. Redl and C.E. Berkoff, “Substructural analysis. A novel approach to the problem of drug design.” Journal of Medicinal Chemistry, 17, 533 (1974).
14. N.E. Shemetulskis, D. Weininger, C.J. Blankley, J.J. Yang and C. Humblet, “Stigmata: an algorithm to determine structural commonalities in diverse datasets. Journal of Chemical Information and Computer Sciences, 36, 862 (1996).
15. C.M.R. Ginn, P. Willett and J. Bradshaw, “Combination of molecular similarity measures using data fusion.” Perspectives in Drug Discovery and Design, 20, 1 (2000).
16. J. Hert, P. Willett, D.J. Wilton, P. Acklin, K. Azzaoui, E. Jacoby and A. Schuffenhauer, “Comparison of fingerprint-based methods for virtual screening using multiple bioactive reference structures. Journal of Chemical Information and Computer Sciences, 44, 1177 (2004).
17. J. Hert, P. Willett, D.J. Wilton, P. Acklin, K. Azzaoui, E. Jacoby and A. Schuffenhauer, “Comparison of topological descriptors for similarity-based virtual screening using multiple bioactive reference structures.” Organic and Biomolecular Chemistry, 2, 3256 (2004).
18. Scitegic Inc. is at http://www.scitegic.com
19. H.L. Morgan, “The generation of a unique machine description for chemical structures: a technique developed at Chemical Abstracts Service” Journal of Chemical Documentation, 5, 107 (1965).
20. A. Bender, H.Y. Mussa, R.C. Glen and S. Reiling, “Molecular similarity searching using atom environments, information-based feature selection and a naïve Bayesian classifier.” Journal of Chemical Information and Computer Sciences, 44, 170 (2004).
Ranking NCI Dataset Syngenta Dataset
Method Top 1% Top 5% Top 1% Top 5%
Smax 8.2 38.9 5.9 19.1
SA-I 10.4 21.4 6.6 19.1
R1 11.5 21.4 6.8 18.7
R2 1.5 16.5 6.9 20.6
BKD 13.7 42.7 9.8 27.1
Table 1. Percentages of the active molecules retrieved in the top 1% and in the top 5% of the rankings for the NCI and Syngenta datasets.
Activity Class
Self-Similarity
Modal Data Fusion Substructural
Analysis
BKD
5HT3 antagonist 0.35 30.3 49.0 29.3 52.3
5HT1A agonist 0.34 21.9 37.2 30.1 38.2
5HT Reuptake inhibitor 0.34 39.6 49.7 33.1 45.8
D2 antagonist 0.34 27.1 37.4 27.5 38.7
Renin inhibitor 0.57 88.8 88.6 52.9 93.3
Angiotensin II AT1 antagonist 0.40 73.6 80.4 43.4 84.5
Thrombin inhibitor 0.41 49.4 58.6 35.6 63.1
Substance P antagonist 0.39 36.8 47.1 36.5 58.4
HIV protease inhibitor 0.44 53.5 61.6 34.1 68.5
Cyclooxygenase inhibitor 0.26 11.0 26.5 19.2 33.2
Protein kinase C inhibitor 0.32 35.6 48.0 35.6 49.4
Average over all classes 0.38 42.5 53.1 34.3 56.8
[image:16.595.87.390.119.243.2] [image:16.595.82.509.317.540.2]Activity Class Mean Maximum Minimum
5HT3 antagonist 21.2 41.00 1.9
5HT1A agonist 18.4 39.3 2.5
5HT Reuptake inhibitor 24.0 42.7 1.4
D2 antagonist 17.4 35.6 0.3
Renin inhibitor 80.5 93.2 3.0
Angiotensin II AT1 antagonist 48.0 81.7 3.6
Thrombin inhibitor 33.5 63.6 0.6
Substance P antagonist 26.9 57.7 0.5
HIV protease inhibitor 37.6 63.7 1.9
Cyclooxygenase inhibitor 9.4 21.1 0.3
Protein kinase C inhibitor 19.4 46.1 0.7
[image:17.595.82.440.125.342.2]Average over all classes 30.6 53.2 1.5
Table 3.Percentage of active molecules retrieved by single similarity searches over the top 5% of the ranked test-set for the MDDR datasets.
BKD
Activity Class MOLPRINT 2D ECFP_4A ECFP_4B
5HT3 antagonist 66.6 65.3 63.4
5HT1A agonist 57.1 58.7 57.5
5HT Reuptake inhibitor 46.1 50.3 49.0
D2 antagonist 53.7 55.2 54.2
Renin inhibitor 95.7 96.7 97.0
Angiotensin II AT1 antagonist 95.1 98.0 97.8
Thrombin inhibitor 66.2 74.8 74.1
Substance P antagonist 68.4 67.3 65.5
HIV protease inhibitor 76.0 80.8 80.8
Cyclooxygenase inhibitor 34.7 34.4 32.7
Protein kinase C inhibitor 54.6 49.6 50.3
Average over all classes 64.9 66.5 65.7
[image:17.595.81.444.402.627.2]Coefficient name Formula Top 1% Top 5%
Hamming Distance a+b-2c 12.8 43.7
Tanimoto Coefficient
c b a
c
− +
10.4 21.4
Rogers-Tanimoto
d c b a
d c
+ − +
+ 3 2 2
12.0 20.6
Russell-Rao
c d b a
c
− + +
12.1 20.5
Matching Coefficient
c d b a
d c
− + +
[image:18.595.79.386.116.289.2]+ 12.9 43.6