THESES SIS/LIBRARY TELEPHONE: +61 2 6125 4631
R.G. MENZIES LIBRARY BUILDING NO:2 FACSIMILE: +61 2 6125 4063
THE AUSTRALIAN NATIONAL UNIVERSITY EMAIL: [email protected] CANBERRA ACT 0200 AUSTRALIA
USE OF THESES
This copy is supplied for purposes
of private study and research only.
Passages from the thesis may not be
copied or closely paraphrased without the
REGIONS AND RESOURCES
by Dan C Witter
A thesis submitted for the
degree of Doctor of Philosophy of the
Australian National University
Except where otherwise acknowled~ed ·s thesis is the~esult of ori ·nal work on the
part of the candidate.
C'.
-OJ/1
,
ACKNOWLEDGEMENTS
This thesis project was funded by the National Parks Foundation of New South Wales to carry out research for cultural resource management. The work was conducted at the
Prehistory Department, Research School of Pacific Studies with the full use of
equipment and facilities. I would like to thank Jack Golson for his support in the
Department during my research. I also would like to thank Jeanette Hope for making
available the vehicle from the National Parks Foundation for my field work. Thanks
also go to Sharon Sullivan for coordinating my grant with the National Parks
Foundation and for providing me with Service contacts in the field.
My field work in the Tibooburra area was based at Sturt National Park and I would like to thank John Gerritsen and Rod Holmes for all that they did. I also want to thank
Frank Nichols of 'Pindera Downs' for his help. I further greatly appreciate the efforts by Isabel McBryde to.provide me with students to take with me in the field as
assistants. These were Helen Blaine, Colin Yates, Clair Sheppard and the late Peter
May. Thank you for this help. In the laboratory I would like to thank Sally Brockwell
and Prue Gaffey.
I have had many useful discussions with my colleagues who have made helpful
suggestions. These include Jim Rhodes, Peter Hiscock, Johann Kamminga, Colin
Pardoe, Scott Cane, Jim Stockton, Kernan Hotchin, Rosemary Buchan, Laila Haglund
and Paul Packard. I have doubtless left out other important names. I thank you all for
your stimulation and sharing of ideas.
I have a special debt to those who undertook a supervisory role at the Department. Phil
Hughes was most helpful with practical advice and suggestions with my text. I would
particularily like to thank Alan Thome for supporting my project at the outset, and
helping me to see it through to completion.
In the writing and production of the thesis, and learning to use a word processor, I
would like to thank Maureen Johnson, Jeanine Mummary, Gabrielle Braun and Lesley
Thompson. For doing drawings and maps I would like to thank Win Mumford and
Betsy-Jane Smith. I also would like to thank Douglas Hobbs at the University of New
England.
The project never would have been completed without the help of Colin Pardoe and
helping me with its organisation. Colin Pardoe also gave me access to the software for
the computer printed figures and tables and produced them for me.
My final thanks go to my family. I am grateful to my wife Alison for her help in the field. I also want to thank Alison and my daughters, Georgina, Clara and Julia for
coping with me during this project. I also thank my parents for their support and
ABSTRACT
The goal of this thesis is to bring together several topics for the purpose of site
prediction and significance assessment in management archaeology.
This was approached as a survey project along a great transect with three sample areas
at Boorowa, Cobar and Tibooburra. The field operation was concerned with the
methodology of sampling by transect and quadrat, land systems analysis, sample unit
coverage and site recording. A technological system for classifying, recording and
analysing stone artefacts was developed in order to compare the artefact assemblages
within and among the sample areas.
The results of the survey showed that the main determinants of artefact morphology
were the material type, logistics of access and transport, and the reduction strategy.
Few assemblages provided indications of functional differences. Sites with a
substantial portion of microblade manufacture were found to be distinctive in terms of
the rest of the stone assemblage and site structure. These also were mostly in
fine-grained mosaic environments, and were interpreted as "micro blade base camps", with
differences in land use strategies from other sites which are presumed to be later in
time. Broader patterns of regional variation show a "core tool oriented" pattern east of
the Bogan River, and a "flake tool oriented" pattern to the west. Other details
concerning hearths, grinding stones and specialised flake tool manufacturing processes
were found to vary along the great transect. Methods for measuring this regional
variation are proposed in the form of Stone Technological Regions, Land Systems
Divisions, Cultural Adaptive Areas and Archaeological Formations.
The thesis project and its results are presented as a methodological and theoretical
TABLE OF CONTENTS
CHAPTER 1 INTRODUCTION 1
The Problem 1
DEFINITIONS AND CONCEPTS 2
The Concept of Regional Variation 2
Cultural Adaptation 3
Cultural Strategies 3
The Concept of Comparability 4
HISTORY AND BACKGROUND OF THE PROJECT
5
The Unifying Theme 8
STRUCTURE OF THE THESIS 11
CHAPTER2: THE GREAT TRANSECT 14
RESEARCH DESIGN 14
THE GREAT TRANSECT 18
General Context of the Great Transect 18
Sample Area Selection and Preliminary
Expectations 21
THE FIELD OPERATION 23
CHAPTER3: AUSTRALIAN STONE INDUSTRIES 25
STONE ARTEFACTS 25
General Principles 25
The Stone Technological Industry
Concept 26
CORE AND FLAKE TOOL INDUSTRY 28
Core Reduction 29
Flake Production 34
Flake Tool Reduction: Marginal
Contraction 35
Flake Tools: Edge Shaping 40
Quartz Technology 43
Core and Flake Tool Industry:
Discussion 45
MICROBLADE INDUSTRY 46
Prismatic Conical Blade Core Reduction 47
Burin Blade Core Reduction 50
Tranchet Blade Core Reduction 52 Alternating Platform Blade Core
Reduction 54
Cube (or Rotated) Blade Core Reduction 56
Quartz Steep Platform Blade Core
Reduction 57
Quartz Faceted Bipolar Blade Core
Reduction 57
Microblade Cores: Comment 58
Bondi Backed Blades 60
Geometric Backed Blades 62
Blade Reduction: Comment 63
Microblade Industry: Other Tool Forms 64
Microblade Industry: Discussion 64
TULA INDUSTRY 67
Tula Core Reduction 68
Tula Flake Reduction 69
Tula Industry: Discussion 73
PIRRI INDUSTRY 74
Pirri Core Reduction 75
Pirri Point Reduction 75
QUARTZLAMELLATEINDUSTRY 76
Lamellate Core Reduction 76
Lamellate Industry: Discussion 77
ABRADED STONE INDUSTRIES . 78
Percussion Industry 78
Grind Stone Industry 78
Ground Edge Industry 79
Sculpted Industry 79
CHAPTER4: METHOD 80
Methodology of the Project 80
SAMPLING 80
Principles of Sampling 80
Sample Strategy 81
Coverage Analysis 84
Sample Units 87
SITE RECORDING 89
Definition of a Site 89
Site Recording Principles 91
Analytical and Summary Site Recording 95
Site Recording Procedures 96
STONE ARTEFACT RECORDING 97
Reduction Chart 101
Debitage Analysis 107
CHAPTERS: THE TIBOOBURRA AREA 114
BACKGROUND 114
Environment 114
Aboriginal Culture 119
Previous Work 119
ARCHAEOLOGICAL LAND SYSTEMS 120
Tibooburra Riparian Land System Type 121
Tibooburra Plains Land System Type 122
Tibooburra Ranges Land System Type 123
Tibooburra Dunes Land System Type 124
FIELDWORK 125
SAMPLE PATTERN AND COVERAGE 126
Effective Coverage 130
Site Frequency 130
Site Types 132
Artefact Abundance 132
STONE ARTEFACT ANALYSIS 134
Materials 134
Implement Assemblages 134
Debitage Assemblages 144
ARCHAEOLOGY OF THE TIBOOBURRA AREA 152
Riparian Sites 152
Plains Sites 154
Ranges Sites 154
Dunes Sites 156
Land Use Models 157
CHAPTER6: THE COBAR AREA 161
BACKGROUND 161
Environment 161
Aboriginal Culture 166
Previous Work 167
ARCHAEOLOGICAL LAND SYSTEMS 168
Cobar Valley Land Systems Type 168
Cobar Uplands Land Systems Type 169
Cobar Ranges Land System Type 170
FIELDWORK 170
SAMPLE PATTERN AND COVERAGE 171
Effective Coverage 175
Site Frequency 175
Site Types 177
Tool Abundance 177
STONE ARTEFACT ANALYSIS 177
Materials 177
Implement Assemblages 179
ARCHAEOLOOY OF THE COBAR AREA 193
Valley Sites 193
Uplands Sites 194
Ranges Sites 195
Land Use Models 196
CHAPTER 7: THE BOOROWA AREA 199
BACKGROUND 199
Environment 199
Aboriginal Culture 204
Previous Work 205
ARCHAEOLOOICAL LAND SYSTEMS 206
Boorowa Valley Land System Type 207
Boorowa Basin Land Systems Type 208
Boorowa Ranges Land Systems Type 209
FIELDWORK 209.
SAMPLE PATTERN AND COVERAGE 210
Effective Coverage 210
Site Frequency 214
Site Types 214
Artefact Abundance 214
STONE ARTEFACT ANALYSIS 214
Materials 217
Implement Assemblages 217
Debitage Assemblages 226
ARCHAEOLOOY OF THE BOOROWA AREA 237
Valley Sites 240
Basin Sites 240
Ranges Sites 241
Land Use Models 242
CHAPTERS: VARIATION AND CULTURAL STRATEGIES 244
VARIATION AMONG THE SAMPLE AREAS 244
Flake Morphology 244
Tool Morphology 248
Hearths and Ground Stone 249
Environment 251
LAND USE MODELS 252
CHAPTER9: REGIONAL PATTERNING 257
Types of Patterning 257
STONE TECHNOLOOICAL REGIONS 258
ARCHAEOLOOICAL LAND SYSTEMS DIVISIONS 264
ARCHAEOLOGICAL FORMATIONS 267
REGIONAL SCHEMES 270
CHAPTER 10: ARCHAEOLOGICAL RESOURCE MANAGEMENT 272
CULTURAL RESOURCE MANAGEMENT 272
Research in Management 272
Historical Perspective 273
Management Implementation 27 5
SIGNIFICANCE IN MANAGEMENT 277
SITE PREDICTION 279
A RESEARCH FRAMEWORK 280
The Site 281
The Locality 282
The Region 383
A Framework 284
THE ACADEMIC CONTEXT 290
LIST OF REFERENCES 292
APPENDIX 314
APPENDIX A. SITE DATA FOR THE TIBOOBURRA AREA APPENDIX B. SITE DAT A FOR THE COBAR AREA
LIST OF TABLES
Table 5.1 Table showing the sample units within the land systems and
the recorded sites. 127
Table 5.2A Table showing the effective coverage of transects by land
systems type. 129
Table 5.2B Table showing the effective coverage of quadrats by land
systems type. 129
Table 5.3A Table showing the total transect distance per obtrusive
and unobtrusive sites by land system type. 131
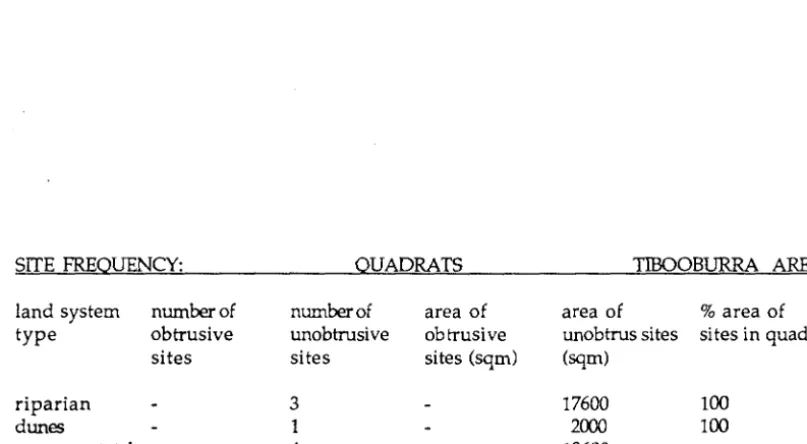
Table 5.3B Table showing the total quadrat area per obtrusive and
unobtrusive sites by land system type. 131
Table 5.4 Table showing site types by number recorded by land
systems type. 133
Table 5.5 Table showing numbers of certain implement forms as well
as densities of tools by effective area. 133
Table 6.1 Table showing the sample units within the land systems and
the recorded sites. 172
Table 6.2A Table showing the effective coverage of transects by land
systems type. 174
Table 6.2B Table showing the effective coverage of quadrats by land
systems type. 174
Table 6.3A Table showing the total transect distance per obtrusive and
unobtrusive sites by land systems type. 176
Table 6.3B Table showing the total quadrat area per obtrusive and
unobtrusive sites by land systems type. 176
Table 6.4 Table showing site types recorded by land systems types. 178
Table 6.5 Table showing numbers of certain implement forms and
densities of tools by effective area. 178
Table 7.1 Table showing the sample units within the land systems and
the recorded sites. 211
Table 7.2A Table showing the effective coverage of transects by land
systems type. 213
Table 7.2B Table showing the effective coverage of quadrats by land
systems type. 213
Table 7.3A Table showing the total transect distance per obtrusive and
unobtrusive sites by land system type. 215
Table 7.3B Table showing the total quadrat area per obtrusive and
Table 7.4 Table showing site types recorded by land systems type. 216
Table 7.5 Table showing numbers of certain implement forms as well
as densities of tools by effective area. 216
Table 8.1 Table showing the morphological types of debitage for the
three sample areas. 245
Table 8.2 Table showing the proportions of stone materials recorded
as debitage for the three sample areas. 246
Table 8.3 Table showing the ratios of hearth counts and ground stone
material recorded per site in each sample area. 250
Table 9.1 Table showing the distribution of technological industries
in stone technological regions. 261
Table 9.2 Archaeological Land Systems Divisions as indicated by the
three sample areas. 266
Table 9.3 Cultural Adaptive Areas as indicated by the three sample
areas. 268
Table 9.4 Archaeological Formations as indicated by the three sample
LIST OF FIGURES
Figure 1.1 Location of the study area and sample area. 9
Figure 2.1 Locations of published archaeological work in NSW. 15
Figure 2.2 Physiographic profile through the study area. 19
Figure 2.3 Climatic variation along the great transect. 19
Figure 3.1 Core and Flake Tool Industry: cores. 33
Figure 3.2 Core and Flake Tool Industry: flakes. 36
Figure 3.3 Core and Flake Tool Industry: flake tool marginal contraction. 39
Figure 3.4 Core and Flake Tool Industry: specialised flake tools. 42
Figure 3.5 Preforming on a blade core. 49
Figure 3.6 Microblade core techniques. 51
Figure 3.7 Alternating platform blade core. 55
Figure 3.8 Microblade Industry: blade cores. 59
Figure 3.9 Blade backing rejects. 61
Figure 3.10 Microblade Industry: backed blades. 65
Figure 3.11 Blade reduction processes. 66
Figure 3.12 Tula Industry: cores and slugs. 72
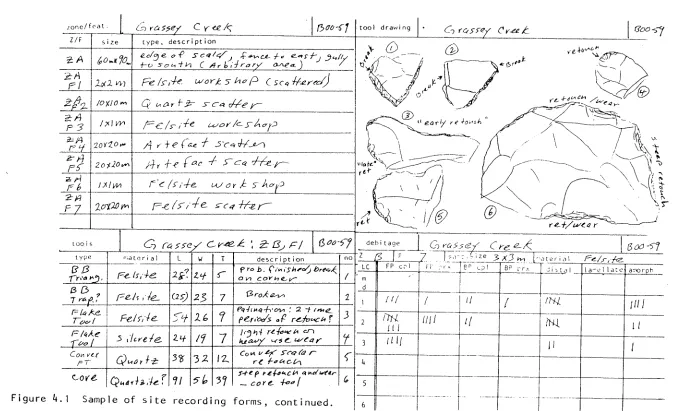
Figure 4.1 Sample site recording forms. 98
Figure 4.2 Lay out of the Reduction Chart. 103
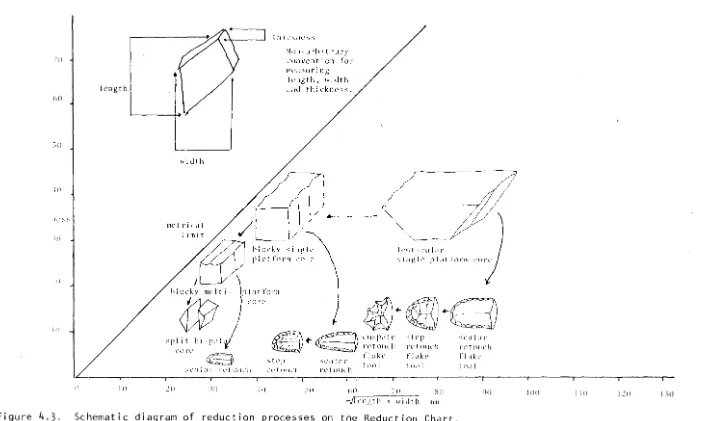
Figure 4.3 Schematic diagram of reduction processes on the Reduction
Chart. 105
Figure 4.4 Reduction chart format for the thesis. 106
Figure 4.5 Debitage histogram format for the thesis. 109
Figure 5.1 Map showing the location of the Tibooburra sample area. Sections A and B show the land systems, sample units
and sites recorded. 115
Figure 5.2 Reduction Chart of Tib-1. 136
Figure 5.3 Reduction Chart of Tib-107. 136
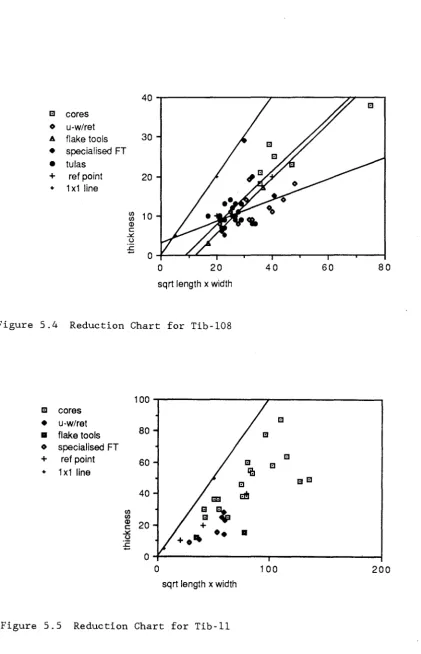
Figure 5.4 Reduction Chart of Tib-108. 137
Figure 5.5 Reduction Chart of Tib-11. 137
Figure 5.7 Reduction Chart of Tib-109, quartz. 139
Figure 5.8 Reduction Chart of Tib-118. 141
Figure 5.9 Reduction Chart of Tib-19. 141
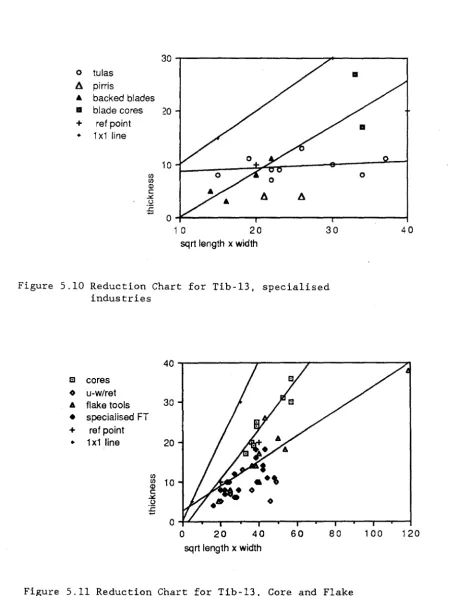
Figure 5.10 Reduction Chart of Tib-13, specialised Industries. 143
Figure 5.11 Reduction Chart of Tib-13, Core and Flake Tool Industry. 143
Figure 5.12 Reduction Chart of Tib-114. 145
Figure 5.13 Debitage histogram for Tib-1. 146
Figure 5.14 Debitage histogram for Tib-107. 146
Figure 5.15 Debitage histogram for Tib-11. 148
Figure 5.16 Debitage histogram for Tib-108. 148
Figure 5.17 Debitage histogram for Tib-109, silcrete. 150
Figure 5.18 Debitage histogram for Tib-109, quartz. 150
Figure 5.19 Debitage histogram for Tib-114, quartz. 151
Figure 5.20 Debitage histogram for Tib-13. 151
Figure 5.21 Debitage histogram for Tib-19. 153
Figure 6.1 Map showing the location of the Cobar sample area. Sections
A, B, C and D show land systems, sample units and sites. 162
Figure 6.2 Reduction Chart of Cob-80. 180
Figure 6.3 Reduction Chart of Cob-137. 180
Figure 6.4 Reduction Chart of Cob-139, fine-grained stone. 182
Figure 6.5 Reduction Chart of Cob-139, quartz. 182
Figure 6.6 Reduction Chart of Cob-75. 184
Figure 6.7 Debitage histogram of Cob-80, fine-grained. 186
Figure 6.8 Debitage histogram of Cob-80, coarse- grained. 186
Figure 6.9 Debitage histogram of Cob-103. 187
Figure 6.10 Debitage histogram of Cob-103, workshop. 187
Figure 6.11 Debitage histogram of Cob-75, Fine-grained volcanic. 188
Figure 6.12 Debitage histogram of Cob-75, quartz. 188
Figure 6.13 Debitage histogram of Cob-75, porcelainite workshop. 190
Figure 6.15 Debitage histogram of Cob-139 B20, quartz. 191
Figure 6.16 Debitage histogram of Cob-139 C29, microblade workshop. 191
Figure 6.17 Debitage histogram of Cob-140. 192
Figure 7.1 Location map showing The Boorowa area. Sections A, B and C
show land systems, sample units and sites recorded. 200
Figure 7.2 Reduction Chart of Boo-55. 218
Figure 7.3 Reduction Chart of Boo-72. 218
Figure 7.4 Reduction Chart of Boo-59, Microblade Industry. 220
Figure 7.5 Reduction Chart of Boo-59, fine-grained stone - 1. 220
Figure 7.6 Reduction Chart of Boo-59, fine grained stone - 2. 222
Figure 7.7 Reduction Chart of Boo-59, quartz. 222
Figure 7.8 Reduction Chart of Boo-56, Microblade Industry. 224
Figure 7.9 Reduction Chart of Boo-56, fine-grained stone. 224
Figure 7.10 Reduction Chart of Boo-56, quartz. 225
Figure 7.11 Debitage histogram of Boo-55 felsite. 227
Figure 7.12 Debitage histogram of Boo-55, silcrete. 227
Figure 7.13 Debitage histogram of Boo-72, felsite. 228
Figure 7.14 Debitage histogram of Boo-72, fine-grained volcanic. 228
Figure 7.15 Debitage histogram of Boo-56, silcrete. 230
Figure 7.16 Debitage histogram of Boo-56, quartz. 230
Figure 7.17 Debitage histogram of Boo-56 All, microblade workshop. 231
Figure 7.18 Debitage histogram of Boo-56, lamellate workshop. 231
Figure 7.19 Debitage histogram of Boo-56, bipolar workshop. 232
Figure 7.20 Debitage histogram of Boo-56 B7, quartz workshop. 232
Figure 7.21 Debitage histogram of Boo-56 A3, quartz workshop. 234
Figure 7.22 Debitage histogram of Boo-56 Gl5, quartz workshop. 234
Figure 7.23 Debitage histogram of Boo-56 Hl 7, quartz workshop. 235
Figure 7.24 Debitage histogram of Boo-59, quartz. 235
Figure 7.25 Debitage histogram of Boo-59, felsite. 236
Figure 7.26 Debitage histogram of Boo-59 Bl2 silcrete workshop. 236
Figure 7.28 Debitage histogram of Boo-59 B8, microblade workshop. 238
Figure 7.29 Debitage histogram of Boo-59 B7, microblade workshop. 239
Figure 8.1 Schematic model of a possible difference in settlement pattern between the microblade mode/period and the
non-micro blade. 256
Figure 9.1 Stone Technological Regions in Southwestern Australia. 260
Figure 10.1 Flow chart showing the research process in management surveys. 287
CHAPTER 1
INTRODUCTION
The Problem
This thesis is a study of stone artefact variation among three different environmental
types in New South Wales. The aim is to try to discover processes of land use that
allow predictive modeling of site locations and contents. The broader objective of this
work is to provide a methodological and theoretical basis for the conservation of
archaeological sites, even though most of the project is concerned with the archaeology
of Southeastern Australia.
In some respects this is actually three theses. Firstly, it was necessary for me to
develop a technological and logistical approach towards stone artefacts for the purposes
of comparison among regions. This had to be used in the context of three separate
surveys and related to the environmental context of sites and assemblages. Finally, I
had to develop a methodology which was applicable for heritage conservation, and
could address the concepts of site prediction and significance in the context of
management archaeology.
I intend to show that there is considerable archaeological variation from one region to
another in Southeastern Australia. I will try to illustrate how this can be explained
using models about Aboriginal cultural processes and a knowledge of how the
archaeological record is formed. In management such an understanding is essential to
assess the meaning and significance of known sites. Also needed is the capacity to
make predictive statements about where other sites can be expected. Inherent in this is
the issue of how a research dimension can be related to applied archaeology. I do not
expect to disentangle the complex relationship between academic and public
archaeology here, but it is a theme which is fundamental to the project. It also should
be understood that this thesis is not concerned with other types of site significance such
as from an Aboriginal point of view, or in terms of Aboriginal heritage. This would be
yet another project.
To summarise: the problem is concerned with regional variation in the archaeological
record: how do we find out what it is, how do we explain it, and how can we then
The remainder of this introduction is addressed towards explaining how certain terms and concepts are used in the thesis, and then to give some historical background as to
why I under took this project.
DEFINITIONS AND CONCEPTS
My approach towards this thesis was derived from cultural ecology (Steward 1955) and
the relationship between environmental determinants and cultural adaptation (see Harris
1969:643-87). In order to clarify how I perceive cultural adaptive processes, and how I think they can be discovered, it is necessary to discuss some of the key concepts.
The Concept of Regional Variation
Geographical patterning is a common archaeological interest (e.g. Hodder and Orton
-1976), and has received some attention in Australia. Tindale, for example, put forth a
regional successional scheme for the Southeast of South Australia (Tindale 1957), and
McCarthy has nominated certain cultural regions on the basis of artefact types
(McCarthy 1976:94-8). Recently, more sophisticated studies of regional variation have
been carried out such as the study of gene flow throughout Australia using Aboriginal
skeletal remains by Pardoe (1984).
Part of the idea of regional variation is one of scale: how large should a region be and
how does one define it? There seems to be little emphasis on relative scales of
investigation in the Australian literature (Head 1984: 10). For example, when does a
"local level" become a "regional level"? This distinction depends on the subject of the
study. In the case of hunter-gatherers it might be defined in terms of the size of group
territory, land use patterns, or language. In this thesis, regions are defined in terms of
environment and stone artefacts.
The approach towards the environment here is by land systems. This provides a means
of defining environmental types at a local land use level as well as at a larger scale.
Later, in Chapter 9, I will propose a broad regional scheme of Land Systems Divisions
which is intended to reflect the degree of environmental difference which would have
affected Aboriginal behaviour.
The stone artefacts were mainly approached in technological terms. Due to differences
in material availability and methods of manufacture, there should be distinctive stone
artefact areas. This has led to the proposed Technological Regions scheme, which also
Cultural Adaptation
By cultural adaptation, I mean the way in which a culture comes to terms with its
environment. If a culture is to survive at all, it must permit its members to adapt to their
natural surroundings. Regardless of the extent to which individuals may be preoccupied
with their social or spiritual life, they still must cope with a variety of environmental
factors such as drinking water, food and materials.
Most archaeological remains are associated with this aspect of life, such as stone tools,
manufacturing waste, food debris, and settlement locations in an environmental context.
It should be possible to develop a cultural adaptive frame work to explain the behaviour
which creates the major part of the archaeological record. Ultimately it would be
desirable to be able to integrate this with other aspects of culture (i.e. social or
religious). For example, there are a variety of features which suggest various
ceremonial, social or cognitive facets of past Aboriginal culture, such as stone
arrangements, bora rings, rock art, exchange items, and so on. These now are studied in
isolation since the cultural adaptive background is not known.
Regional differences in cultural adaptations can be expected, and it would be desirable
to identify such areas of behaviour. This would be a way of integrating the land
systems and stone technological patterns mentioned above with other aspects of the
archaeological record and such ethnographic material as is available. An attempt to do
this is given later in Chapter 9 as a Cultural Adaptive Area scheme.
Cultural Strategies
The concept of a strategy as a heuristic device is regularly used in population ecology
and related fields (e.g. MacArthur and Connell 1966, Emlen 1973). This type of
concept has been used in a cultural context for optimum foraging strategy analyses (e.g
Winterhalder and Smith 1981, Crumly 1979, Bettinger 1980). For the purposes of this
thesis I use strategies to refer to particular cultural adaptive processes. At a very broad
level, cultural strategies can be seen as adaptations to both the social and the
biophysical environment, and there probably is no real boundary. In archaeology
however, what we have are materials representing mainly the biophysical aspects which
relate to technology, economy and land use. It is in this later context that I am
concerned with cultural strategies.
A cultural strategy itself is a product of cultural evolutionary processes. The
appearance of what I define later as the Microblade Industry was not because there
because the stone was used up. If, as I have suggested elsewhere, (Witter 1988:39-40)
the industry depended upon the extensive transport of cores for blade production, then this would have conflicted with an essential principle of nomadism, which is to travel
light. The manufacture of backed blades may be assumed to be due to the specifications
for a particular type of implement which was required at the time. To say that the production of backed blades was a matter of "style" does not explain their presence. I
considei; that the industry arose as an adaptive response, and its abandonment implies
that its adaptive value was no longer important. The suggestion of "diffusion" from
outside of Australia is not helpful (Dorch 1981 ). For the design of a particular
implement to be adopted, regardless of the source of knowledge, it is necessary to have
an appropriate set of cultural conditions. It is an understanding of these which provides
an explanation.
Strategies are sets of rules. Individuals make decisions according to these rules. For
example, a least-cost rule of stone transport or access to food resources is likely to have
a major effect on where a camp site is located and what the artefacts in it will be like.
The collective patterning of this should indicate something of the broader strategies of
settlement and stone technology. This should be indicated by the logistical processes of
the flaked stone, and the way in which the distribution of artefacts maps out the pattern
of activities over the landscape.
A knowledge of these strategies leads to a predictive capacity. It should be possible to
predict where archaeological sites are, and what will be in them. A failure in these
predictions serves to indicate that either the model is inadequate, or there are situations
where different sets of rules are operating.
The issues of identifying adaptive strategies and site prediction by explanation are an
important theme in this thesis. In some projects extrapolation from empirical patterning
is taken as "site prediction" (e.g. Huges and Sullivan 1984:37, Ross 1986:66). It will be
argued later that the expectations derived from this method should be more properly
referred to as "forecasting". In Chapter 7, I evaluate the preceding three Chapters on
the study areas as to how adaptive strategies can be inferred. The issue of prediction by
explanation is finally discussed in Chapter 10.
The Concept of Comparability
Any study of regional variation needs to address the issue of comparability of the data.
For example, what biases are there in different studies? What concepts were being
The meaning of data is not self evident. What, for example, is an "archaeological site"?
(see a discussion of this in Chapter 4). This is a basic unit of survey data, yet there is no
consistency of how many artefacts are needed to identify a site, nor whether the criteria
to be used are the exposures, the land form or the extent (not normally visible) of the
cultural deposit. The results of sites recorded over a landscape are also ambiguous.
Within a given survey, parts where the ground surface was well exposed and bare can
be expected to give different results from areas where there was an aggrading surface
and heavy grass cover.
It is unavoidable that sites are defined on an arbitrary basis, and that there will be parts
of the area surveyed where they cannot be detected. In spite of this, site frequency is a
type of survey analysis carried out regularly, and inferences about human behaviour are based on it. If the factors which go into detecting and identifying sites differ from one
region to another, then it undermines the comparisons to be made and makes an
evaluation of regional variation difficult.
In practice, most of my project was oriented towards methodological problems such as site recording and documenting the survey process. This has included problems of
sampling, and the need to control the survey method by what I will define later as
coverage analysis.
I also had to develop a system of artefact classification and analysis which can be used
consistently, regardless as to the region, stone material or manufacturing process. This
approach differs from the conventional typological approach as is normally used in Australia (i.e. McCarthy 1976). Therefore, in the absence of other sources to cite, it is
necessary to present the basis for this approach in detail in Chapter 3.
As the following discussion on the history and background to the project shows, these
methodological issues have been a major preoccupation which led to the thesis.
HISTORY AND BACKGROUND OF THE PROJECT
It should be evident by now that I hope to weave together a variety of themes in this
thesis such as regional variation, cultural adaptive strategies, survey methodology and
cultural resource management. Any one of these offers abundant scope for research. I
The importance of the methodological problems mentioned above became apparent to
me in 1970 at the first conference of the Southwest Archaeological Research Group
(SARG) conference in Prescott, Arizona (Oumerman 1971, SARO 1974). By this time
a number of large scale survey projects had taken place in the Southwestern United
States, both as grant-funded research and as salvage surveys. Moreover, attempts had
been made to compare the data obtained in one survey with that of another. The SARG
conference was motivated by the discovery of the lack in comparability in attempts to
compare one survey report with another.
The approach adopted by SARO was for all of the participants to agree upon a problem
orientation and "core" data set as a research design. This was to be shared by all of the
members, and was: "why do people settle where they do, and why do larger
communities develop?" In order to pursue these issues a minimum set of field
observations was required in standardised form. These categories were designed to
record environmental factors which might be relevant. This research design was to be
applied to all projects in addition to various other interests or information requirements.
A large number of organisations and institutions participated in this programme, and an
enormous amount of data was processed, but in the long term, it cannot be said to have
been successful.
The methodological problems have not gone away. Perhaps excavated sites can be
treated as self-contained, but sites recorded on survey are necessarily related to a
general pattern and have to be put into a regional context. Even allowing for
differences in problem orientation or sample strategy, it is probably thought by most
archaeologists that the data obtained on most surveys should have some level of
analytical compatibility. This view is contradicted by Daniels (1978:32) who claims
that this can come only when there is a single research design and rigid controls of bias.
Since I was present at the initial SARO conference and participated in the program, I
have had the opportunity to consider the weaknesses of this massive endeavour. I
believe that SARG did not meet its expectations because it did not resolve the necessary
methodological and theoretical requirements. These were, in fact, addressed at the
outset, but abandoned as being too difficult to solve in the short term. It was felt that
early results were particularly desirable, and due to the commitment to the existing
scheme, proposals made later to re-examine methodological shortcomings were
discouraged.
One example of this was the case of environmental observations. Recording
wood. The scale of environmental observations in the SARG research design were
arbitrary and not based on any body of theory as to how people range over the
landscape.
Thus one crucial issue was the quality of the data and the lack of developed analytical
concepts in survey. By an analytical concept I mean a theoretical basis for making
observations in the field. In ecology, for example, there is a body of theory about
dominance .. This may be measured in various ways such as by biomass or canopy
cover. The results may be used to consider a variety of theoretical problems such as the
processes of vegetational succession in a region. In archaeology it is difficult to find an
equivalent approach. There is, for example, a body of theory about settlement strategy,
and some assumptions that site frequency should reflect this, but the methodology for the acquisition of data are not at the same systematic level.
Another issue not pursued by SARG was one I have already referred to, which is taking the distribution of sites within a region and their contents at face value. Formation
processes (e.g. Schiffer 1972, 1973), and other site detection conditions greatly affect
where and how many sites are found. Dots on a map are not enough, and the effects of
alluviation, deflation or pasture cover must be quantified in order to evaluate the extent
and nature of the missing data.
These problems have an especial relevance to management. If an archaeological impact
survey is carried out, how valid is it as a statement of the cultural resource? Can the
data be used in a broader analysis to predict where other sites will be?
In Australia, most archaeological fieldwork takes place on management surveys. It is a
common experience, however, that the data obtained is difficult to use even for simple research projects. In management there is a special interest in being able to use such
data for predictive analysis or to define the archaeology of particular regions since
actions and recommendations are proposed in this context.
At the 49th ANZAAS conference in Auckland in 1979, in a session on cultural resource
management, I presented a paper (Witter 1979) on predictive theory in public
archaeology. I outlined two approaches. The first was called empirical generalizations.
This is what is generally used as "predictive theory" and consists of statements about
where sites are usually found. I suggested that this could be made more effective if the
cultural patterning and site formation processes were separated and defined for different
The second approach was by explanatory models. For this, detailed site recording was needed for environmental, site contents and formational data. A research framework for
analyses then would be needed to develop explanatory models as to why the sites were
located where they were. If these were understood as adaptive strategies, then unknown
areas could be evaluated more realistically.
It was these methodological issues in the context of regional variation and predictive
modelling which became the basis for the research design of this thesis. The work was
further intended to be management oriented, since research in this area by those
government organisations responsible for prehistoric site conservation is normally very
limited. Part of the problem was one of feasibility - not only as to how an explanatory
predictive approach might work, or how regional variation can be evaluated, but how
this might be implemented at the management level and applied for conservation
purposes. This then, is the crux of the thesis, and what was referred to in the first two
paragraphs of this Introduction.
The field work component needed to cover a sufficiently broad range of environmental,
cultural and formational diversity. This was conceived as a "great transect" along the
Moomba Pipeline in New South Wales (Figure 1.1 ), where a previous archaeological
impact survey had been conducted (see Chapter 2). This transect went from an upland
temperate environment across the Darling River and out to the central desert.
The original idea was that my survey could be compared with the earlier work as a way
of demonstrating the consequences of different methodologies. As it turned out, the
difficulties in establishing comparability were greater than anticipated and this exercise
was abandoned. Instead, the project proceeded to investigate three sample areas along
the great transect: Boorowa, Cobar and Ti.booburra. These areas were chosen as
representative of three environmental types. The sites in these areas are dominantly
exposures of flaked stone debris, with little material that would date earlier than about
5000 years ago. Thus the type of cultural remains was to be held as constant as possible
and the environment varied. This approach developed into the research design which is
the subject of the next Chapter.
The Unifying Theme
The regional studies are not the main goals of this project, nor is the technological
classification of stone artefacts. The unifying theme is derived from a fundamental
principle in management archaeology, which is:- the need to know what the cultural
essential questions are: how does the archaeological resource vary, how do we find out,
and what does it mean?
From past experience, it cannot be said that the archaeological resource in NSW is well known for the purposes of cultural resource management. The main source of existing
archaeological knowledge is from university research, but this work has not provided
managers with:
1. A scheme of regional variation for archaeological sites and their contents across
NSW (the division by McCarthy, 1976, is hardly adequate).
2. Patterns of occupation over landscapes throughout NSW (although there are a variety of studies for particular areas).
3. A coherent set of models about land use strategies or other cultural processes
which affect site variability.
This knowledge is needed for management planning and assessment. It would be
unrealistic and perhaps unfair however to expect management priorities to be major
issues in university research. It is the government organisations with the statutory responsibility for cultural heritage conservation who must ensure that they are informed
managers.
Government archival sources in the form of a sites register, the accumulation of
archaeological impact statements, and other types of reports also has been found to be
of little practical help (as opposed to Flood 1984:58). Without specific requirements for
data quality and a framework for comparability, this material is piecemeal, idiosyncratic
and particularistic.
The current archaeological heritage literature also seems to be little oriented towards
systematics, or seriously address the problem understanding of the cultural resource.
The chief exception is a concern with the mechanics of a sites register (e.g. Flood et al.
1989), but this is not the same as an integrative and holistic approach (as will be
discussed at the end of this thesis).
What, in fact, is this cultural resource? Rock engravings or shell mounds may readily come to mind. Sites of this sort are rare, and however interesting they may be, only
make up a small part of the archaeological record. There can be no doubt that most
part of the visible archaeological resource. In spite of this, the basic questions remain
unclear: Are all open sites the same? How are the differences identified? Do they
form a pattern over the landscape? Can this be extrapolated elsewhere? How much error is there is field observations? What would explanatory models for the distribution
of this variability be like? The purpose of the main body of the thesis is to explore these
questions.
The final chapter is intended to show where the systematics and organisation of
information about the archaeological resource fits into the broader field of cultural resource management.
STRUCTURE OF THE THESIS
I will briefly summarise the chapters below and explain how they fit into the overall
thesis.
Chapter 2 presents the research design. I discuss some of the procedural problems and
how they were applied to the great transect. This is preparation for the Methods chapter
and the chapters on the three sample areas. I also give a brief account of the field work.
In Chapter 3 it is necessary to undertake a digression into stone artefacts. Without this
chapter it would be difficult to understand the techniques used for site recording, the
analysis by the Reduction Chart and the debitage histograms. One of the main aims of
the stone artefacts chapter is for its use in management. This requires a method for
recording stone artefacts in the field, and in which the analysis is simple. It requires a
basic grasp of the principles of stone technology and a knowledge of particular stone
tool manufacturing processes which I call "industries". The description of the stone
technological industries is comprehensive as it applies throughout the great transect, but
is not an attempt to write a definitive work on Australian stone tools.
Following this is Chapter 4, on methodology. I cover various aspect of sampling and
site recording and explain the general principles involved. I then discuss how these
were addressed in the field. Although in some respects this Chapter is slightly like a manual for doing survey work, the real goal is to clarify the way in which the field work
and analysis was conducted.
Next are the descriptions of the surveys in the three sample areas. The Tibooburra
(Chapter 5), Cobar (Chapter 6) and Boorowa (Chapter 7) areas are treated in the same
ethnography and previous archaeological work. Then I give an account of the land
systems which were the basis for the sample units. The coverage of the sample units is then evaluated in terms of the sites found. Following this is the stone tool analysis
using the Reduction Charts and this is followed by the debitage histograms. At this
stage I then discuss the archaeology in terms of the main trends, the sites which are
unusual, and finally, suggest some aspects of land use strategies. The objective of these
chapters is to try to identify some adaptive behavioural processes within the Late
Holocene for the sample areas. This is different from trying to produce three separate
regional prehistoric sequences for each.
In Chapter 7 the three sample areas are put together along the great transect and
compared in terms of their environmental and artefactual variability. This is with a
view to assess the regional differences and the potential for predictive modeling. The
objective of this Chapter is to examine the Australian archaeological record for
potential patterning which can be used in the context of cultural resource management.
The pattern of regional variation is expanded according the concepts of Stone
Technological Regions, Archaeological Land Systems Divisions, Cultural Adaptive Areas and Archaeological Formations. The point of this is not just to invent new terms.
These are concepts which I developed to measure particular kinds of processes which
operate on the landscape. Since these are the main factors which make up the
archaeological record in different regions, it is important to isolate them if the regions
are to be compared. Except for the Stone Technological Regions which applies to
Southeastern Australia, the other schemes are confined to the great transect.
Finally, in Chapter 10 comes the management implications. My approach to this is at
the practical level, and is consistent with the previous chapters. For this reason I have
avoided branching out into a review of the literature or a comparison of management
philosophies. My strategy has been to use the thesis itself as a model, rather than take a
didactic approach. The objective is to demonstrate empirically aspects of method and
theory which can be used, given the kind of archaeology normally encountered during
management surveys. For example, Chapter 2 is concerned with some of the aspects of
project research design relevant in management. The methodology Chapter was
oriented towards techniques which can be used in management surveys. The surveys of
the three sample areas are examples of the methodology for sampling, coverage,
Archaeological Land Systems Units and techniques for stone artefact analysis. These
are all feasible at the level of archaeological impact surveys. Chapters 8 and 9 are
background for the discussion of problems in site significance assessment and
a feed back process which can be used in heritage conservation. My final comments are on the potential of research in management which relate to academic research.
In some respects this final chapter on management will seem like an anomaly, since it
does not directly follow on from the three study areas. At a more abstract level
however, this thesis addresses the concepts and methods needed in management
archaeology. Fundamental to the principles of management is knowing the resource to
be conserved. A research framework is needed for this which will generate usable data
and models and provide a structure for regional variation. The ultimate intention is not merely a polemic about how managers need to know their resource better, but to show
CHAPTER2
TIIE GREAT TRANSECT
RESEARCH DESIGN
Before proceeding to the survey areas, I need to indicate the overall structure of the
research in order to show how the three areas are related.
The research strategy was to compare the prehistoric cultural ecology of three different
types of environments. This was most simply done by beginning with the relatively
humid temperate environment of the Dividing Range, and continuing into the arid zone.
As already mentioned, i~ was originally thought that the Moomba Pipeline Survey
would be of assistance. The results of this survey however did not produce sites in the
Dividing Range country, and the data were not recorded in a way to provide
comparability (the issue of comparability will be discussed more in the Methods
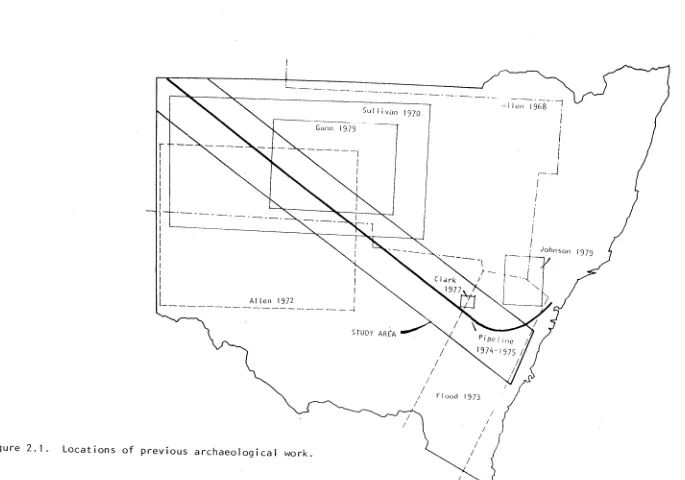
Chapter). Other work in the area of the Moomba Pipeline zone is listed below (see
Figure 2.1 ).
1. Allen, H. 1968: Most of northern NSW and part of southwest Queensland,
ethnography and literature review.
2. Sullivan, S. 1970: Northwestern NSW, ethnography and literature review.
3. Allen, H. 1972: Most of western NSW, survey and excavation.
4. Flood, J. 1973: The Southern Highlands of NSW and Victoria, survey and
excavation.
5. National Parks and Wildlife Service 1972 to 1974, various impact reports by
Haglund and Buchan: The Moomba Pipeline from Sydney to the Northwest
corner of NSW.
6. McCarthy F. 1976: The Cobar region, various art sites.
7. Clark, P. 1977: The Boorowa area, survey.
t-' V1
-·--·-·-·--·-·---Gunn 1979
r
I - - - )
I I I I I I I ] , · -/ I I I I I I I I
: I
L__ Allen 1972 I
- - - __j
Figure 2.1. Locations of previous archaeological work.
I
I I
I
Sul I ivan 1970
I I
I
I
I
I
-/ f I ood I 9 73
[image:32.842.91.776.58.538.2]9. Gunn, R. 1979: The Cobar region, various art sites.
This work generated a variety of questions, many of which relate to specific regional
adaptive problems, and ranging through demographic, economic, sociological and
chronological issues. This work also provided an exhaustive review of the
ethno-historical documentation, previous archaeological investigations and major environmental features.
Before proceeding, I should note that the Aboriginal tribal/linguistic name spellings used here are from Tindale (1974). This is for the purposes of consistency, although I
am aware that more recent orthographies maybe more accurate.
The work cited above provided a few regional models, such as that by Allen (1972) on
the relationship of Barkindji people of the Darling River and the Ngemba of the Cobar
area, or by Flood (1976, 1980) on the use of Bogong moths. Not surprisingly however,
these various projects did not generate any overall models or theories, except to fit into
the generally accepted chronological framework of a change in artefact types after 5000
years ago. It also should be noted that these few projects cover an extremely large area,
and the details of the archaeology remain mostly unknown. Any survey work I capi.ed
out would still be part of the on-going exploration.
My assumption at the outset was that site location was firstly due to environmental
determinants. These determinants required an optimal solution to factors such as water
and food within the context of a subsistence strategy (e.g. Winterhalder and Smith
1981). The subsistence strategy could be specialist or generalist, opportunistic or
intensive, and at various levels of complexity. As the interaction between the
environmental determinants and the cultural strategy is better understood, predictability
becomes increasingly reliable (Gumerman 1971, Williams et al. 1973, Jochim 1976).
This is not to say that there are not a variety of other factors which affect settlement
patterns and site contents, but this approach seemed to be the one most likely to account
for the greatest variability.
The implications for my thesis survey were: How are the resources distributed over the
landscape (food, water, stone etc.)? What kinds of cultural strategies are implied by site environmental location and site contents? What are the observational biases (sampling
and site detection) and forrnational factors (preservation, sedimentation, and erosion)
which will affect the field work and analysis? Finally: how can I compare regions in
terms of adaptive strategies? This last point should reflect broad evolutionary cultural
Another criterion was that this approach needed to be applicable to management
archaeology. An explanatory approach towards site prediction reveals something of the
dynamics of the culture. This knowledge of cultural processes provides a basis for a more insightful evaluation of site significance.
To fully realise such objectives would be extremely ambitious. At a more realistic level
I had two goals. Firstly, I hoped to assess the feasibility of developing land use models as a specific form of cultural adaptation. Secondly, I intended to describe some general patterns in artefact distribution, environment and formation among the regions, as
background for further model building.
My approach was to sample the study area and assess (a) the range of variation among
site types and within a site type, (b) the common and rare forms of this variation, (c) the
degree of complexity among the sites in terms of artefacts, environment, internal site
structure and landscape distribution, and (d) the biases due to sample coverage, site recording, and formational processes.
The above four points formed the basis for my survey methodology, and are expanded
in the section on sampling below. The survey needed to be able to define the ordinary
pattern as a basis for recognition of outstanding or unusual sites. The issue was that of
whether or not all sites are similar, and if some are different, how different is
"different"? In this case I was not concerned with typological similarities, but
differences in artefact manufacturing processes, as indicated by the assemblages. The
recognition of this was further dependent upon field conditions and observational biases. In this project I particularly wanted to develop an approach which would
quantify the survey coverage, assess the artefact variability and provide an
environmental context. These methods are described below as coverage analysis,
Reduction Charts and land systems units.
I considered that this empirical background was essential for the development of models
about land use within a region. None of the previous work had attempted modeling at
this level, nor provided sufficiently controlled data.
The strategy for a deductive approach for a relatively poorly known study area was to
divide the research into two stages. In the first stage, expectations would be formulated
about site distribution and artefact variability in conjunction with field work. This
would be re-evaluated and a second field exercise would take place. The variability of
proposed. The broader aspects of regional patterning then could be considered, and the
relevance of the research to cultural resource management would be evaluated.
THE GREAT TRANSECT
The transect approach has been used in a variety of archaeological surveys (Schiffer et
al. 1978:11-2). It is a technique which provides a description in the form of a
cross-section or a profile. This is particularly useful where boundary effects are relevant and change (or the lack of change) can be illustrated along a line from point A to point B.
Profiles for the great transect are given in Figure 2.2A for the physiography, and in
Figure 2.2B for the annual rainfall and evapo-transpiration (Plumb 1973).
Since limits on time and funds prohibited coverage of the entire 1 lOOkm transect, three
large sample areas were chosen. An alternative would have been to select several much
smaller areas for sampling. The use of many small areas would help to indicate boundaries or gradients, but a few large areas would describe better the variability
within a discrete region (see Krebbs 1978:92-3, Kershaw 1973:229, Whittaker
1975:112-3, Odum 1971:146, Daubenmire 1968:258 for different versions on this
distinction). The second alternative also was chosen because a small area might leave
out important environmental types or kinds of sites within a settlement pattern.
This study has avoided boundary areas in order to investigate the systemic properties of
major regions. Between the Cobar and Boorowa areas for example, the Dividing Range
slopes meet the Western plains and there appears to be a major boundary between arid
and temperate ecosystems. This is also the eastern extent of the Tula Industry and where the quartz technology of the Dividing Range country begins. An investigation of
this zone would have made it difficult to compare with other less complex areas. The
Darling River area was similarly avoided since the aquatic environment and associated
sites presents a considerably more complex and dynamic situation.
General Context of the Great Transect
The great transect line begins at Tibooburra. This area is a system of low ranges and
plains lying between the Strzelecki Dune Field to the west, and the Bulloo and other
arid lakes to the east. Ethnographically, the Aborigines of the area seem to have been
mainly associated with the Dieric language group (Oates and Oates 1970) of the eastern
Lake Frome basin, Coopers Creek, Grey Ranges and Bulloo basin. Within this system,
they belong to a cultural association known as the "Lakes Group" Beckett 1958:96,
...
\0
't res
900 800 700 (,QQ
•,oo
1100 300 200
100
Grey Ranges
100
Cobar P la Lcau
West Darling Plains
Peri L. ')arl ing R. Sandy Cr.
200 300 400 500
Figure 2.2A. Physiographic profile through the study area.
lllfll
800
700
600
500
400
300
Condobo I in 8;is in
Lilchlan R.
600 700
~::~
--
-Figure 2.2B. Climatic profile through the study area.
Highlands
Boorowa R.
Lake Cowa 11
duricrust silcrete which is the chief tool material. Quartz from Proterozoic rocks also is locally common.
Proceeding southeast are the arid plains and the Paroo channel country west of the
Darling. The ethnographic and archaeological cultures are continuous with those in the
Tibooburra area.
Reaching the Darling River, there is a system of flood channels and lakes which
periodically contain large quantities of water. The addition of these aquatic ecosystems and access to permanent water introduces a new economic dimension. The Barkindji
and other people of the Darling Valley, unlike their neighbours to the west, did not
practice circumcision, were perhaps less mobile and lived in greater population
densities. It is presumed that they had considerable interaction with their more upland
neighbours and, in times of widespread drought, had to accommodate an influx of
refugees (Allen 1972, 197 4 ). Except for the addition of fresh water shell middens, the
archaeology of the Darling is much like that further west. It is the core area of items such as "widows caps" and cylcons (Allen 1972:116-9).
Continuing south-east from the Darling River is the Cobar plateau. This is a semi-arid
zone of plains and small sandstone ranges drained by Sandy Creek. The region contains
extensive woodlands, especially cypress pine, and a variety of shrublands.
Ethnographically, the people were affiliated with the Wiradjuric language group as
Ngemba speakers. These people show some cultural elements from the west, such as
matrilineal moiety systems and the archaeology includes tulas and grinding equipment.
Pirri points
are
rare, but bondis are common. Silcrete is the main tool material, but in the eastern portion quartz and fine-grained volcanics from the Lachlan geosynclinebecome prominent.
To the south-east of the Cobar Area is a series of low ranges containing woodlands and
shrublands which form a small basin. The Lachlan River issues from the Dividing
Range near Forbes and passes through this basin, and west of Lake Cargelligo it enters
the Riverine Plain. Most of this area has been cleared for irrigation or pastoral use, although there seems to be a slight rain shadow effect. The Lachlan was probably a
focus for the Wiradjuri in a way similar to the Darling River for the Barkindji.
The archaeology of the Western Slopes is poorly known. Tulas and large flake tools are
rare and artefactual assemblages are often dominated by quartz (Witter 1980a). This
change in material reflects the absence of duricrust silcretes and the presence of a
At the town of Young, the gradient to the Dividing Range steepens and undergoes a
transition at about 500 metres elevation to the Southern Tablelands of the Boorowa
area. The Southern Tablelands are mostly uplifted rolling plains and hills with a few
ranges and some deeply incised valleys. There are eucalypt woodlands remaining on
the ranges, but most of the land has been cleared. Although quartz is an important
element in the archaeology, other materials such as silcrete, and a fine-grained volcanic
material are common, especially for use in the Microblade Industry which is well
represented. No tulas are known for this area and the heat-retainer hearths, common on
the western plains, are rare.
This is the eastern limit of the Wiradjuri and people with affinities with coastal
populations border on this zone. To the east the matrilineal moiety system gives way to
one where residential groups are apparently the main device used to define social
relations (Berndt and Berndt 1977:55).
Finally, east of the transect, are the high forested ranges which drop in a 100 metre
scarp to the coastal plain. The population densities here are presumed to be much
greater due to the abundance of fresh water, high productivity of the land and the .
availability of coastal resources. This is probably the best-known region in terms of an
archaeological sequence (Lampert 1971 a,b, McCarthy 1948, 1964, Flood 1980,
Johnson 1979).
Sample Area Selection and Preliminary Expectations
Using the background outlined above, including the review of the previous
archaeological work, an inspection of the National Parks and Wildlife Service Sites
Register, and a preliminary field trip along the great transect route, it was possible to
define my sample areas according to the following criteria:
1. They must consist of a large area (at least 50km x 50km) with a mixture of
drainage valleys, ranges and intervening terrain which would ensure vegetational
differences.
2. They cannot be on a major environmental boundary.
3. They cannot include a major aquatic habitat.
5. The areas should be equally separated and belong to different environmental
zones (arid, semi-arid and temperate).
6. The sites would almost entirely be Late Holocene in age.
Following these criteria I identified my three sample areas, the Tibooburra, Cobar and Boorowa areas (Figure 1.1).
From my preliminary research I also formulated some expectations of what I would find
from an examination of the topographic maps. These were mainly based on factors such
as where water seemed to be present, where different kinds of foods which could be
anticipated, and the implications for a generalised plant-oriented subsistence strategy.
1. Tibooburra area. Sites were expected to cluster along the main drainage (12 Mile
Creek). They also should occasionally occur in the blow out/claypan exposures
among the dunes, especially when associated with temporary lakes and swamps.
A series of sites should be associated with the rock outcrops and ridges. The
open plains of gibber and desert loam should have very few sites.
2. Cobar area. Sites were anticipated along the major drainage (Sandy Creek), and in
the drainage valleys in the uplands and ranges. At lower elevations they should be scattered along the flats associated with claypans and playa lakes. Sites
otherwise should be rare in the rolling hills and ranges.
3. Boorowa area. Sites should be associated with the Boorowa, Yass and Lachlan
River flood plains and along some of the tributaries. They also should be on high
ground overlooking small drainage valleys. Small sites should occur along the
upland ridges and spurs.
The approach towards these areas was to be mainly ecological (i.e. Bettinger 1980).
Problems in stone artefact analysis and interpretation were not anticipated at this stage.
The methods for assessing stone artefact technology and logistics had to be developed
in the middle of the project. The results of this work are given separately in Chapter 3.
It was important that the analysis avoid sites earlier than the Late Holocene. The
comparability of sites from one region to another within the same time period was difficult enough. It would be an enormous addition to introduce Pleistocene sites with
The criteria I used to determine Late Holocene sites were as follows:
1. Typological indicators. It is conventional to use particular tool types as a
chronological index (e.g. Johnson 1979). Also the relative size of artefacts in the assemblages is thought to indicate chronology (e.g. Lampert 1981). There is
some justification for certain tool types such as tulas or backed blades to be used
in this way, since they are products of particular manufacturing processes. The
use of size is much more uncertain since this can be greatly influenced by
proximity to the stone source.
2. Geomorphology. Another approach is the use of geological processes to
distinguish between the Holocene and Pleistocene periods. For example, features
such as lunettes or source bordering dunes indicate Pleistocene deposits, or the ·
degree of consolidation oxidation of sediments may have chronological implications.
During the project, an attempt was made to combine, where possible, the tool type
indicator and geomorphological approaches. The success of this is difficult to assess,
but no sites suspected of an age greater than Early Holocene were included in analysis.
THE FIELD OPERATION
The scheduling of the field work was intended to make use of those seasons with the
best weather for the region in a multi-stage approach (Redman 1973, Schiffer et al.
1978:16). In general, this worked well, except for being caught in the Tibooburra area
when the drought broke. The calender of field work was as follows:
Phase I
Tibooburra Area: 25 August 1980 to 21September1980
Boorowa Area: 17 October 1980 to 14 December 1980
Cobar Area: 24 February 1981 to 18 March 1981
Phase II
Tibooburra Area: 25 April 1981 to 11June1981
Cobar Area: 27 June 1981 to 10 July 1981
Boorowa Area: Trips based from Canberra, 17 October 1980 to 8 August 1981
In Phase I the first step was to spend 2 or 3 days driving over the region to get a general
noted and a general impression was obtained of the ground relative to topographic and
air photo maps. From this a preliminary physiographic stratification for sampling was
made. The Phase I portion was conducted mostly alone which allowed considerable flexibility in the daily programme. Generally, it took about 2 or 3 weeks to obtain an
appreciation of the contents and distribution of sites.
Phase II was intended to help fill up gaps in the sample and investigate problems
defined by preliminary analysis. Some sites were returned to for detailed recording.
In the course of travelling to the study areas along the great transect, it also was possible
to spot check for sites along the way. This was usually at roadside exposures or other