R E S E A R C H
Open Access
Distributional fold change test
–
a statistical
approach for detecting differential expression
in microarray experiments
Vadim Farztdinov
*and Fionnuala McDyer
Abstract
Background:Because of the large volume of data and the intrinsic variation of data intensity observed in
microarray experiments, different statistical methods have been used to systematically extract biological information and to quantify the associated uncertainty. The simplest method to identify differentially expressed genes is to evaluate the ratio of average intensities in two different conditions and consider all genes that differ by more than an arbitrary cut-off value to be differentially expressed. This filtering approach is not a statistical test and there is no associated value that can indicate the level of confidence in the designation of genes as differentially expressed or not differentially expressed. At the same time the fold change by itself provide valuable information and it is important to find unambiguous ways of using this information in expression data treatment.
Results:A new method of finding differentially expressed genes, called distributional fold change (DFC) test is introduced. The method is based on an analysis of the intensity distribution of all microarray probe sets mapped to a three dimensional feature space composed of average expression level, average difference of gene expression and total variance. The proposed method allows one to rank each feature based on the signal-to-noise ratio and to ascertain for each feature the confidence level and power for being differentially expressed. The performance of the new method was evaluated using the total and partial area under receiver operating curves and tested on 11 data sets from Gene Omnibus Database with independently verified differentially expressed genes and compared with the t-test and shrinkage t-test. Overall the DFC test performed the best–on average it had higher sensitivity and partial AUC and its elevation was most prominent in the low range of differentially expressed features, typical for formalin-fixed paraffin-embedded sample sets.
Conclusions:The distributional fold change test is an effective method for finding and ranking differentially expressed probesets on microarrays. The application of this test is advantageous to data sets using formalin-fixed paraffin-embedded samples or other systems where degradation effects diminish the applicability of correlation adjusted methods to the whole feature set.
Keywords:Differential expression, Microarray, Feature selection, Fold change, Statistical test, ROC curve, FFPE
Background
The development of technology over the past two dec-ades has established microarrays as a standard tool for genomic research and discovery [1,2]. Nowadays, scien-tists can simultaneously measure the expression of tens of thousands of genes from an experimental sample and identify those genes, which demonstrate a significant change in expression level under the impact of certain
experimental conditions. Numerous methods have been proposed to determine differentially expressed genes (DEGs), see, for example [2-9] and references cited therein. In the majority of cases, the utility of these methods was demonstrated by application to the analysis of expression levels of RNA extracted from fresh frozen (FF) tissue samples. However, clinical genomic research is often focused on retrospective studies, utilizing arch-ival samples stored in formalin-fixed and paraffin-embedded (FFPE) blocksa. By nature of the fixation method, FFPE samples are partially degraded and * Correspondence:[email protected]
Almac Diagnostics, 19 Seagoe Industrial Estate, Craigavon BT63 5QD, UK
contain low amounts of total RNA ([10] and references therein for more details) leading to increased expression variability [10,11]. This RNA degradation is dependent on a number of factors, including fixation protocol, stor-age time and storstor-age conditions with the resulting vari-ability introducing a number of challenges for gene expression studies [10,11]. Apart from high technical variance, FFPE samples typically exhibit low gene expres-sion intensities and a compresexpres-sion of fold change across experimental groups relative to matched FF samples (see, for example [11]), thereby compromising the ability to detect DEGs in samples preserved in this manner. Add-itionally, RNA transcripts from FFPE samples degrade at different rates and to different levels [11-13], which can introduce false negative and false positive correlations between the expression levels of genes. These differential degradation effects impede the direct application of cor-relation adjusted methods [14,15] to FFPE samples, and a pre-selection of the most stable (decaying at the same rate) genes should be considered [12]. Therefore, the development of a method dedicated to the analysis of RNA differential expression from FFPE samples is neces-sary to support the many studies attempting to make dis-coveries from the wealth of FFPE archival material available. The absence of such a method is especially sur-prising in the view of enormous improvement of the methods and protocols for the extraction of RNA from FFPE samples in recent years [16].
In order to shrink the large technical variance inherent in expression levels measured from FFPE tissue samples, one should have enough samples, Ns >> 1. Typically
microarrays have very large number of probesetsNp> 104
[17]. Therefore FFPE-derived gene expression experiments fall within the Np >> Ns >> 1 paradigm, with the
asso-ciated complications for subsequent analysis [18]. If we assume that asymptotically,Np→∞, we may then
intro-duce a dependence of distributions of variables such as fold change and total variance on the expression level and develop an approach where the significance of a gene’s differential expression estimation accounts for its expres-sion level.
Compression of the expression distribution in FFPE samples towards the lower side [10,11] necessitates a DEG selection method that work equally well with fea-tures at any expression level. Spanning the full expres-sion scale will enable the selection of features with low expressions (typically comprising the main distribution of features in FFPE samples) and with high expressions.
Summarizing the requirements for successful DEG se-lection method for FFPE sample sets, we can say that it should work with reasonable number of samplesNs>> 1,
pick up DEGs equally well at any expression level and be not bounded to specific pre-processing method. The same requirements are actually applicable to successive method
working with samples obtained by any preservation method, be it FF or FFPE or some other [19,20].
In the following paper, we will use term feature, instead of probeset, transcript, gene, or protein, to emphasize that the methodology presented has general applicability. This paper presents the description of a method, called the distributional fold change (DFC) test, which is based on the analysis of the distribution of intensities of all fea-tures on a microarray mapped to a three dimensional feature space composed of the average difference of gene expression (logarithm of fold change), total variance and average expression level. It introduces a score based on signal-to-noise ratio that can be used for accurate rank-ing of DEGs independently of the expression range they come from – high, medium or low, which is extremely important for DEGs from FFPE samples. It also allows the introduction of a statistical (and expression dependent) threshold for the fold change and in this way removes one of the drawbacks of standard methods of filtering based on fold change – the arbitrariness of a cut-off value.
We evaluate the performance of the new ranking method by comparison with the standard t-test (selected as a basic reference test) and with shrinkage CAT-test [7,14], which was shown [7] (see also [9]) to be a good representative of the set of methods [4-6] developed to stabilize gene expression variance. Account of variance in the data is very important for FFPE data sets and in the performance evaluation of DFC test we limited our comparison to only these tests. Extended comparison of AUC values obtained by DFC test with those from t-test based methods [4-7] and fold change based tests [9] is provided in Additional file 1. The MATLAB source code of the DFC test program is pro-vided in Additional file 2.
Data sets with established DEGs were selected for test-ing as these had been previously used for comparison of different methods for detecting differential expression [8,9]. We limited our comparison to such real life data sets in order to exclude any possibility of bias that could foster the advantage of DFC test.
Methods
Distributional fold change test: general approach
In a two class comparison setting, the purpose of the DFC test is to remove features based on the analysis of difference between the average expressions in Class 1 and Class 2 respectively:
d¼E X½ 1 E X½ 2 ð1Þ
HereX= log2(I), logarithm to base 2 of intensityI.
connection with the logarithm of fold change, which is usually defined as the ratio of mean intensities:
FC¼E I½ 1 E I½ 2
ð2Þ
The connection between FC and d is FC= 2d when expression variances in both classes are close (and/or when expectations in (2) are replaced by medians).
First, we assume that the log transformed intensities have independent normal distributions and therefore their means μ1 = E[X1] and μ2 = E[X2] and d, as
their difference, also have normal distributions. The variance of d can then be estimated as a sum of variances var(μ1) and var(μ2):
vsð Þ ¼d vð Þ þμ1 vð Þ ¼μ2 vsð ÞX1
N1
þvsð ÞX2 N2 ;
ð3Þ
whereNiis the number of samples in the corresponding
class. It is generally accepted that, for small sample sizes, traditional estimation of variance can be inaccurate and therefore needs a stabilizing correction. We apply a min-imal correction approach and use the following ansatz:
vsðXjμÞ ¼ 1 N
XN
i¼1
XiX
2
þv0ð Þμ
!
¼N1 N v Xð Þ þ
1
NvEEð Þμ: ð4Þ
Here vEE is an average variance of unregulated features having (nearly) the same expression (see eq. (9) below for definition ofvEE). Note that definition (4) extrapolates the variance from standard unbiased definition of variance when v Xð Þ ¼vEEð Þμ and is equivalent to the definition from likelihood maximization whenv Xð Þ>>vEEð Þμ . More complicated shrinkage approaches can be applied to im-prove test performance on data sets with very small sam-ple size < 10.
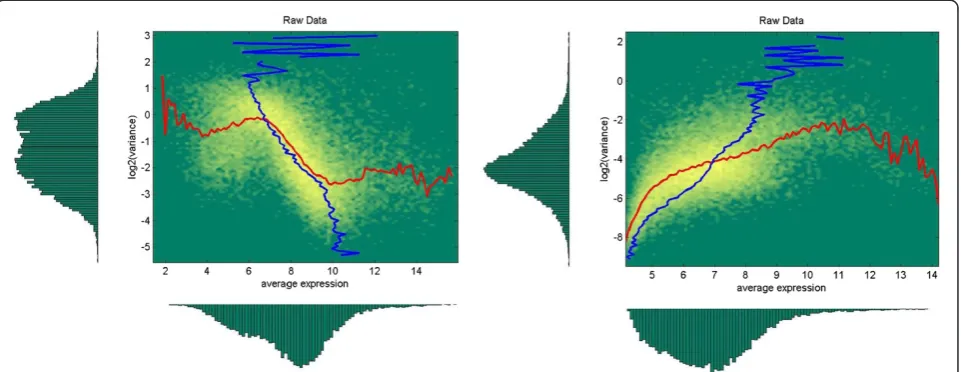
The analysis of microarray gene expression data has shown that distributions ofdand total and internal var-iances are expression dependent (Figure 1). We will use a simple approximation of these dependencies as de-pendence on the mean expressionμ= (μ1+μ2)/2 only.
Next, we suppose that all features on a microarray can be considered as a mixture of unregulated (equally expressed) and regulated (differentially expressed) fea-tures. We will also suppose, for simplicity, that the logFC distribution of unregulated features d0 at each
expression level,μ, can be described by normal distribu-tionN d0¼0;v0ð Þ ¼μ σ0ð Þμ 2
.
We are interested in finding features that are signifi-cantly different from unregulated features. Therefore we test the null hypothesis, that the centre of feature’s logFC distribution coincides with the centre of unregulated
features distribution: dð Þ ¼μ d0ð Þμ . Note that this test is different from the testing hypothesis of μ1 – μ2= 0 by
account of the null (unregulated) logFC distribution, which is supposed to be known and independent from the distribution of regulated features (variance of the null distribution is further defined in the next section, see eq. (12)). A test statistic for evaluating the signifi-cance level of each feature with respect to this hypothesis is defined as statistics of the DFC-score:
Zd¼ dffiffiffiffiffiffiffiffiffiffiffiffiffiffiffiffiffiffiffiffiffiffiffiffiffiffiffiffiffiffiffið Þ μ d0ð Þμ vsðdj Þ þμ v0ðμÞ
p : ð5Þ
This statistic is an intermediate between the normal Z-statistic andT-statistic because of the presence of the variance of null features logFC distribution, which is expected to be (almost) independent of the sample size. Note that this definition of significance level statistic is similar to those of moderated t-statistics, used in a series of papers on variance stabilization [7] (and references cited therein), but principally differs from them in that the additional term v0(μ) in variance is defined not
through the variance of mean internal variance, but mainly through the variance of null features logFC dis-tribution and only to a limited extent through the fea-tures’internal variance.
Even without knowing the exact statistic for the DFC-score, it can be used for ranking features and selection of a fixed number, or best fraction of features with high-est score.
Null (unregulated) features distribution and variance threshold
Previously we supposed that we knew the properties of the null features distribution. Here we consider how one can establish them.
As mentioned previously, the log fold change d and total variance vT depend on average expression μ. We
suppose that the number of features is large and enough to accurately define these dependences, which will be exact in the limitNp→∞.
Consider features in a slice (μ – Δμ/2, μ + Δμ/2) of three dimensional space of log fold change d, log total variance log2vTand average expression μ. With the
assumption of Np → ∞, this slice can be made
infini-tesimally thin. The two– dimensional probability distri-bution f(log2vT,d | μ) is used below to find the
expectation of log variance LV = log2vT, conditioned on
the value of log fold change. According to our assumption, the unconditional distribution function can be considered as a mixture of unregulated (EE: equally expressed) and regulated (DE:differentially expressed) features
Here π is prior probability of a feature to be differen-tially expressed and is supposed to be very small,π<<1. For unregulated features the probability distribution can be written as a product of two marginal distributions
fEE LV;dj Þ ¼μ fEEM LVj Þ μ fEEMðdj Þμ :
ð7Þ
Here and below fM
DE;EEðdjμÞ ¼
Z1
1
fDE;EEðLV0;djμÞdLV0
andfM
DE;EEðLVjμÞ ¼
Z1
1
fDE;EEðLV;ΔjμÞdΔ:. Using (7) and
notation
FDE;EEðLV;djμÞ ¼
ZLV
1
fDE;EEðLV0;djμÞdLV0;
we can rewrite eq. (6) in integral form
fEEMðdjμÞ ¼
F LVð ;djμÞ
1π
ð Þ
ZLV
1
fEEMðLV0jμÞdLV0
1þ π
1π
FDEðLV;djμÞ FEEðLV;d>jμÞ
1
: ð8Þ
The relationship (8) can be simplified if we find such LV and d values, at which FDE(LV,d|μ) < or ≈ FEE(LV, d|μ) and therefore with account of π <<1 one can
replace the expression in curly brackets by 1. In Additional file 1 it is shown that this can be done for some range of |d| aroundd= 0 and LV<LVTh(μ), with the threshold value defined as
LVTh¼ log2vEE¼E½LV dj ¼0;μ: ð9Þ
In this range the eq. (8) can be reduced to
fEEMðdjμÞ∝
Z
LVTh
0
f LVð ;djμÞdLV: ð10Þ
We will suppose that approximation (10) holds for all d values, that is for all d and all log2vT < LVTh(μ) the distribution functionf(LV,d|μ)≈fEE(LV,d|μ). The thresh-old (9) is an approximate way to separate a subset of unregulated (null) features:
d0ð Þμ
f g: log2vT <LVThð Þμ ; ð11Þ
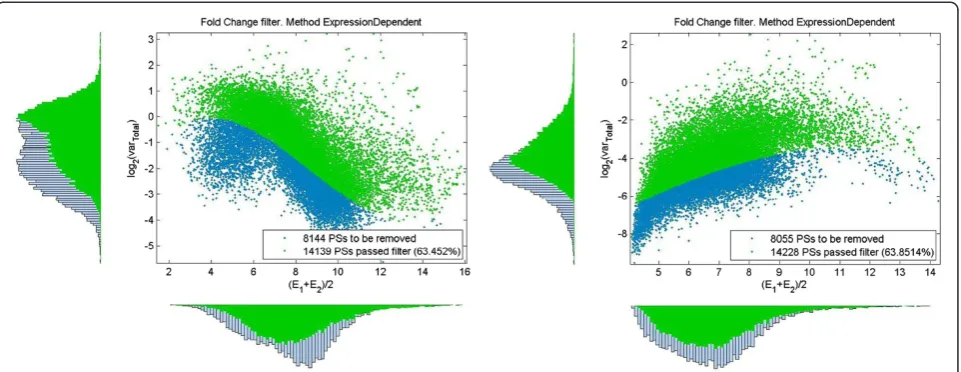
and can be used as a boundary to set up a variance filter. Its application to remove null features is shown in Figure 2. We supposed in previous section that fEEM(d|μ) ~N(0,σ0(μ)2). Basing on approximation (10)
and using the definition (11) the dependence σ0(μ) can
be estimatedbfrom fit
N 0;σ0ð Þμ 2
∝
Z
LVTh
0
fðLV;dj Þμ dLV: ð12Þ
Significance level and power for testing each individual feature
The standard deviation σ0(μ) reflects the expression
dependence of the unregulated features probability distribution and together with significance parameter α (for Type I error) can now be used to set expres-sion dependent threshold on the absolute value of the logFC
Δ1Thðα;μÞ ¼σ0ð Þμ Φ1ð1α=2Þ ð13Þ
Here Φ−1 is normal inverse cumulative distribution function. Below this threshold, all features are consid-ered as having insufficient evidence for differential ex-pression at the confidence levelα. As this is specified for the null distribution obtained from analysis of all features on a microarray with nearly the same expres-sion that is through sharing information across these features, the parameterα indicates the significance level of taking multiple testing into account. For α = 1 the threshold (13) turns to 0 and no information about multiple testing is included into finding differentially expressed features.
To define a power (probability of not committing Type II error) of detecting a DE feature, we calculate from eq.(3) standard deviation ofd
sð Þ ¼μ
ffiffiffiffiffiffiffiffiffiffiffiffiffiffiffiffiffiffiffiffiffiffiffiffiffiffiffiffiffiffiffiffiffiffiffiffiffiffiffi
vsðX1jμÞ N1
þvsðX2jμÞ N2
s
ð14Þ
and use Student’st(d(μ)/s(μ),DF) distribution with degrees of freedomDF,
DF¼ðvs1=N1þvs2=N2Þ 2
vs1=N1 ð Þ2
N11 þ vs2=N2 ð Þ2
N21
; ð15Þ
as an alternative distribution to impose statistical power requirements. Only features with power at least equal to 1− βTh above a level specified by the significanceα shall
pass the filter:
Δ2Th βTh;μ
¼sð Þμ T1 1βTh;DF
ð16:aÞ
dDð Þμ
f g: jlogFCj>Δ1Thðα;μÞ þΔ2Th βTh;μ
\ðlog2vT>LVThð Þμ Þ: ð16:bÞ
HereT–1is Student's t inverse cumulative distribution function. Note that in the definition of non-null features {dD(μ)}, the requirement for the variance to be above the threshold is also included in order to reflect that condi-tion (11) was used to define properties of null features distribution. The condition is not directly required and is optional in software implementationc.
Strictly speaking in (16.a) we should not assume thatd (μ)/s(μ) follows the Student’s t-distribution as stabilized variances (4) are used to calculates(μ) (14), but keeping in mind that Welch’s definition of degrees of freedom (15) is an approximate solution of Behrens-Fisher prob-lem [21] and that correction (4) is small except in rare cases of very small number of samples, we suppose that thet-distribution is a sufficient approximation.
The information obtained here can be used to cal-culate the power (of testing feature for being DE) con-ditional on significance levelα, for selected features. For |logFC| >Δ1Th(α,μ):
βðdj Þ ¼α 1T j j d Δ1Thðα;μÞ s dð Þ ;DF
: ð17Þ
HereTis Student'stcumulative distribution function. Note that conditions (16) can be transferred onto a requirement for fold change conditional power:
βðdjαÞ<βTh
\ðj jd >Δ1Thðα;μÞÞ \ðlog2vT >LVThÞ
ð18Þ
Thus the DFC filter incorporates three different statis-tical filters: the multiple testing based threshold through parameter α, the t-test conditioned on the values of α through parameter βand the variance filter. Compared with a traditional fold change filter where the threshold is arbitrarily selected, the DFC threshold is defined by the features significance level and conditional power and depends on the properties of a particular data set. This method has the advantage of being self-adjusting through the accurate estimation of the unregulated fea-tures distribution d0 and taking into account the d(μ)
distribution of regulated features thus providing an op-tion to impose power requirements. The two signifi-cance parameters,αandβ, allow for a controlled tuning of filtering threshold.
Whenα= 1, the method is reduced to the selection of features by a standard t-test with threshold pTh = 2βTh combined with variance filter; when βTh = 0.5 (and α < 1) the method is reduced to selection based on the
‘Unusual Ratio’ variant of fold change method (see, for example, [2]) with internal definition of the null feature distribution. There is no need in setting restrictive values for α and β, standard settings α = 0.05 and β = 0.2 should be sufficient as their intention is to remove un-regulated features. Once the (α, βTh) selection criteria are applied and unregulated features removed, ranking of differentially expressed features can be performed by DFC score (5) and used for selecting best subset of dif-ferentially expressed features.
Evaluation method
To evaluate the performance of the DFC algorithm, we use the receiver operating characteristic (ROC) curve [22]. This is a graphical plot of the parametric depend-ence of the fraction of true positives τ = true positive rate (TPR) on the fraction of false positives η = false positive rate (FPR) as the number of features predicted to be differentially expressed (Kor, equivalently,ν=K/Np), varies. For a given range of η or τ, one ROC curve is
better than another if it is lying to the northwest (τ is higher for fixedη, orηis lower for fixedτ) of the first.
We use the area under ROC curve (AUC):
AUC¼
Z1
0
τ ηð Þdη ð19Þ
as one of criteria for comparison, because it has an important statistical property: the AUC of a test is equivalent to the probability that the test will rank a ran-domly chosen positive instance higher than a ranran-domly chosen negative instance [23]. AUCs and ROC curves have been used in some previous works for comparison of different feature selection tests see, for examples [7-9], and are standard metrics used for the evalu-ation and comparison of diagnostic tests.
The number of features on a microarray Npis usually extremely large (Np> 104) and is much higher that the
number of true DEGs NT, (less than 100 for data sets listed in Table 1)Np>>NT. This is even more valid for data sets from FFPE samples (see also section Back-ground). Therefore, when dealing with FF and FFPE sample sets of much higher interest is accessing per-formance of an algorithm relative to the ideal one, for only a small fraction
1=Np<<v<<1 ð20Þ
of best features selected by a method (say up toν~ 0.05, which for the HG-U133A microarray would correspond to ~ 1000 features). Taking into account the relation
v¼η1NT=NpþτNT=Np;
one can also useηto estimateν(or vice versa), unlessη drops to values below ~0.001.
It is possible for a high-AUC test to perform worse than a low-AUC test in a specific region of ROC space. In our case, for evaluation of a method working well also with FFPE sample sets, the range (20) of smallνandηis of highest interest. Here, a more appropriate parameter is partial AUC [22], which is defined as an area under ROC curve when integration in (19) is carried out only up to η: pAUC(η) =R0ητ(η')dη'. For an ideal
re-ceiverτ(η) = 1, thereforepAUCideal(η) =ηand thepAUC
of a method, standardized on thepAUCof ideal receiver will be:
SPAð Þ ¼η η1
Zη
0 τ ηð Þ0
dη0 ð21Þ
its value shows how close the performance of a method is to the performance of an ideal method in the range of FPR [0, η]. SPA can be also considered as the average TPR over the same range [0,η]. We use both AUC and SPA to assess the performance of the DFC test.
In typical for FFPE data sets situations where Np >>
NT, ROC curves on a normal scale (η) are of little use
and are much more informative on logarithmic scale; hence we present our result on log10ηscale.
Results
Data sets
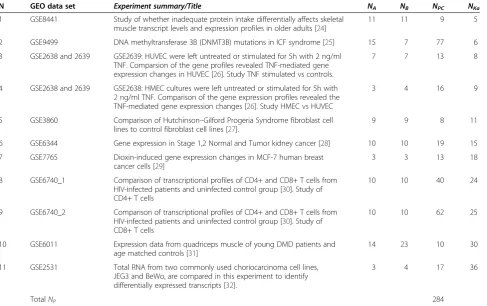
We evaluated the performance of the DFC test using 11 publicly available Homo sapiens microarray data sets, listed in Table 1, each of which have had a portion of discovered DEGs experimentally validated by a real-time polymerase chain reaction (RT-PCR). They are chosen from FF sample sets, listed and described in Ref. [9]. The selection of experimental data sets was based on the requirement that total number of DEGs confirmed by RT-PCR should be above ~10 (see Additional file 1 for details of subset selection). Having a large number (>>1)
of verified DEGsd is important for building representa-tive ROC curves and for the estimation of area and par-tial area under ROC curves.
It is known [8] that the majority of true DEGs verified by RT-PCR in experimental studies on FF samples tend to have high expression levels. This was also exploited in some feature selection methods [9]. The DFC method is designed to pick up DEGs independent of their expres-sion level and therefore should work in these as well as in FFPE data sets where the expression values tend to be comparatively lower.
Following [8,9] we consider that the evaluation of results based on real experimental data sets should take precedence over those based on artificial data sets. Therefore analysis of the test performance is based on real-world experimental data sets only.
There are several methods available for pre-processing data profiled on Affymetrix microarrays [1,34]. We used Affymetrix Expression Console with standard settings to apply two of the most frequently used pre-processing methods: MAS5 [35,36], which is designed to work on a single chip basis, and RMA [37,38], a multiarray-based approach. As can be seen from Figure 1, these two
Table 1 Data sets from GEO database
N GEO data set Experiment summary/Title NA NB NPC NKa
1 GSE8441 Study of whether inadequate protein intake differentially affects skeletal muscle transcript levels and expression profiles in older adults [24]
11 11 9 5
2 GSE9499 DNA methyltransferase 3B (DNMT3B) mutations in ICF syndrome [25] 15 7 77 6 3 GSE2638 and 2639 GSE2639: HUVEC were left untreated or stimulated for 5h with 2 ng/ml
TNF. Comparsion of the gene profiles revealed TNF-mediated gene expression changes in HUVEC [26]. Study TNF stimulated vs controls.
7 7 13 8
4 GSE2638 and 2639 GSE2638: HMEC cultures were left untreated or stimulated for 5h with 2 ng/ml TNF. Comparison of the gene expression profiles revealed the TNF-mediated gene expression changes [26]. Study HMEC vs HUVEC
3 4 16 9
5 GSE3860 Comparison of Hutchinson–Gilford Progeria Syndrome fibroblast cell lines to control fibroblast cell lines [27].
9 9 8 11
6 GSE6344 Gene expression in Stage 1,2 Normal and Tumor kidney cancer [28] 10 10 19 15 7 GSE7765 Dioxin-induced gene expression changes in MCF-7 human breast
cancer cells [29]
3 3 13 18
8 GSE6740_1 Comparison of transcriptional profiles of CD4+ and CD8+ T cells from HIV-infected patients and uninfected control group [30]. Study of CD4+ T cells
10 10 40 24
9 GSE6740_2 Comparison of transcriptional profiles of CD4+ and CD8+ T cells from HIV-infected patients and uninfected control group [30]. Study of CD8+ T cells
10 10 62 25
10 GSE6011 Expression data from quadriceps muscle of young DMD patients and age matched controls [31]
14 23 10 30
11 GSE2531 Total RNA from two commonly used choriocarcinoma cell lines, JEG3 and BeWo, are compared in this experiment to identify differentially expressed transcripts [32].
3 4 17 36
TotalNP 284
Data sets from GEO database [33], used for testing efficiency of DFC test. Samples in all data sets were profiled on Affymetrix GeneChip HG-U133A microarrays with 22283 probesets. Shortcuts:NA–number of samples in condition A,NB–number of samples in condition B,NPC–number of probesets checked by RT PCR.
methods provide very different distributions of features in expression – variance space and we considered it sufficient to concentrate only on these two methods.
Evaluation
Within the DFC algorithm, features are ranked on the basis of the Zdscore (5) and their relevance to differen-tial expression is assessed using two criteria (13,16): fold change should have an appropriate significance level <α and power > 1–βTh. The latter two are complemented
by requirement that variance should be above a specified threshold. To create continuous ROC curves we setα= 1 and βTh = 0.5 and ranked features using Zd p-values, calculated based on the assumption that Zd follows nor-mal distributione. Specific values of α and βTh define
starting point on the curve and their selection is equiva-lent to setting appropriate cut-off p-values. For t- and shrinkage t- test this is typically done by controlling the false discovery rate.
Our aim is to develop and check performance of a test for systems where technical variation is large (such as FFPE samples sets) and assessment of reliability of detecting differential expression is of extreme import-ance. Therefore we compared the performance of the DFC test with t-test based methods: the standard t-test and with the CAT-test [14] with the ‘diagonal’ optionf. This option is equivalent [14] to shrinkage t-test [7], which was shown [7,9] (see also Additional file 1) to per-form similarly to other variance stabilization derivatives of the t-test [4-6], and can be considered as their repre-sentative. The ordinary t-test is provided as a reference for the improvement of any t-test based method, which DFC test and CAT test clearly are. According to [7] the ordinary t statistic shows average though never optimal performance (regardless of the variance structure across features). Detailed comparison of AUCs for DFC test and a set of t-test based methods [4-7], as well as with fold change test and its ad hoc modification weighted average difference (WAD) [9] method is presented in the Additional file 1.
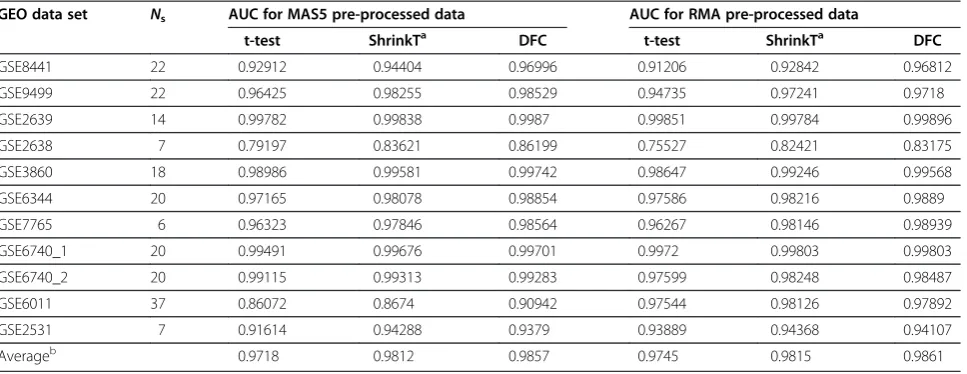
The AUC values for MAS5- and RMA-pre-processed data for the selected experimental data sets (described in Table 1), are shown in Table 2. One can see that, on average, the DFC test achieves higher AUCs than the t-test and shrinkage t-test.
For estimation of the significance of differences in AUC values we applied a paired-sample single-sided t-test. The observed AUC values are very close to 1 and conse-quently, their distributions and distributions of their dif-ferences cannot be very well approximated by normal distributions. To obtain a more comprehensive estimation of the significance of difference, we applied a paired-sample single sided Wilcoxon signed rank test to AUC values and paired-sample single sided t-test to logit
transformed AUC values, 0.5⋅ln(AUC/(1-AUC)). The logit transformation [39] maps the interval (0,1) onto (−∞, +∞) and makes transformed variables more normally distribu-ted and therefore t-test better applicable. The results shown in Table 3 indicate that all differences are signifi-cant (on a significance level better than 0.05).
One of the most important characteristics of the method is its ability to find DEGs independently of the pre-processing method applied to data. This should be evident from AUC as an overall characteristic of the test’s performance. Calculation of correlation coefficients between (logit transformed) AUCs for MAS5 and RMA pre-processed data (see Table A4 in the Additional file 1) showed that the DFC test has the highest correlation between AUCs (ρDFC = 0.92), although its prevalence is
not high enough to make it significantly different from other tests (ρt-test= 0.88 andρshrinkT= 0.87), with
differ-ences in the correlation coefficients having p-values above 0.3 (see also Additional file 1 for broader range of comparisons).
Figure 3 shows ROC and SPA curves for 3 out of 11 analysed data sets, selected to represent different pre-processing methods and different number of features proved by RT-PCR. The first data set was pre-processed with MAS5 and has the highest number of samples. The other two data sets were pre-processed with RMA and have a reasonable number of samples and features tested by RT-PCR. Curves for all data sets are provided in Add-itional file 1. One can see that independent of the pre-processing method, the DFC test performs in general slightly better than CAT(diag) and much better than t-test. This observation is confirmed when 〈ROC|ν〉 and
〈SPA|ν〉curves are compared. These curves are obtained by averaging parametric dependences over all 11 data sets (indicated by angular brackets) under a fixed frac-tion νof top ranked features selected. The dependences are shown in Figures 4 and 5 by thick lines and the plots are provided for both pre-processing methods, MAS5 and RMA. To reveal the extent of variance in the data for each method, Figure 4 also shows thin lines drawn at half of the standard error above and below the corre-sponding average curve.
The behaviour of the DFC test ROC and SPA curves displayed in Figures 4 and 5 agrees with what one would expect from a test performing better than the standard t-test on a reasonably sized (more than 10 samples) data set with ~ 100 differentially expressed features. When a high fraction of features,ν> 0.5, is taken as differentially expressed the difference between the DFC test and t-test is minimal, as both tests remove the most easily detect-able, non-expressed features. When a very small fraction of featuresν ~ 1/Np is taken as differentially expressed,
the differential expression of the few features should be very strong and can be effectively selected by t-test alone. One can expect an improvement of DFC over t-test when dealing with an intermediate range (20).
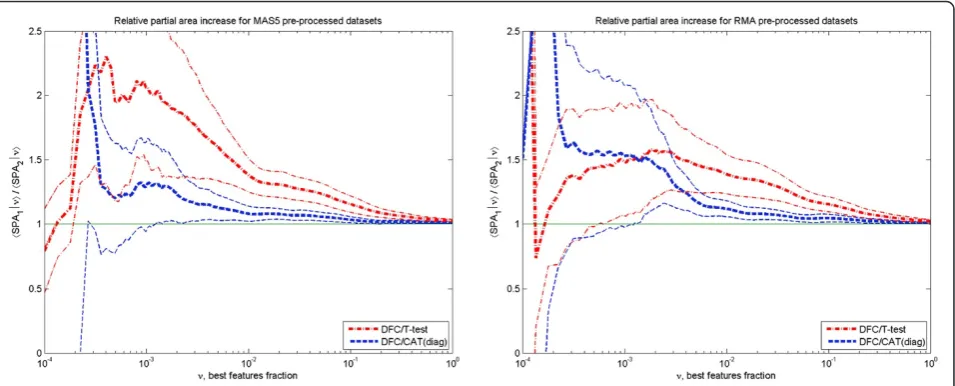
To quantify the DFC test improvement over t- and CAT- tests, we calculated the sensitivity ratios
〈τ(DFC)|ν〉 / 〈τ(other)|ν〉 and partial area ratios 〈SPA (DFC)|ν〉/〈SPA(other)|ν〉as a function ofν(top fraction of ranked features). These are shown in Figures 6 and 7, for both pre-processing methods. One can see that the improvement over the t-test is significant (at the z-test level of ≤ 0.1) in the most important range (20). This is true for both the average sensitivity and partial area increase. Taking into account confidence intervals, the DFC- test behaviour in MAS5 and RMA pre-processed data sets is equivalent. Sensitivity〈τ|ν〉increase over the t- test is around 50 ÷ 100% for 0.0003 <ν< 0.001, then it gradually decreases to ~ 0 % atν> 0.2 passing through ~ 30% when ν is ~ 0.01. Partial area increase can be described by nearly the same dependence with the exception that it decreases gradually to ~ 2% atν=1.
Improvement of the DFC- test over the CAT-test is in a narrower region. This can be clearly seen from Figure 7, where the improvement in the partial area under ROC curve is significant for ν > 0.0015 only.
It decreases from ~30 ÷ 50% to 10% when ν changes from 0.0015 to 0.01 and then gradually to ~ 1% atν=1.
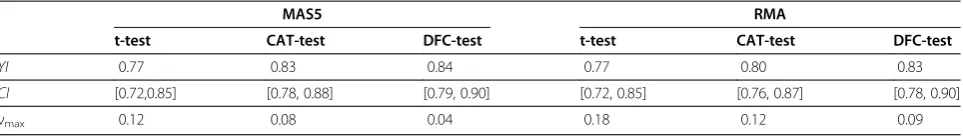
Using data represented in Figure 4, one can also cal-culate the Youden Index (YI), which is the maximum difference between the true positive and false positive rates,YI = max(τ(ν)−η(ν)) [22]. The YI ranges between 0 for random test and 1 for an ideal test. The thresh-old at the point νmax on the ROC curve
correspond-ing to the YI is often taken to be the optimal threshold (see, for example, [12,22]). Results for YI and νmax =
argmax(τ(ν)−η(ν)) are provided in Table 4 and show that the DFC test outperforms the shrinkage CAT-test and t-test. It has the highest YI and the lowest νmax.
All data sets were profiled on Affymetrix GeneChip HG-U133A microarrays with 22283 probesets. Therefore the optimal range for the number of features selected by the t-test is approximately (2.7 ÷ 4) × 104, by CAT-test approximately (1.8 ÷ 2.7) × 104 and by DFC- test ap-proximately (0.9 ÷ 2)×104features.
Discussion
We have proposed a new method for removing non-differentially expressed features and ranking differen-tially expressed features from gene expression data.
Table 3 Significance of differences in AUC
Test MAS5 RMA
DFC–t-test DFC–CAT DFC–t-test DFC–CAT
Wilcoxon on AUC 0.0005 0.0122 0.0005 0.0322
t-test on 0.5⋅ln(AUC/(1-AUC)) 3e-5 0.0017 3e-4 0.0103
Paired-sample single sided Wilcoxon test p-values calculated for AUC and paired-sample single sided t- test p-values calculated for logit transformed AUC, variable 0.5×ln(AUC/(1-AUC)).
Table 2 AUC performance of DFC test, t-test, and shrinkage t-test
GEO data set Ns AUC for MAS5 pre-processed data AUC for RMA pre-processed data
t-test ShrinkTa DFC t-test ShrinkTa DFC
GSE8441 22 0.92912 0.94404 0.96996 0.91206 0.92842 0.96812
GSE9499 22 0.96425 0.98255 0.98529 0.94735 0.97241 0.9718
GSE2639 14 0.99782 0.99838 0.9987 0.99851 0.99784 0.99896
GSE2638 7 0.79197 0.83621 0.86199 0.75527 0.82421 0.83175
GSE3860 18 0.98986 0.99581 0.99742 0.98647 0.99246 0.99568
GSE6344 20 0.97165 0.98078 0.98854 0.97586 0.98216 0.9889
GSE7765 6 0.96323 0.97846 0.98564 0.96267 0.98146 0.98939
GSE6740_1 20 0.99491 0.99676 0.99701 0.9972 0.99803 0.99803
GSE6740_2 20 0.99115 0.99313 0.99283 0.97599 0.98248 0.98487
GSE6011 37 0.86072 0.8674 0.90942 0.97544 0.98126 0.97892
GSE2531 7 0.91614 0.94288 0.9379 0.93889 0.94368 0.94107
Averageb 0.9718 0.9812 0.9857 0.9745 0.9815 0.9861
AUC performance of DFC test, t-test, and shrinkage t-test on MAS5 and RMA pre-processed data from data sets described in Table1.Nsis the number of samples
in the set.a
ShrinkT -test values were calculated with CAT-test [14], option‘diagonal’.b
It was designed to work with expression data from microarrays containing large number of features ( Np >
104), allowing one to analyse the distribution of all fea-tures on a microarray mapped to a three dimensional space composed of average difference of feature expres-sion (logarithm of fold change), total variance and average expression level. A simple approach was intro-duced to define the expression dependent null features distribution and to estimate null features expression dependent average variance (9) and variance of logFC (12). These dependences are incorporated into the DFC test score Zd (5) for individual feature, which in this way explicitly takes into account information about pres-ence of other features and can be used for accurate fea-ture ranking.
The definition of the scoreZd(5) is similar to moder-ated t-statistics, used in a series of papers on variance stabilization ([1,7] and references sited therein), but prin-cipally differs from them in that the variance stabilization is defined through the variance of null features logFC distribution (12) and to a limited extent through the fea-tures’internal variance.
The same dependences (9) and (12) were used to introduce a statistical (and expression dependent) threshold for the fold change based on specification of power 1 – β at given significance level α. This method has the advantage of being self-adjusting through the accurate estimation of the unregulated features distribu-tionf(d0) and taking into account thef(d|μ) distributions
of regulated features, thus providing an option to impose power requirements. The two parameters,αand β, con-trol Type I and Type II errors and allow for a tuning, to particular purposes of experiment, of a threshold (16) below which features are considered as having no sufficient evidence to be called differentially expressed. One can show that features passing DFC test all have (ordinary t-test) p-values below expression dependent thresholdp≤ pTh(we use notation pThto distinguish it
from α), which includes correction dependent on prop-erties of unregulated features distribution
pThðα;βjμÞ ¼2 1T σ0ð Þμ sð Þμ Φ
1 1α 2
þT1
ð
1βTh;DF;DFð22Þ
Whenα= 1, the method is reduced to selection of fea-tures by t-test with thresholdpTh= 2βTh(combined with variance filter), whenβTh= 0.5 the method is reduced to selection based on the ‘Unusual Ratio’ variant of fold change method [2] with an internal definition of null features distribution. Once the selection criteria (α, βTh) are applied and the set of unexpressed features removed, ranking of differentially expressed features can be per-formed by the DFC score (5).
Standard approaches for multiple test correction [1,2,18] (and references therein) do not take into ac-count expression dependence of the threshold (22). This problem will be considered in a separate publication. Here we note only that multiplicity correction affects only the arbitrary threshold choice and does not change the ranking of features [1]. Ranking of features with score (5) should be complemented with functional ana-lysis (see, e.g. [1, chapter 5]) for final reduction of the number of false positives based on biological grounds.
The definition of the Type II error (17) has some simi-larity with re-centered t- statistic [40], but differs from the TREAT method in the way how threshold is defined. In ref. [40]“a pre-specified threshold (τ) for the log-fold-change below which differential expression is not of material interest” [34] is introduced in order to address the thresholded null hypethesis H0: |d| ≤ τ
against alternativeH1: |d| >τ. The relevance of
particu-lar choice (τ=log2(1.1), or τ=log2(1.5) or τ=log2(2) were
used in [40] for three data sets) to particular dataset ac-tually has to be independently verified, while in our ap-proach the threshold (13) is 1) expression dependent and 2) is defined through the significance parameter α and it fully reflects properties of particular experiment. Ranking of features in [40] is performed using TREAT test p-value, which is equivalent to 2β(17) but with re-placement ofΔ1Th(α,μ) by an arbitrary thresholdτ. Par-ameter β(conditional on the value of α(or τaccording to definition in [40])) is good for defining the threshold (16) above which features differential expression can be considered as reliably detected, but we believe is not well suited for ranking of features (see also [41] for a discus-sion of fold change and p-value cutoffs). The best param-eter for this purpose is signal-to-noise ratio Zd (5) and
as it is shown in the paper and Additional file 1 it out-performs ranking by moderated t- test statistics and fold change based methods.
Table 4 Youden IndexYI,CI–80% confidence interval forYIandνmaxfor DFC-, CAT- and t-test
MAS5 RMA
t-test CAT-test DFC-test t-test CAT-test DFC-test
YI 0.77 0.83 0.84 0.77 0.80 0.83
CI [0.72,0.85] [0.78, 0.88] [0.79, 0.90] [0.72, 0.85] [0.76, 0.87] [0.78, 0.90]
The performance of the DFC test was verified using 11 real experimental data sets, with DEGs independently verified by RT-PCR. Their selection was based on the requirement of having in each set sufficiently large number of verified DEGs to build AUC. The total num-ber of verified DEGs in these data sets was 284. We demonstrated that the DFC test is significantly better than the t-test in terms of the total and partial area under receiver operating curves. The improvement was dramatic (on average > 30%) in the most important (for FF and FFPE sample sets) range of the number of selected featuresK< 1000.
Some improvement was obtained in comparison with shrinkage t-test [7,14], which can be considered as one of the best variance stabilizing methods, although improvement in partial area under ROC curve was within confidence limits (for 0.1 confidence level) for a number of selected features below ~30. Variance stabilization is very important for small data sets, although, as comparison shows, even for medium range data sets of 10 ÷ 30 samples, improvement can be significant. Taking into account that the DFC test was not optimized for variance stabilization (FFPE sample sets are seldom small), its performance can potentially
Figure 4Average ROC curves.Average ROC curves for two different pre-processing methods: MAS5–left panel and RMA–right panel. Data from 11 data sets having 284 true DEGs. Thick lines are〈τ|ν〉and thin lines represent〈τ|ν〉±se(〈τ|ν〉)/2 (half of the standard error below and above corresponding line with the same colour.
benefit from the inclusion of expression dependent stabilization of variance.
Analysis of correlation coefficients between AUCs for MAS5 and RMA pre-processed data showed that DFC method works equally well with both methods. Correl-ation is very high (ρDFC = 0.92) and is higher (though
not significantly) than for the other tests considered. This demonstrates that the DFC method does accurately take into account expression dependence of fold change and total variance, which are very much different in MAS5 and RMA pre-processed data, see, for example, Figure 1 for variance dependences.
We already mentioned above that our comparison was limited by only tests that take into account feature’s vari-ance (which is very important for FFPE datasets as they have high technical variance [10,11]). The fold change test has no associated value that can indicate the level of confidence in the designation of feature as DE. Its performance depends on features variances which can be very different for different pre-processing methods applied to data [42], see for example Figure 1 for com-parison of MAS5 and RMA pre-processed data. Fold change test was shown [7] to be good only if features variances are all fairly similar [7]. Basing on this
Figure 6DFC test sensitivity increase.DFC test sensitivity〈τ|ν〉increase over t- and CAT(diag)- test as a function ofνfor two different pre-processing methods: MAS5–left panel and RMA–right panel. Thick lines show the ratios and corresponding thin lines show ±1.28σdeviations from the ratio. Data from 11 data sets having 284 true DEGs.
observation and taking into account that features var-iances are fairly similar for RMA pre-processed data in the high expression range (e.g., 9–12 on Figure 1) and decrease with expression for MAS5 pre-processed data (e.g., for expressions in the range 6 – 12 on Figure 1) one can expect that fold change test should perform well on RMA pre-processed data when a small number of features is looked after and fail on MAS5 pre-processed data. On the contrary, the WAD method [9] should per-form well on the data with variances inversely propor-tional to the expression. Therefore it should work well for MAS5 processed data, and fail on RMA pre-processed data. This corroborates with findings in [9] (see also Additional file 1). Nevertheless, when the set sizes and number of independently verified features are restricted to be reasonable, Ns and NPC > 10, the DFC
test and moderated t- tests [4-7] perform better than either of them (see Additional file 1).
The independence of fold change test on features variances triggered researchers to look for combined approaches – to require that DE features satisfy both p-value and fold change criteria simultaneously [40]. Here the question arises as to how to combine these two tests – it was shown recently [41] that the cutoffs can significantly alter microarray interpretations. DFC test is free from these shortcomings as the ranking of fea-tures is performed using the signal-to-noise ratio (5) and the threshold (16) is defined by expression dependent properties of particular experiment and only removes unreliable features. No artificial fold change thresholds are introduced.
Summarizing discussion we can say that DFC method was developed and shown to work with reasonable num-ber of samples Ns >> 1, pick up DEGs equally well at
any expression level and is not bounded to specific pre-processing method.
Conclusions
We have proposed a new method, called distributional fold change test for removing non-differentially expressed genes, and ranking differentially expressed genes from gene expression data. The method was designed to work with data sets of FFPE samples profiled on microarrays, containing large number of genes (> 104) and to accur-ately select and rank differentially expressed genes, taking into account their expression level.
The method is based on analysis of the distribution of all genes on a microarray mapped to a three dimensional feature space composed of average difference of gene expression (logarithm of fold change), total variance and average expression level. It allows for the imposition of a statistical (and expression dependent) threshold for the fold change and the introduction a score based on signal-to-noise ratio which is used for accurate gene ranking.
Performance of the DFC test was verified using 11 real experimental data sets, with DEGs independently veri-fied by RT-PCR. We demonstrated that DFC test is sig-nificantly better than the t-test in terms of detecting DEGS as measured by the total and partial area under receiver operating curves. Its advantage is most promin-ent in the range of low fraction of DEGs, which is the most important range for the analysis of fresh frozen and especially FFPE sample sets. Given its excellent per-formance we believe that the DFC test should be rou-tinely used for the analysis of microarray data.
Endnotes a
Such studies benefit from the availability of complete (or near complete) clinical information on patient his-tory, treatments and prognosis/survival.
b
Details of fitting procedure to get the dependence σ0(μ) is provided in the Additional file 1.
c
The condition log2vT > LVTh(μ) is a convenient way
if imposing expression dependent variance filter with threshold defined by properties of the null features dis-tribution (see eq. 11). Its application is favourable in situations of imposing stringent selection criteria. When imposing mild selection criteria or looking for ranking of all features it shall be switched off (see also endnote e).
d
These DEGs may comprise only a portion of true DEGs–not all DEGs can be physically checked by RT-PCR due to limitations of the method–but nevertheless allow a comparative analysis of the DFC test’s perform-ance compared to the reference tests.
e
For two data sets, GSE6740_2 (MAS5 pre-processing) and GSE9499 (RMA pre-processing), we had to lift the variance filter in order to calculate the AUC.
f
This option was chosen because, for extremely high-dimensional data, estimating correlation is very difficult and in such instances it is recommended to conduct diagonal analysis [15].
Additional files
Additional file 1:DFC_Test._Farztdinov.PDF file containing Appendix to the article with details on the estimation of properties of null features distribution, detailed description of sample sets selection for testing, comparison of DFC test with wide range of tests, and ROC and SPA curves for all tested data sets.
Additional file 2:DFC_Test.m.The plain text file containing the source code of FDC test program for MATLAB 2009b with Statistics toolbox (or later MATLAB versions).
Abbreviations
AUC: Area under ROC curve; CAT: Correlation adjusted t (test); CAT(diag): CAT
operating characteristic; RT-PCR: Real-time polymerase chain reaction; ShrinkT: Shrinkage t-test, same as CAT(diag); SPA: Standardized partial area under ROC curve; TPR: True positive rate; WAD: Weighted average difference; YI: Youden Index.
Competing interests
The authors declare that they have no competing interests.
Authors’contributions
VF conceived of the study, developed, implemented and tested the method and drafted the manuscript. FMD made critical suggestions and contributed to the finalisation of the manuscript draft. Both authors read and approved the final manuscript.
Acknowledgements
This research was conducted as a part of the Almac Diagnostics company program for developing methods specifically applicable for expression analysis of RNA extracted from FFPE samples. It was supported by the Invest Northern Ireland grant 1009/101038722 and partly by the European Sustainable Competitiveness Programme 2007–2013 under the European Regional Development Fund. The authors gratefully acknowledge Vitali Proutski for continuous support during this work and Miika Ahdesmäki for providing the Matlab version of shrinkage CAT score package. Discussions with colleagues Steve Deharo, Gera Jellema, Eamonn O’Brien, Vitali Proutski, and others are highly appreciated. The authors are thankful to Miika Ahdesmäki and Timothy Davison for their suggestions for improvement of the manuscript content. Timothy Davison also made contribution to improving the language of the manuscript.
Received: 18 June 2012 Accepted: 22 October 2012 Published: 2 November 2012
References
1. Göhlmann H, Talloen W:Gene Expression Studies Using Affymetrix Microarrays. Boca Raton: CRC Press; 2009.
2. Zhang A:Advanced analysis of gene expression data. Singapore: World Scientific; 2006.
3. Kim SY, Lee JW, Sohn IS:Comparison of various statistical methods for identifying differential gene expression in replicated microarray data.
Stat Methods Med Research2006,15:3–20.
4. Smyth GK:Linear models and empirical bayes methods for assessing differential expression in microarray experiments.Stat Appl Genet Mol Biol 2004,3(1):Article 3.
5. Tusher VG, Tibshirani R, Chu G:Significance analysis of microarrays applied to the ionizing radiation response.Proc Natl Acad Sci USA2001,
98(9):5116–5121.
6. Sartor MA, Tomlinson CR, Wesselkamper SC, Sivaganesan S, Leikauf GD, Medvedovic M:Intensity-based hierarchical Bayes method improves testing for differentially expressed genes in microarray experiments.
BMC Bioinformatics2006,7:538.
7. Opgen-Rhein R, Strimmer K:Accurate ranking of differentially expressed genes by a distribution- free shrinkage approach.Statist Appl Genet Mol Biol2007,6:9.
8. Hu J, Xu J:Density based pruning for identification of differentially expressed genes from microarray data.BMC Genomics2010,
11(Suppl 2):S3.
9. Kadota K, Nakai Y, Shimizu K:A weighted average difference method for detecting differentially expressed genes from microarray data.Algorithm Mol Biol2008,3:8.
10. Farragher SM, Tanney A, Kennedy RD, Harkin PD:RNA expression analysis from formalin fixed paraffin embedded tissues.Histochem Cell Biol2008,
130:435–445.
11. Abdueva D, Wing M, Schaub B, Triche T, Davicioni E:Quantitative expression profiling in formalin-fixed paraffin-embedded samples by affymetrix microarrays.J Mol Diagn2010,12:409–17.
12. Kennedy RD, Bylesjo M, Kerr P, Davison T, Black JM, Kay EW, Holt RJ, Proutski V, Ahdesmaki M, Farztdinov V, Goffard N, Hey P, McDyer F, Mulligan K, Mussen J, O'Brien E, Oliver G, Walker SM, Mulligan JM, Wilson C, Winter A, O'Donoghue D, Mulcahy H, O'Sullivan J, Sheahan K, Hyland J, Dhir R, Bathe OF, Winqvist O, Manne U,et al:Development and independent validation of a prognostic assay for stage II colon cancer
using formalin-fixed paraffin-embedded tissue.J Clin Oncol2011,
29:4620–4626.
13. Mittempergher L, de Ronde JJ, Nieuwland M, Kerkhoven RM, Simon I,et al:
Gene expression profiles from formalin fixed paraffin embedded breast cancer tissue are largely comparable to fresh frozen matched tissue.
PLoS One2011,6(2):e17163.
14. Zuber V, Strimmer K:Gene ranking and biomarker discovery under correlation.Bioinformatics2009,25:2700–2707.
15. Ahdesmäki M, Strimmer K:Feature selection in omics prediction problems using cat scores and false non-discovery rate control.Ann Appl Stat2010,
4:503–519.
16. Klopfleisch R, Weiss AT, Gruber AD:Excavation of a buried treasure–DNA, mRNA, miRNA and protein analysis in formalin fixed, paraffin embedded tissues.Histol Histopathol2011,26(6):797–810.
17. Affymetrix, Inc:Technical Note: Design and Performance of the Gene-Chip Human Genome U133 Plus 2.0 and Human Genome U133A Plus 2.0 Arrays, 2003. Affymetrix, Inc. Technical Note: GeneChipWExpression Platform: Comparison, Evolution, and Performance, 2004. http://media.affymetrix.com/ support/technical/technotes/expression_comparison_technote.pdf. 18. Hastie T, Tibshirani R, Friedman J:The Elements of Statistical Learning; Data
Mining, Inference and Prediction. 2nd edition. New York: Springer; 2009. 19. Braun M, Menon R, Nikolov P, Kirsten R, Petersen K, Schilling D, Schott C,
Gündisch S, Fend F, Becker KF, Perner S:The HOPE fixation technique–a promising alternative to common prostate cancer biobanking approaches.BMC Cancer2011,11:511.
20. Klopfleisch R, von Deetzen M, Weiss AT, Weigner J, Weigner F, Plendl J, Gruber AD:Weigners fixative--an alternative to formalin fixation for histology with improved preservation of nucleic acids.Vet Pathol2012, Apr 26. [Epub ahead of print].
21. Sawilowsky SS:Fermat, Schubert, Einstein, and Behrens–Fisher: the probable difference between two means whenσ1≠σ2.Journal Mod App
Stat Meth2002,1:461–472.
22. Krzanowski WJ, Hand DJ:ROC curves for continuous data. Boca Raton: CRC Press; 2009 [Monographs on statistics and applied probability, vol 111]. 23. Fawcett T:An introduction to ROC analysis.Pattern Recogn Lett2006,
27:861–874.
24. Thalacker-Mercer AE, Fleet JC, Craig BA, Carnell NS,et al:Inadequate protein intake affects skeletal muscle transcript profiles in older humans.
Am J Clin Nutr2007,85:1344–52.
25. Jin B, Tao Q, Peng J, Soo HM,et al:DNA methyltransferase 3B (DNMT3B) mutations in ICF syndrome lead to altered epigenetic modifications and aberrant expression of genes regulating development, neurogenesis and immune function.Hum Mol Genet2008,17:690–709.
26. Viemann D, Goebeler M, Schmid S, Nordhues U,et al:TNF induces distinct gene expression programs in microvascular and macrovascular human endothelial cells.J Leukoc Biol2006,80:174–85.
27. Csoka AB, English SB, Simkevich CP, Ginzinger DG,et al:Genome-scale expression profiling of Hutchinson-Gilford progeria syndrome reveals widespread transcriptional misregulation leading to mesodermal/ mesenchymal defects and accelerated atherosclerosis.Aging Cell2004,
3:235–43.
28. Gumz ML, Zou H, Kreinest PA, Childs AC,et al:Secreted frizzled-related protein 1 loss contributes to tumor phenotype of clear cell renal cell carcinoma.Clin Cancer Res2007,13:4740–9.
29. Hsu EL, Yoon D, Choi HH, Wang F,et al:A proposed mechanism for the protective effect of dioxin against breast cancer.Toxicol Sci2007,
98:436–44.
30. Hyrcza MD, Kovacs C, Loutfy M, Halpenny R,et al:Distinct transcriptional profiles in ex vivo CD4+ and CD8+ T cells are established early in human immunodeficiency virus type 1 infection and are characterized by a chronic interferon response as well as extensive transcriptional changes in CD8+ T cells.J Virol2007,81:3477–86.
31. Pescatori M, Broccolini A, Minetti C, Bertini E,et al:Gene expression profiling in the early phases of DMD: a constant molecular signature characterizes DMD muscle from early postnatal life throughout disease progression.FASEB J2007,21:1210–26.
32. Burleigh DW, Kendziorski CM, Choi YJ, Grindle KM,et al:Microarray analysis of BeWo and JEG3 trophoblast cell lines: identification of differentially expressed transcripts.Placenta2007,28:383–9.
of expression profiles--database and tools update.Nucleic Acids Res2007,
35(Database issue):D760–D765.
34. Bolstad B:Preprocessing and Normalization for Affymetrix GeneChip Expression Microarrays. InMethods in microarray normalization. Edited by Stafford P. Boca Raton: CRC Press; 2008:41–60.
35. Hubbell E, Liu WM, Mei R:Robust estimators for expression analysis.
Bioinformatics2002,18:1585–1592.
36. Affymetrix, Inc:White paper: Statistical Algorithms Description Document. 2002. http://www.affymetrix.com/support/technical/whitepapers/sadd whitepaper.pdf.
37. Irizarry RA, Bolstad BM, Collin F, Cope LM, Hobbs B, Speed TP:Summaries of Affymetrix GeneChip probe level data.Nucleic Acids Res2003,
31(4):e15.
38. Irizarry RA, Hobbs B, Collin F, Beazer-Barclay YD, Antonellis KJ, Scherf U, Speed TP:Exploration, normalization, and summaries of high density oligonucleotide array probe level data.Biostatistics2003,
4:249–264.
39. Cramer JS:Logit Models from Economics and Other Fields. Cambridge: Cambridge University Press; 2003.
40. McCarthy DJ, Smyth GK:Testing significance relative to a fold-change threshold is a TREAT.Bioinformatics2009,25(6):765–71.
41. Dalman MR, Deeter A, Nimishakavi G, Duan ZH:Fold change and p-value cutoffs significantly alter microarray interpretations.BMC Bioinformatics 2012,13(Suppl. 2):S11.
42. Cui X, Churchill GA:Statistical tests for differential expression in cDNA microarray experiments.Genome Biol2003,4:210.
doi:10.1186/1748-7188-7-29
Cite this article as:Farztdinov and McDyer:Distributional fold change test–a statistical approach for detecting differential expression in microarray experiments.Algorithms for Molecular Biology20127:29.
Submit your next manuscript to BioMed Central and take full advantage of:
• Convenient online submission
• Thorough peer review
• No space constraints or color figure charges
• Immediate publication on acceptance
• Inclusion in PubMed, CAS, Scopus and Google Scholar
• Research which is freely available for redistribution