This is a repository copy of Computer implementation of the Quantifiable City Decision Support System (QCDSS)..
White Rose Research Online URL for this paper: http://eprints.whiterose.ac.uk/2092/
Monograph:
Kupiszewska, D. (1997) Computer implementation of the Quantifiable City Decision Support System (QCDSS). Working Paper. Institute of Transport Studies, University of Leeds , Leeds, UK.
Working Paper 519
[email protected] https://eprints.whiterose.ac.uk/ Reuse
See Attached
Takedown
If you consider content in White Rose Research Online to be in breach of UK law, please notify us by
White Rose Research Online
http://eprints.whiterose.ac.uk/Institute of Transport Studies
University of Leeds
This is an ITS Working Paper produced and published by the University of Leeds. ITS Working Papers are intended to provide information and encourage discussion on a topic in advance of formal publication. They represent only the views of the authors, and do not necessarily reflect the views or approval of the sponsors.
White Rose Repository URL for this paper:
http://eprints.whiterose.ac.uk/2092
Published paper
Dorota Kupiszewska (1997) Computer implementation of the Quantifiable City
Decision Support System (QCDSS). Institute of Transport Studies, University of Leeds, Working Paper 519
Working
Paper
519
November
1997
Computer implementation of the
Quantifiable City
Decision Support System (QCDSS)
Dorota Kupiszewska
UNIVERSITY OF LEEDS
Institute for Transport Studies
ITS
Working Paper
519
November 1997
Computer implementation of theQuantifiable City
Decision Support System (QCDSS)
This report is the first one in the series of four reports prepared by the author within the
SustainableIQuantifiable City project conducted in 1994-1996 at the Environment Centre.
The author wishes to thank the grantholders: Prof. David Kay (Environment Centre), Prof.
Tony May (Institute for Transport Studies) and Prof. Mike Pilling (School of Chemistry),
as well as Dr Gordon Mitchell (co-researcher, Environment Centre) and Prof. Adrian
McDonald (School of Geography) for their support.
A colour version of this report is available on request from the publications secretary at the
Institute for Transport Studies, Leeds University.
Other reports in the series are:
Working Paper 520
"Modelling for sustainable cities: Conceptual approach and an audit of existing sectoral
models for transport, air pollution, land use, and population modelling".
Working Paper 521
"Modelling for sustainable cities: the transportation sector", and
Working Paper 522
"MUPPETS: A computer tool for modelling and mapping emissions from urban transport
and stationary sources".
A colour version of this report is also available on request from the publications secretary
Contents
A. Introduction
...
1...
B. Computer ftmework for the QCDSS 3 B.l Database design...
5...
B.l.l Common file structure 5...
B.1.2 Format of spatially referenced data 6...
B.1.3 Basic zoning systems 7 B. 1.4 Road network link-based data...
.13B.2 Graphical User Interface
...
14B.2.1 Characteristics of Visual Basic
...
14B.2.2 Components of the QCDSS GUI
...
18B.2.3 Technical details of the QCDSS GUI
...
32...
B.3 Sectoral models and the GIs 33
...
C. Description of the exemplar model 35
A.
Introduction
Design and development of a computer model that would allow to monitor urban
sustainability trends, to identify major urban processes contributing to unsustainability, and
to predict the impacts of policies on city sustainability involves two major tasks: (i)
Specification of the scientific contents of the model; (ii) Design and development of the
computing framework that will enable an effective implementation of functionality
specified under (i). This report addresses mainly the second task. Part B describes the
general structure of the computer system (called the Quantifiable City Decision Support
System, QCDSS in short). Part C introduces an exemplar model that has been used to
demonstrate the process of the transition from a conceptual to an operational computer
model. A detailed description of the computer implementation of the exemplar model,
which focuses on urban air pollution, including sources and impacts, is presented in
In order to spec* the computing requirements of the modelling system and the
characteristics of the computer architecture, one
has
to fust define, at least in general terms,the required functionality of the model. Here, a conceptual model of city sustainability
covers a wide range of urban activities and processes: changes in land use patterns;
economic development; demographic changes; transport demand and supply, consumption
of energy and other resources; water supply, demand and quality; atmospheric pollution;
land contamination; waste generation and processing; and impacts of
all
the above on thequality of life. A set of indicators is needed to measure urban sustainabiity, wii' several
indicators usually required to assess trends and policies in each particular sector. One
combined index of city performance would not be usem for city planners and researchers
who have to address specific problems in sectors they represent.
What distinguishes an integrated sustainab'ity model from standard sector or process
models is the emphasis on the interactions between various processes and on the impacts of
activities and policies in one sector on sustainability trends in the others.
Given the above specified set of processes to model it is clear that a strong integration of
all processes within a single, necessarily huge, model is not feasible. First, it would require
too many simpHj4ng assumption Second, it would require a large team of experts
dedicated for a long time to the project.
Instead, we have proposed to develop a Quantifiible City Decision Support System
(QCDSS) in a modular form, described in detail in the next section. The core part of the
QCDSS is a system of loosely inter-connected sectoral models communicating with each
other through their input and output data. Some of
the
models to be used in the QCDSShave been used extensively by researchers and planners in the past. Integrating these models
in a single framework will bring new information about interactions between various sectors
and about the overall impact on city sustainability. Future research will concentrate on
filling modelling gaps or on
the
improvement of existing models, especially in the priorityB. Computer framework for the QCDSS
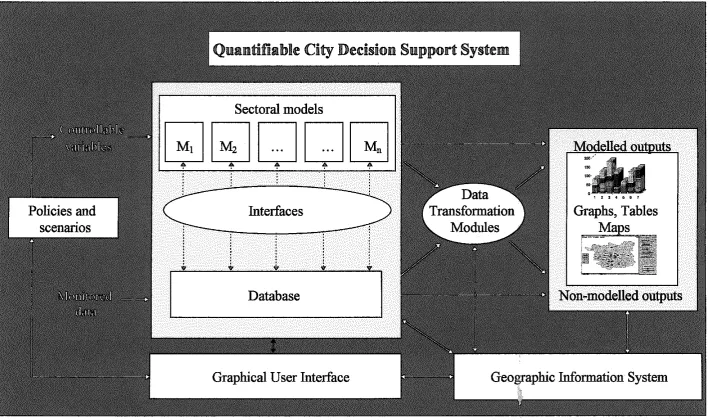
Quantifiable City Decision Support System is a multi-platform, multi-model computer
system for analysing sustainability trends, and for testing scenarios and policies. The
structure of the QCDSS is presented at Figure 1, The main elements of the system are:
Database;
Sector models;
Geographic Information System;
Graphical User Interface.
Sector models interact with each other through the Database, where all data is kept in a
common format (see Section B.l). By changing values of controllable variables in sector
models one can test consequences of various policies and scenarios. It is anticipated that
many models will be acquired in a compiled form, with the input and output file formats
pre-defined by model authors and differing from the Database format. Therefore, interfaces
are needed to allow for a transfer of data between the Database and models. In the QCDSS
for Leeds the interfaces have been written in C++, but diierent programming languages
might be used in other implementations.
In addition to model inputs and outputs, the database contains information on non-modelled
indicators, e.g. socio-economic data or environmental indicators obtained from monitoring.
While models are mainly important for forecasting purposes, the monitored data are used to
analyse the obsewed sustainability trends. Monitored data and outputs fkom the models are
displayed in the form of graphs, tables or maps. Sector models produce two types of
outputs: (i) intermediate results to be used as an input to other sector models;
(ii)
r e f m eorland sustainability indicators. Data transformation modules might be programmed to
calculate sustainability indicators fkom reference indicators and additional data h m the
database, e.g. census data or data on carrying capacities.
The GIs system is used both for mapping purposes and as a modelling tool. In particular, it
administrative division-based data into grid-based data. An important part of the QCDSS is
the user-friendly graphical user interface that allows for an easy access to models and data.
The QCDSS has been mainly developed on a PC platform (a Pentium 90), as this is a
platform available to the largest number of users. Although an increasing number of sector
models has been developed to run on PCs, there is a number of models that have higher
memory or speed requirements. Also, some local authorities might already use
workstations. For these reasons the exemplar model introduced m Section C and &cscribed
in [Kupiszewska 1996al has been developed partially on the Pentium PC and partially on
the Sun workstation
B.1 Database desi~n
B.l.l Common fde structure
Data are kept in space delimited text files, which facilitates t d e r of files between various
plafforms and operating systems. When a file is required as comma delimited text (for
example as an input to MapInfo or ARC/INFO), the easiest way is to open a file
in
Excelspreadsheet and use Save As, selecting comma delimited (.csv) option.
Each fie m the database has the following structure:
Line 1: Data set number
Lme 2:
File
name 'tfilename.e.xt"Line
3:
Description of thefile contentsLine 4: List of variables
Line
5:
BlankLine 6 and subsequent: data
In the above description italics indicate spaceholders for the information referring to a
A data set number identifies a file in a unique way and helps to fmd the detailed
specification of the data set (including the description of all the variables and the source of
the data) in the "Database description" document.
Names of the files must follow the DOS file naming rules, so that the same name could be
used on UNIX and DOSMS Wmdows platforms. A file name filename can be up to eight
characters long. In addition, an extension ext up to three characters long may be included.
The following characters are acceptable: the letters A through
2,
the numbers 0 t h u g h 9,and the following special characters: ', !, $, %,
",
&, (, ),,
-,
{, ), @, ',-,
and
#.A description of thefile contents gives a brief indication of data kept in the file, including
the information on the zoning system, if relevant.
A list of variables gives names of variables in the order m which they appear m the data
lines. There is no restriction on the length of names, because here they are used only for
descriptive purposes. Usually, the corresponding names used in the computer codes of the
models will be different, and then they might be subject to various restrictions. For example
m FORTRAN 77 names of variables are strings composed of up to six characters (letters or
numbers), and beginning with a letter.
The exact format of data lines is specific to each data set. A special format have been
designed for spatially referenced data, in particular for the basic zoning systems used in the
Quantifiable City model
and
for the road network link-based data.B.1.2 Format of spatially referenced data
B. 1.2.1 Geographic files
Geographic files (digital boundaries, point and line objects) are kept in the DXF format, and
in MapInfo or ARCrmFO fonnat when appropriate. Co-ordinates of pomt and line objects
may be also stored m attribute ASCII files, if they are used for modelling rather than
B. 1.2.2 Spatial co-ordinates unites
Co-ordinates of all objects represented in geographic files and attribute files are given using
the British National Grid system described below. Within a GIS, data can be represented in
other co-ordinate systems (e.g. latitudellongitude).
The National Grid [Hartley 19751 is formed by a set of lines drawn parallel and
perpendicular to the central meridian of a Transverse Mercator projection used for the maps
of Great Britain by the Ordnance Survey. The National Grid rectangular co-ordinates are a
set of two numbers, which give the position of a point in terms of its distance east pasting)
and north (Northing) from an origin. The true origin of the projection is at Latitude 49"
North, Longitude 2" West of Greenwich, but the National Grid co-ordinates are given
relative to the false origin, which is located 400 km west and 100
km
north from the trueorigin (so at Lat. 49'46'N; Long. 7'33'W of Greenwich). In this way the co-ordinates of all
the locations within Great Britain are positive and smaller than 1000 km. Eastings and
Northings are given as six digit numbers, expressing the distance from the h k e origin in
meters.
Attriiute files contain variables characterking geographical objects (zones, wards, road
network links etc.). Many attribute files may be created for a given set of objects. Line 4 of
an attriiute file has the form
Object-Code VariableNamel VariableName2
...
Each data line (in Lines 6
-
EOF) begins with the value of an object code (identifier).B.1.3 Basic zoning systems
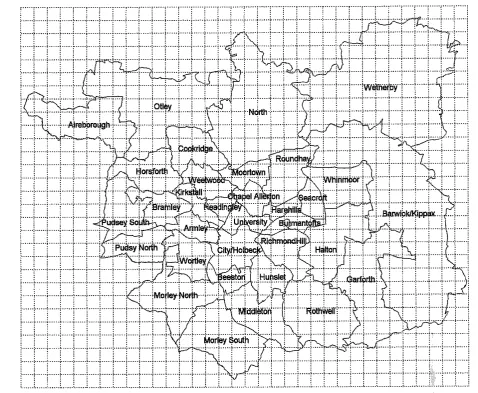
The following basic zoning systems are used in the Quntifiable City model:
Wards (Figure 2)
Postcode Districts
Postcode Sectors (Figure 3)
Postcode Units
Potable Water Zones
Grid-1000: lkm by lkm grid
Grid-100: lOOmby lO0mgrid
Grids based on squares of dierent size are created when necessary (e.g. G-200 with
200m by 200m grid squares). All grids are compatible with
the
British National Griil.Each data line (in Lmes 6 - End-of-file) begins with the value of a zone code. Rules for
creating zone codes are given below.
B.1.3.1 Grid-based data
The code of a grid square is built usmg the National Grid rectangular co-ordinates of the
south-west comer of the square. In the case of the Grid - 1000 (1 km by 1 km), co-ordinates
are expressed m llan units and the code is defined as a six characters string composed of a
three digit easting and a three digit northing. For example for the Leeds Metropolitan
District grid square codes are in the range 413422 to 446450.
For the Grid-100, codes are defined similarly, but they are 8 characters long (e.g.
41304220) and are composed of four digits eastings and four digits northings giving the co-
ordinates of the south-west comer of a square in lO0m units. Codes for the Grid-200 and
Grid - 500 have the same form as for the Grid_100 (8 characters). There is no danger of
confUsing grid squares with the same code but from different grids (e.g. the square
XXXOXXXO from Grid-100 with that from Grid-200) because data for various grids are kept
m separate files and in separate GIs layers). Table 1 gives an example of a grid-based data
Table 1. Beginning of the file containing grid-based data on emissions of pollutants.
Dataset 1
File name "em1 .kt"
Data on emissions of VOC and NOx, based on the 1 km by 1 km grid
Square-Code NOx Total-VOC Anthropogenic-VOC Biogenic-VOC Benzene Toluene
B. 1.3.2 Administrative and census units codes
The coding convention adopted by the OPCS (Office of Population Censuses and Surveys)
[Dale and Marsh 19931 is used for administrative and census units. In England and Wales
each enumeration district has an eight-character code composed of the following elements:
a two character county code, a two character district code, a two character ward code and a
two character Enumeration District code. County codes are two digit numbers in the range
01 to 55. For districts, two letter codes in the range AA to TT are
used.
District codesidentify districts in a unique way, even without the county code. Within each district, two
letter codes in
the
range FA-ZZ are assigned in sequence to alphabetically ordered wards.Within each ward, EDs are coded by two digit numbers starting from 01. Thus, a ward
identifier 08DAFNO1 would be decoded as follows:
08: the county of West Yorkshire
DA:
Leeds
districtFN: Headingly ward
01: enumeration district number 1 within
the
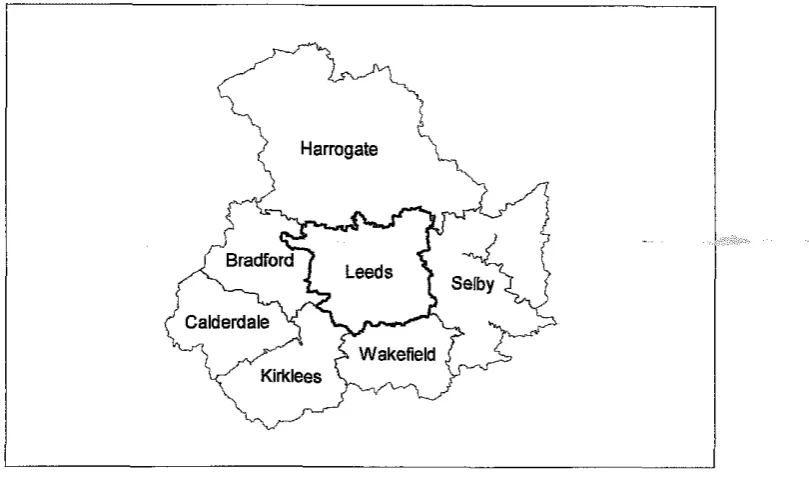
H d q l y wardIn this project a focus is on the Leeds district, but data for neighbouring districts (Figure 4,
Figure 4. Boundaries of Leeds and surrounding districts.
Harmgate
!?Y
Table 2. OPCS codes for Leeds and neighbouring districts.
In the QCDSS Database there are attribute files containing ward names. They have two
colunms containing respectively values of ward codes and corresponding names. Table 3
lists wards in Leeds (file Leeds.W)
[image:17.599.106.511.115.356.2] [image:17.599.66.499.439.651.2]Table 3. OPCS codes for wards in Leeds
B.1.4
Road network link-based data Code 08DAFA 08DAFB 08DAFC 08DAFD 08DAFE 08DAFF 08DAFG 08DAFH 08DAFJ 08DAFJS 08DAFL 08DAFM 08DAFN 08DAFP 08DAFQ 08DAFR 08DAFSTwo types of attribute data files are used
to
store road network link-based information:geographic attniute ASCII files with co-ordinates of link nodes, and other attniute files
(e.g. data on a traffic flows, emissions of pollutants etc.). A number of geographic and
corresponding attribute data files may be created for various possible networks and traffic
conditions.
L i e 4 of an attribute ASCII file has the following form:
Link - Code VariableNamel VariableNome2
...
Name Airborough Annley Barwick Beeston Bramley Burmantfts Chapel Alerton
City & Holbeck
Cookridge Garforth Halton Harebills Headingley Horsforth Hunslet Kirkstall Middleton Code 08DAFT 08DAFU 08DAFW 08DAFX 08DAFY 08DAFZ 08DAGA 08DAGB 08DAGC 08DAGD 08DAGE 08DAGF 08DAGG 08DAGH 08DAGJ 08DAGK Name Moortown Morley North Morley South North
Otley & Wharfdale
Pudsey North
Pudsey South
Richmond
Hi
L i
codes must allow for the unique identification of al i
within a given network, butmight coincide with codes used in other networks.
For example, in the case of a geographic (ASCII) data file Line 4 has the f o m
Link - Code
X1
Y 1X2
Y2According to this, the data lines contain the following information: a link identifier, x and y
co-ordinates of the first node,
x
and y co-ordinate of the second node. Node co-ordinatesare given as National Grid rectangular co-ordinates (described in the section on spatial co-
ordinates unites)
B.2 G r a ~ h i c a l User Interface
The main purpose of the Graphical User Interfkce (GUI) is to allow for access to the data
and models to a non-specialists. Although the development of the
111
GUI was outside theobjectives of Stage 1 of the project, it was decided that the design and development of a
prototype of the GUI would be useful to demonstrate some features of such an interface.
Quantifiable City Decision Support System wiU include a large number of models and data.
Therefore, a particular attention should be paid to the development of
a
user-fiiendlygraphical interface (GUI). In doing so, one has to address the expectations of a
contemporary user, who is usually looking for an interactive, graphical, Widows-based
system Such a system should allow for an interactive access to models and for visualisation
of model inputs, outputs and monitored sustakdiity indicators. A prototype GUI for the
QCDSS has been developed using Visual Basic, an application development tool described
below.
B.2.1 Characteristics of Visual Basic
Until recently the design of a decision support system with a graphical user interface, like a
design of any Widows-based application, was a lengthy job requiring extensive knowledge
of programming in a relatively low level language like C or C++. One of tools which has
now available m version
V B
3.0 (Standard or Professional Edition) torun
on Windowsversion 3.0 or later, and VB 4.0 to run on Windows NT and Windows 95. Visual Basic is a
visually oriented "development platform that integrates graphical tools, a debugger, a
compiler and the Basic language mto a single environment" pourgeois 19941.
With Visual Basic the development of in-house applications interacting with databases
becomes relatively quick even for a non-specialist. The
first
step of the design involves noprogramming at all. Instead of writing a code one just chooses elements of thr pphical
interface (so called controls) from the Toolbox (which contains icons of all controls such as
a command button, a text box, a picture box) and drags them with the mouse onto the
desired place on a form (a Window). Then one specifes the properties of the controls (for
example size, caption, colour, font) in the Properties window. Figure 5 shows how an
application might look at the design stage. The controls often used are there: a Command
button, a List box, a Check box, Option buttons, a Label, a Graph control, a Spm button, a
Picture box (an object next to the Spm button) and a Data controL
Programming comes only at the next stage of the design, when a hctionality is added to
all the elements. This is so called event-driven programming: for each element of the interface one may write a piece of code which will be executed as the result of an event (e.g.
a mouse click, a double-click, a change. Figure 6 gives examples of simple wdes for Click
events of a Quit command button and an Option button. For visualisation of numerical data,
VB
3.0 offers a very useful Graph control, which reduces the amount of programming. Thegraph type may be specified in the properties window (e.g. 2D or 3D Bar, Line, Pie,
Scatter).
Apart &om fonns (*.fin files) certain parts of codes may go into separate modules (*.bas
iiles). Forms, modules (and Custom controls *.vbx, if added) form a project (.rnak file). A
Visual Basic project and its functionality are easy to modify at a later stage, because new
elements may be added at any time, properties of controls may be changed and new pieces
of code added. In particular, Visual Basic is very convenient for developing modular
An important part of many applications is the database. Visual Basic 3.0 has incorporated
the same database engine as Access 1.1, which allows interaction with databases stored in
common formats (Access, dBase, Paradox, FoxPro). With the use of the Data control one
can easily link the required data with the application, by specifling the database name in the
Properties window or in the code. If at the same time the databaserelated properties of a
Text box or a picture control are defined, the required data will be automatically displayed
on the screen. The Professional edition of Visual Basic 3.0 allows not only for using existing
databases but also for creating and managing new databases. -
Visual
Basic does not have special features which would facilitate displaying maps. Thereare two possibilities to solve this problem. One is to buy a custom control from a third-party
developer (e.g. Map Control available by GeoSofi). Second possibiity, probably offering
more functionality for manipulating geographic information, is to
link
Visual Basic with aproprietary GIs software. When developing the Quantifiable City Decision Support System,
the Dynamic Data Exchange (DDE) mechanism has been used to link Visual Basic GUI and
MapInfo GIs.
There is a range of books on Visual Basic programming, for example [Feldrnan et al 19931
is well suited for a novice. Also, an on-line help is very useful.
B.2.2 Components of the QCDSS GUI
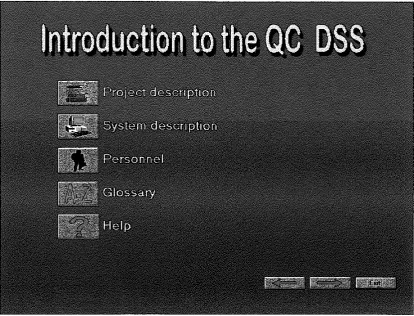
Currently developed components of the Quantifiable City Decision Support System include:
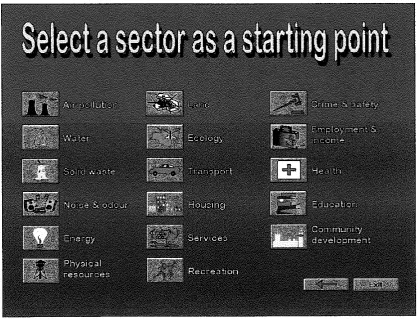
(i) A set of introductory screens giving access to various parts of the system (Figures 7-1 1).
Figure 10 shows a range of issues to be addressed by the QCDSS.
(ii)The screens displaying maps of emissions of NOx and VOC based on lkm x lkm grid
(Figure 12). Data underlying the map has been obtained by KO, within a project
supervised by Clarke [KO 19951. The map demonstrates spatial variations of air quality
within the city of Leeds. To access these screens, click on the Air pol i
u
tion icon on theSector form (Figure lo), than click on the Other data button, and than click on the
Figure 7. The Opening form of the QCDSS.
[image:24.595.90.505.429.745.2]Figure 9. The Opt-menu form.
[image:25.595.89.508.432.751.2]Figure 11 The Sect-opt f o m
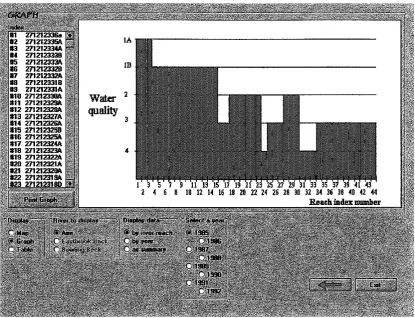
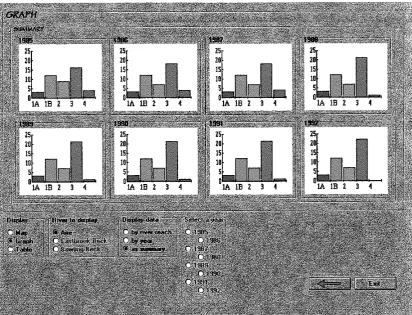
@)The screens displaying data on water quality in the river Aire (Figures 13-16);
Histograms for eight years (1985-1992) presented on Figure 16 show a reduction in the
number of river reaches of class 4, the most polluted, demonstrating a trend towards
sustainability. To access these screens, click on the Water icon on the Sector form
(Figure lo), than click on the Other data button
(iv)Screens displaying data &om the Census 1991 (Figure 17-19)
and
asthma data(admissions to hospital) (Figures 20). These screens have been developed to d e ~ m ~ h a t e
how to link Visual Basic and the MapInfo GIs using MapBasic and the DDE (Dynamic
Data Exchange) mechanism, and to show how to customize the MapInfo menus using
MapBasic. To access these screens, click on the Other data button on the Opt-menu
form (Figure 9).
(v)A link to the Catalogue of Urban Hydrocarbons (Figures 21-26), a visualisation system
displaying concentrations of a number of volatile organic compounds (VOC)
and
polycyclic aromatic hydrocarbons (F'AH) as obtained in monitoring campaigns conducted
in Leeds in 1993-1994 under the supervision of Pilling [Hassoun et al1994, Lewis et a1
19951. Concentrations of VOC are given in CLg/m3, PAH in ng/m3. Data are kept in the
Access database tiles: pahmdb
and
voc.mdb. The Catalogue of Urban Hydrocarbons(CUH) has been developed using Visual Basic, within a project funded by the
Department of the Environment wupiszewska 19941. The link between the QCDSS and
CUH demonstrates the advantages of modular structure of the system and the philosophy
of a step by step system development. To access CUH, click on the Air pollution icon
on the Sector form (Figure lo), than click on the Other data button, and
than
clickFigure 13. The Water form of the QCDSS.
Figure 15. The Water form showing changes of water quality in the selected reach.
[image:29.595.91.504.440.755.2]Figure 21. The Start form of the Catalogue of Urban Hydrocarbons.
[image:34.595.77.523.423.729.2]Kerbside
I
Open space
I
Figure 23. The vocsptrp form showing concentrations of measured compounds in three monitoring sites on the selected day.
[image:35.595.88.522.431.724.2]Figure 25. The pah form displaying concentrations of PAH as a function of time.
[image:36.595.89.520.437.736.2]B.2.3 Technical details of the
QCDSS
GUI.The GUI for the Quantitiable City Decision Support System has been developed as the
Visual Basic application qcdss.rnak, that was compiled to qcdss.exe. All files needed to
develop h t h e r the QCDSS are in the catalogue c:\qcity\dss. The main component files of
the qcdss.mak are listed below:
(i) Introductory form (catalogue c:\qcity\dss\):
0pening.h (Figure 7)
intro.frm (Figure 8)
opt - menu.frm (Figure 9)
sector.frm (Figure 10)
sect-0pt.h (Figure 11)
air .frm
(ii) Emissions of NOx and VOC (catalogue c:\pcity\dss\):
v0cemrnap.h (Figure 12)
(iii)
Water qualitywater-frm (Figures 13-16)
(iv) Census and asthma data ((catalogue c:\q_oity\dss\census):
census1 .frm (Figures 17-20)
(v) Catalogue of Urban Hydrocarbons (catalogue c:\q_city\dss\vocpah):
start.hn (Figure 21) vocinfoLfrm
exitformfrm vocinfo.frm (Figure 24)
a b 0 u t . h pakfrm (Figure 25)
map.frm P & P . ~
sites.frm (Figure 26) pahinfolfrm
v 0 c . h (Figure 22) pahinf0.h
vospsng.frm g1obal.h
vocsptrp.frm (Figure 23) printing.bas
Additionally, the catalogue c:\q-cityldss contains files voc.mdb and pakmdb, that are
Access database files with data on VOC and PAH concentrations; and some auxiliary files
catalogue c:\ccity\dss\data: rivers.txt (data on water quality), 1eedsbor.txt (Leeds
boundaries) and emissio.txt (emissions of VOC and PAH by grid square).
Displaying spatial information using MapInfo, implemented in the censusl.fh, requires files
1ee.wor (MapInfo workspace) and 1eel.mbx (compiled MapBasic program lamb).
All
filesrelated to the census1.h form are kept in the catalogue c:\qcity\dss\census. The Viual
Basic code has been written to communicate with MapInfo version 4.0. In order to work
with MapInfo 3.0 the line AppActivate "Maplnfo Professional
-
[Leeds Map]" inthe Activ subroutine in the Census1 form should be substituted with
the
line AppActivate"Maplnfo
-
[Leeds Map]". Similarly, theline AppActivate "Maplnfo Professional-
[Leeds Browser]" in the subroutine Activl should be substituted with the textAppActivate "Maplnfo
-
[Leeds Browser]".AU
changes in the location of the files used by QCDSS must be reflected by the appropriatechanges in the Visual Basic and MapBasic codes.
B.3 Sectoral models and the GIS
Our philosophy of a cost-effective strategy for the development of an integrated model of
city sustainability is that this should be a gradual process exploiting as much as possible
existing models. Theoretical formulations of models and operational models that might be
used include: demographic models, economic models, land use and transport models, air
pollution models, water supply, demand and quahty models, etc. These models will have to
be modified
and
linked with each other to address thenew
objective of wstakbilitymodelling.
The usefulness of the integrated model depends to a large extent on the quality of its
component modules
and
a particular attention must be paid tothe
selection of suitablesectoral models. Possible sources include: (i) models recommended by national government
agencies, e.g. the US EPA (which are likely to be well-tested);
(ii)
models from commercialconsultancies (scientifically more up-to-date, but expensive), and
(iii)
models from themodels are available in a compiled form, which makes any modifications impossible.
Therefore, it is important that selected models have a large number of controllable variables,
so that a wide range of policies and scenarios can be tested.
A number of existing sector models, developed in Europe and in the United States, are
listed in [Kupiszewska 1996bl. Models known as "large scale urban models" [Wegener
19941 has focused on land use, economic development, and transport demand and supply
issues, and would need extensions addressing environmental processes and quaiity of life
issues in order to be used for sustainabiity modelling.
When developing a model for a particular city one might check which models have already
been developed and have been in use either by local authorities or in the academic
environment, and only the missing elements would have to be developed fiom scratch.. The
order in which new elements are added to a system is not universal. Current areas of a
particular concern should be addressed fist, and the modelling process my help to identify
major processes contributing to unsustainability.
An important part of a sustainability modelling system is a Geographic Information System.
A GIs database is a place where all spatial data needed by various mo&k are kept in a
common format (see Section B.1.) Mapping capabilities of a GIs are particularly useful to
present model outputs to decision-makers. At a modelling stage, a GIs is used for
geographical analysis operations such as overlaying and buffering. There are two basic types
of commercially available GIs systems: vector and raster (see Kupiszewska 1996b). For
sustainability modelling a combimation of both would be
useful,
with a vector GIs moreappropriate for modelling socio-economic processes and a raster GIs for environmental
processes. However, to map an output h m environmental models, a vector GIs may be
used as well, by covering the modelled area with a grid of square objects.
There are a number of advantages of the modular structure of a sustainability modelling
system such as QCDSS:
(i) The system may be developed step-by-step, beginning with a model of a small sub-
($One can built on existing, well-established sectoral models that provide reliable results
and that city planners are possibly already familiar with;
(iii)Development work might concentrate on missing components;
(N)Fo~ each component, modelling process would cover each time only these interactions
for which quantitative parametrisation might be established with confidence
(v)A proprietary GIs system, possibly already in place and with a partially developed
database may be used;
(vi)As new and improved models become available, they can replace obsolete s&modek
without the need to change the whole structure.
When implementing the QCDSS for Leeds, the SATURN traffic model has been the starting
point. MapInfo has been chosen as a GIs to be used on the PC platform, while ARCIINFO
has. been used on the UNIX workstation The menu-driven MapInfo system is much more
user friendly than command-driven ARCmTFO, that requires a specialist training, however
the latter is in use by a number of local authorities and has much wider analytical
capabilities. MapInfo has
been
linked with other models and the Database using MapBasicprogramming language.
C.
Description of the exemplar model
.
.The development of the Graphical User I n t e e described in Section B.2 has addressed
mainly the question of visualidon and graphical analysis of data and swtahability trends.
The exemplar model presented in this section has been designed to address computer
modelling issues related to forecasting and policy testing,
and
to test the concept ofthe
modular structure of the QCDSS d e s c n i d in Section B.
The exemplar model ( F i e 27) concerns modelling of links between human activities,
emissions from mob'ie and stationary sources, air quality, and impacts of air pollution on
human health. It aims initially to model emissions from traffic, domestic emissions and
emissions from industrial sources, and to provide a tool for testing an influence of transport
policies on emission levels and their spatial distribution At a later stage an air pollution
Figure 27. Modelling links between traff~c and stationary sources, air quality and population exposure to pollutants.
---.
. .
i
Strategic landi
i
Economicj
i
useltransport modeli
.
i
.
developmenti
I
Census dataI
(assignment and production figures domestic and population
biogenic sources
Emissions from domestic, biogenic
industrial sources
(point coverage) sources @olygon
coverage)
GISdatabases
TI
1
(MapInfo - PC -+ emissions fiom emissions from Population
Ward-based
ARCIINFO- Sun) road trafFc stationary sources asthma data emissions
.---.
*
i
.
i
, Dispersionandj
i
Meteorologyi-.
.
-pi chemical,
: : transformations model :
I _ _ _ _ _ _ _ _ _ _ _ _ . _ _ _ _ _ _ _ _ . C _ _ _ _ _ _ _ - - - _ _ - - - a
GIs maps -+
i
Mapsofair qualityi
,
emissions MapsI
of Population mapsI l l
a s t h q
Map1 ,
cases of---
---.
I
I
I
...-...-.
l...:
j Overlay :
--.-*---.---
QCDSS
I
resulting pollutant concentrations. The latter component is indispensable to model
concentrations of reactive and secondary pollutants, in particular ozone.
The core part of the exemplar model called MUPPETS (Modelling and mapping Urban
Pollutants Emissions from Transport and Stationary Sources) is described in detail in a
separate document [Kupiszewska 1996bl. MUPPETS is composed of two main sub-
models: MUPPET and MESS (Modelling Emissions from Stationary Sources), which
address respectively emissions from mobile and stationary sources. Traffic flows ilcxded to
evaluate emissions h m mobile sources are calculated for peak and inter-peak hours using
the SATURN model, a combined simulation and assignment model that calculates traffic
flows at equilibrium conditions p a n Vliet 19821. The SATURN model has been developed
at the Institute for Transport Studies of the University of Leeds and is commercially
available from W.S. Atkins Consultants.
Calculation of emissions from stationary sources in MESS is based on the methodology
d e s c n i in [KO 19951 and has three components: (i) emissions from industrial sources,
based on employment figures for individual
firms
or industry sectors, and emission rates peremployee by sector or Standard Industrial Classification; (ii) emissions from domestic
sources, based on population data from Census (by enumeration district) and emission rates
per capita, obtained h m national emission inventories;
and
(iiii emission from biogenicsources
(t8rming
and natural sources), based on land use data and emission rates perhectare.
The model of &ions h m mobile sources and the model of emissions from stationary
sources are linked with GIs systems (MapInfo and ARCJINFO), which are used (i) for
mapping purposes; (ii) for recalculation between link-based, grid-based and zone-based data
formats; (ii) to overlay the traffic and environment data with the data from Census (or
population model) in order to evaluate population exposure and social equity.
Several extensions of the core system are possible. In order to test the impact of land-use
environment to land-use. Temporal variations of traffic mi& be evaluated using the
DRACULA dynamic micro-simulation model [Liu 19951. A promising candidate for the air
dispersion model is the recently released ADMS-Urban model from Cambridge
Environmental Research Consultants (CERC).
Modelling links between air pollution and health is particularly difficult and we are not
aware of any operational model that could be used here. Initial investigation might include
overlay of air quality maps with a map of asthma cases (relevant data on aduhsions to
hospitals by ward are available), however a possible correlation between high pollutant
concentration levels and a number of asthma attacks would not necessarily imply any causal
link between the two, due to the large number other intervening fhctors.
Acknowledgements
The work descriied in this paper has been conducted within the Quantifiable City project of
the Sustainable Cities program funded by the Engineering and Physical Sciences research
Council.
We acknowledge the participation of Tempus students h m Torun, Poland (Mariusz
Nasiadko and Marek Jagodzinski) in the development of part (i) and (N) of the QCDSS
Graphical User Interface.
D.
Bibliography
1. Bates, J., Brewer, M, Hanson, P., McDonald, D., Simmonds, D. (1991) Building a
strategic model for Edinburgh, PTRC 19th Summer Annual Meeting, Proceedmgs of
Seminar G.
2. Bourgeois, D.T. (1994) Visual Basic 3.0, Computer, 27, pp. 94-97.
3. Dale, A, Marsh, C. (1993) The 1991 Census User's Guide, I-JMSO, London
4. Feldman, P., Jennings, R., Seymour, B., Eidson, B., Palmer, P., G h o r , S., Pesso, J.
5. Harley, J.B. (1975) Ordnance Survey maps: a descriptive manual. HMSO, University
Press, Oxford.
6. Hassoun, S., Bartle, K.D., Kupiszewska, D., Pilling, M.J. (1994) Volatile Organic
Compounds in the Urban Atmosphere, [in:] P. Sandra, G. Devos (ed.), Proceedings of
the Sixteenth International Symposium on Capillary Chromatography, Vol. I, Hiithig
GmbH, Heidelberg.
7. KO, Y.-H. (1995) An assessment of emissions of nitrogen oxides and volatile organic
compounds in Leeds. Ph.D. Thesis, Department of Fuel and Energy, Unk-xsity of
Leeds.
8. Kupiszewska, D. (1994) Visualizattion of data on air pollution. School of Chemistry,
University of Leeds.
9. Kupiszewska, D. (1996a) MUPPETS
-
a computer tool for modelling and mappingemissions from urban transport and stationary sources. ITS Working Paper 522,
Institute for Transport Studies, University of Leeds
lO.Kupiszewska, D. (1996b) Modelling for sustainable cities: Conceptual approach and a
review of existing sectoral models for demography, land use, transport and air pollution
modelling. ITS Working Paper 520, Institute for Transport Studies, University of Leeds.
ll.Lewis, A.C., Kupiszewska, D., Bade, K.D., Pilling, M.J. (1995) City Centre
Concentrations of Policyclic Aromatic Hydrocarbons using Supercritical Fluid
Extraction, Atmospheric Environment 29, p. 153 1.
1 Z.Liu, R. (1994) (1 994) DRACULA microscopic traflc simulator. Working Paper 43 1,
Institute of Transport Studies, University of Leeds, U.K.
13.Van Vliet, D. (1982) SATURN
-
A modern assignment model. T r a f c Engineering andControl, Vol. 23, pp. 578-581.
14.Wegener, M. (1994) Operational urban models. State of art. Journal of the American