This is a repository copy of In-situ crystal morphology identification using imaging analysis with application to the L-glutamic acid crystallization.
White Rose Research Online URL for this paper: http://eprints.whiterose.ac.uk/99208/
Version: Accepted Version
Article:
Huo, Y, Liu, T, Liu, H et al. (2 more authors) (2016) In-situ crystal morphology identification using imaging analysis with application to the L-glutamic acid crystallization. Chemical Engineering Science, 148. pp. 126-139. ISSN 0009-2509
https://doi.org/10.1016/j.ces.2016.03.039
© 2016. This manuscript version is made available under the CC-BY-NC-ND 4.0 license http://creativecommons.org/licenses/by-nc-nd/4.0/
[email protected] https://eprints.whiterose.ac.uk/ Reuse
Unless indicated otherwise, fulltext items are protected by copyright with all rights reserved. The copyright exception in section 29 of the Copyright, Designs and Patents Act 1988 allows the making of a single copy solely for the purpose of non-commercial research or private study within the limits of fair dealing. The publisher or other rights-holder may allow further reproduction and re-use of this version - refer to the White Rose Research Online record for this item. Where records identify the publisher as the copyright holder, users can verify any specific terms of use on the publisher’s website.
Takedown
If you consider content in White Rose Research Online to be in breach of UK law, please notify us by
In-situ Crystal Morphology Identification Using Imaging Analysis
with Application to the L-glutamic Acid Crystallization
Yan Huo
a, Tao Liu
a,*, Hui Liu
b, Cai Y. Ma
c, Xue Z. Wang
c,da
Institute of Advanced Control Technology, Dalian University of Technology, Dalian, 116024, P. R. China, b
Department of Biomedical Engineering, Dalian University of Technology, Dalian 116024, China c
Institute of Particle Science and Engineering, School of Chemical and Process Engineering, University of
Leeds, Leeds LS2 9JT, UK. d
School of Chemistry and Chemical Engineering, South China University of Technology, Guangzhou
510640, China
Abstract:A synthetic image analysis strategy is proposed for in-situ crystal size measurement
and shape identification for monitoring crystallization processes, based on using a real-time
imaging system. The proposed method consists of image processing, feature analysis, particle
sieving, crystal size measurement, and crystal shape identification. Fundamental image features
of crystals are selected for efficient classification. In particular, a novel shape feature, referred to
as inner distance descriptor, is introduced to quantitatively describe different crystal shapes,
which is relatively independent of the crystal size and its geometric direction in an image
captured for analysis. Moreover, a pixel equivalent calibration method based on subpixel edge
detection and circle fitting is proposed to measure crystal sizes from the captured images. In
addition, a kernel function based method is given to deal with nonlinear correlations between
multiple features of crystals, facilitating computation efficiency for real-time shape identification.
Case study and experimental results from the cooling crystallization of L-glutamic acid
demonstrate that the proposed image analysis method can be effectively used for in-situ crystal
size measurement and shape identification with good accuracy.
Keywords: Crystal morphology; Shape identification; Imaging analysis; Feature analysis; Inner
1.
Introduction
With the rapid development of process analytical technology (PAT) for chemical and
pharmaceutical crystallization, image- based monitoring methods have been increasingly
explored for in- situ analysis of crystal morphology, polymorph and growth quality (Yu et al.,
2007; Chen et al., 2011; Qiao et al., 2011; Nagy et al., 2013; Simon et al., 2015). Ex-situ imaging
methods were developed in the early literature (e.g. Monnier et al., 1997) for analyzing the
crystal shape characteristics. The pioneering works on in-situ image analysis of particle
properties during crystallization can be seen in Blandin et al. (2000) and Wilkinson et al. (2000).
Recently, in-situ measurement and real-time imaging analysis have attracted increasing attentions
from industrial and academic communities (Calderon DeAndaetal.,2005a; Wangetal.,2007; Jia et
al., 2008; Dang et al., 2009; Borchert and Sundmacher, 2011; Zhou et al., 2011; Zhang et al.,
2015), for the sake of monitoring the crystallization process and quality control. Generally, the
developed in-situ imaging systems for monitoring crystallization processes could be classified
into two groups: invasive and non-invasive imaging systems. An invasive imaging system has a
probe type camera which can be inserted into a crystallizer in order to obtain high resolution
images of crystals, e.g. the process vision and measurement (PVM) instrument made by Mettler
Toledo company had been successfully applied to monitor the cooling crystallization (Jia et al.,
2008; Dang et al., 2009; Zhou et al., 2009). In contrast, a non-invasive imaging system uses one
or more cameras placed outside a crystallizer to monitor crystal size, shape and growth rate, such
as the Malvern Sysmex FPIA 3000 (Borchert and Sundmacher, 2011) and the online microscopy
systems (Larsen et al., 2007; Wang et al., 2008; Zhang et al., 2015). The use of a non-invasive
imaging system can avoid the camera lens or probe surface from being blurred by the crystal
slurry to guarantee measurement validity (Borissova et al., 2009; Simone et al., 2015). A possible
disadvantage lies with the inconvenience of building up a suitable holder around the crystallizer
for a non-invasive imaging system, while the imaging effect may be somewhat inferior to that of
an invasive imaging system.
Using the captured images from these in-situ imaging systems, image analysis methods have
(CSD), particle shape features, and growth rates etc. (Zhang et al., 2014; Camacho et al.,2015).
To effectively extract the crystals from the images, a few image processing methods for real-time
analysis were developed in Calderon De Anda et al. (2005b), Larsen et al. (2006), Sarkar et al.
(2009) and Zhang et al. (2011). Note that in-situ imaging may be subject to the influence from
reflected light, particle movement, and motion of the crystal slurry. This problem was not
seriously considered in the existing references including the above for image processing. For the
classification of crystal polymorphic forms, Calderon De Anda et al. (2005c) developed an
artificial neural network approach to distinguish and forms of L-glutamic acid (LGA) based
on establishing the Fourier descriptors for the captured crystal images. Subsequently, Borchert et
al. (2014) adopted the Fourier descriptors in combination with the historical crystal image data of
shape information to classify the crystal shapes. Ferreira et al. (2011) proposed the use of
discriminant factorial analysis (DFA) to obtain an automatic classification method of the particle
shapes, which was demonstrated to be effective for the classification of the monocrystal
complexity level. Derdour and Chan (2015) developed a model for predicting the crystal growth
rate and aspect ratio, based on analyzing the seed features. Owing to the crystallization process
complexity in a stirred crystallizer, there was no commonly recognized imaging methodology for
analyzing the crystal shapes as yet (Wang et al., 2008; Nagy et al., 2013). Real-time identification
of crystal shape remains as an open issue for exploration. Concerning image-based calibration of
the crystal sizes for in-situ measurement, few references reported feasible calibration methods for
the application of either invasive or non-invasive imaging systems.
In this paper, a synthetic image analysis method is proposed for in-situ crystal size
measurement and shape identification, for the purpose of real time monitoring crystallization
processes. It can be effectively implemented under a variety of practical constraints (e.g. random
crystal movement or rotation in the crystallizer, solution turbulence, and uneven illumination for
imaging etc.). The proposed method includes image processing, feature analysis, particle sieving,
crystal size measurement, and crystal shape identification. Figure 1 summarizes all the sequential
steps in the proposed method for real-time crystal morphology analysis. Fundamental image
agglomeration or fraction/breakage that misleads imaging statistics, a clustering strategy is given
to sieve out valid particles for effective analysis of crystal morphology. Moreover, an efficient
shape identification method is developed by defining an inner distance descriptor (IDD) to
quantitatively describe different crystal shapes. In addition, a pixel equivalent calibration method
based on subpixel edge detection and circle fitting is proposed for in-situ measurement of crystal
sizes. To address multiple features of crystals, a kernel function based feature classification
method is developed for shape identification of valid particles sieved from the captured images.
Experimental results on image processing and shape identification are given to demonstrate the
effectiveness of the improved strategy for in-situ monitoring of the crystal morphology for the
LGA crystallization process.
The rest of the paper is organized as follows. Feasible image processing methods are
presented in Section 2 for practical application subject to uneven illumination, crystal motion and
solution turbulence from the crystallization operation. In Section 3, the proposed feature exaction
method is elucidated by defining the fundamental features of crystals for imaging analysis,
followed by particle sieving, size measurement and shape identification methods given in Section
4, Section5 and Section6, respectively. Section 7 shows experimental results to demonstrate the
effectiveness of the improved method. Finally, some conclusions are drawn in Section 8.
2.
Image processing
For using an in-situ imaging system to monitor a crystallization process, the goal of image
processing is to obtain clear particle micrographs with sharp edges from the in-situ images taken
in real time. Only a few image processing methods were developed for particle detection in terms
of in-situ images in the literatures (Calderon De Anda et al., 2005b; Zhang et al., 2011; Zhou et
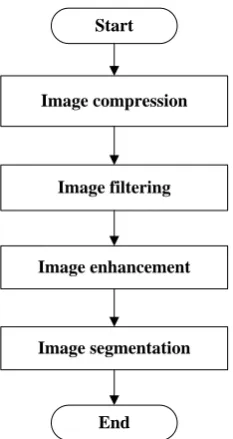
al., 2011). In this work, image processing consists of image compression, image filtering, image
enhancement and segmentation, as shown in Figure 2, which are briefly presented in the
following subsections, respectively.
2.1 Image compression
The size of a captured image depends on resolution of the imaging system and the size of the
causes time delay for online analysis. Therefore, an efficient compression method should be
established to reduce the size of the image while maintaining fundamental information to
facilitate real-time analysis. It is well recognized that an image compression algorithm based on
the wavelet transform (Gonzalez et al., 2009) has the advantage of high compression ratio and
compression speed, which is therefore adopted for real-time image analysis as below.
Given an original image f(x, y), with the size M × N, the two- dimensional discrete method
(Mallat, 1989) is used for the wavelet transform. Firstly, a two-dimensional scaling function
(x,y), and a translated basis function (x, y), are defined by
(1)
where identify three directional edges including horizontal, vertical,
and diagonal directions, respectively. Denote by m the row, by n the column, and by j the scale.
The above two-dimensional functions are computed from the predefined one-dimensional
functions by
Secondly, the discrete wavelet transform for f (x, y), is obtained as
(3)
Then the original image f(x, y) is decomposed into the low frequency component
which is used to approximate f (x, y) at scale j (j = 1 is preferred herein), and the high frequency
components to be discarded.
Finally, the compressed image is quantized from the low frequency component in the
intensity range (0 – 255).
Note that for the application of such a compression algorithm, it is required to choose a
suitable wavelet function which determines the quality of the compression. The biorthogonal
wavelet function (Gonzalez et al., 2009) is herein preferred which can guarantee good linear
phase, regularity and entire reconstruction.
2.2 Image filtering
captured images suffer from measurement noise. Since the majority of image information is
located in the low frequency range, existing denoising methods were mainly based on using a
low-pass filter. However, the image detail located in a higher frequency range may be excluded
by such a denoising method. It is therefore expected to remove the noise influence while
maintaining the image texture. Note that the previous image compression will also leave out
some detail information especially for a higher frequency range. Hence, the combination of two
filtering methods is suggested to deal with this problem.
Firstly, the guided filtering method (He et al., 2013) is adopted which uses a guided image
for filtering. The guided image may be taken as a preprocessed image or a sample image. When a
sample image is used, the guided filtering acts as an edge-preserving filter similar to a bilateral
filter, which guarantees good preservation around the image edges. Moreover, the guided filtering
is based on using a linear time algorithm which is capable of fast computation regardless of the
range of image intensity.
For using the guided filtering, it is a key assumption that in a local region k centered at the
pixel k in the input image, there is a linear relationship between the pixel pi in the input image
and the pixel qi in the output image of the same size W × H ( i k, and k < W × H), which is
expressed by
(4)
where k is a square window which is taken as 51 × 51 in this work, (ak, bk) are the constants in
k which can be estimated by minimizing the squared difference between qi and pi, i.e.
min (5)
where is a penalty parameter which is taken as 0.01 in this work.
Then the solution is obtained by using the filtering method (He et al., 2013),
(6)
and
(7)
where k and are the local mean and variance of the input image in k, | | is the total number
(8)
The result of guided filtering is therefore obtained as
(9)
Secondly, the shock filtering (Osher and Rudin, 1990) is preferred for image texture
sharpening. The shock filter yields distinct discontinuities at image edges while improving the
image clarity. Denote by q(x, y) the input image, the output image denoted by s(x, y) is computed
as
s sgn (10)
where q (x, y) is the second order directional derivative of the gradient direction , q (x, y) is
the input image gradient, and sgn denotes the mathematical sign function.
As a result, the combination of image filtering methods can be quickly executed to avoid the
notorious block effect, while preserving the image edges and fundamental texture details.
2.3 Image enhancement
To cope with the uneven brightness of captured images and the reflective effect of crystal
surfaces, image enhancement should be conducted to strengthen ROI, namely, crystal particles,
and facilitate the subsequent segmentation. The multi-scale Retinex (MSR) algorithm (Sha et al.,
2012) is therefore adopted to deal with images having poor visibility or low contrast. Moreover,
the histogram equalization (Gonzalez et al., 2009) is chosen for gray level adjustment and
contrast stretching after enhancement. For each point in an enhanced image denoted byr x y( , ),
the MSR is explained by
( , ) {log ( , ) log[ ( , ) * ( , )]}
K
k k
k
r x y
W s x y F x y s x y (11)where * denotes the convolution operation, s x y( , )is the input image, k is the number of retained
scales, Wk is the weighting factors taken as W1W2 W3 1 / 3 for = k 1, 2, 3. Fk(x, y) are the
surround functions defined by
2 2 2
( )/
( , ) x y ck
k k
F x y e (12)
where ck are the standard deviations of Gaussian distribution that determine the scale with values
of 10, 80 and 150 for k = 1, 2, 3, and k are taken to satisfy
( , ) 1
k
F x y dxdy
In order to enhance image contrast, it is suggested to increase the dynamic range of image
intensity using the histogram equalization by letting
(14)
wherenjis the number of pixel gray level j, N is the number of total pixels, and J is the maximum
gray level.
2.4 Image segmentation
Before image feature analysis, the desired ROI needs to be determined via image
segmentation. To procure the efficiency of image segmentation, a thresholding segmentation
method is proposed based on the minimum cross-entropy thresholding algorithm (Li and Lee,
1993).
Suppose that a one-dimensional histogram of the original image is composed of h(i) (i = 1,
2, ..., L, ) the cross-entropy discriminant function is defined by
D (15)
where i is the gray level, t is the threshold, n(1, t) is the gray level of the target and n(t, L+1) is
the gray level of the background after the segmentation. Both n(1, t) and n(t, L+1) are taken as the
mean values of the referred regions.
The optimal threshold is determined by
arg min (16)
Accordingly, the gray level b(x, y) in the binary image is determined by
b (17)
After segmentation, a morphological region-filling strategy is adopted to fill up the holes
inside the segmented image, such that the resulting ROI includes all the target crystal particles
while the image background is removed.
3.
Feature analysis
To analyze crystal morphology properties, multiple image features should be extracted for
the sake of quantitative assessment. In the previous work (Wang et al., 2008), a total number of
88 shape descriptors were derived for each particle measured using a Malvern PVS830 system,
which had considerable computation burden and moreover, there was implicit correlation
avoiding the correlation between multiple features for analysis, it is proposed to adopt three types
of crystal features for identification, i.e. size feature, shape feature, and texture feature. These
features are interpreted in the following three subsections.
3.1 Crystal size feature
The crystal size feature describes the geometric size property of the particle with respect to
the time sequence. At present, the equivalent diameter has been mostly taken as the size index for
assessment of CSD (Presles et al., 2010), which, in fact, is mainly effective for spherical particles.
For various shapes of particles, it is proposed to measure the orthogonal axial lengths that
indicate the maximum length and width of a particle contour to represent basic two-dimensional
(2D) size information of crystals. The orthogonal axial lengths are suitable not only for
evaluating the sizes of particle shapes like plate, rod and needle etc., but also for spherical
silhouette owing to that the length is a good approximation of its diameter. The axial length and
width can be quantitatively estimated by means of the best-fit rectangle method (Wang, 2006). In
addition, the area and perimeter of a particle are adopted to facilitate the computation of crystal
shape feature as presented in the next section. Table 1 lists these four parameters chosen as the
crystal size feature for image analysis.
3.2 Crystal shape feature
There are a number of particle features studied in Pourghahramani and Forssberg (2005) and
Bagheri et al. (2015). Most of them, however, demand high computation effort and time-
consuming. To facilitate in-situ identification of crystal shape features with moderate
computation effort, typical 5 shape feature indices are chosen, including circularity degree,
rectangular degree, elongation ratio, concave–convex degree, and eccentricity, which have been
well recognized to discriminate crystal shapes in terms of classical shape descriptions. For
instance, the circularity degree, C, which evaluates the similarity between a particle shape and a
circle, is defined by
(18)
where S is the area of the particle, and P is the perimeter of the particle.
crystal shapes, a novel shape feature index, IDD, is herein proposed to improve the classification
accuracy. The distances between the image centroid and the boundary points are computed to
determine the IDD value. Generally, the closed particle contour curve is denoted by
( ) ( ) x x y y
(19)
The coordinates of boundary points are denoted by (xn,yn), where n1, 2, ,N, and the
centroid coordinate denoted by (x yc, c)is defined as
1 0 1 0 1 1 N c n n N c n n x x N y y N
(20)The inner distances from the centroid to the boundary points are defined by
2 2
( ) ( )
n c n c n
d x x y y (21)
With the computed polar coordinates of boundary points,(dn,n), , the deviation
distance is defined as
n dn d
(22)
where d is the mean value of dn, i.e.
1 1 N n n d d N
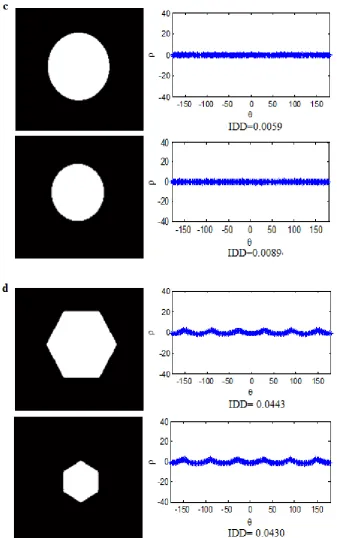
(23)For illustration, Figure 3 shows the plot of deviation distances for a few typical geometrical
shapes. It is seen that although the deviation distances can be referenced to distinguish different
shapes to some extent (Zhou et al., 2009), and it is inconvenient for real-time classification of
different shapes. To circumvent the problem, the IDD index is proposed by
/
Bd sd d (24)
where sd is the standard deviation ofn.
For comparison, Figure 3 also shows the IDD indices for these shapes. It is seen that
different shapes correspond to different IDD values, owing to the fact that IDD has the properties
of size invariance and geometric direction independence. Therefore, the IDD index can be
effectively used for in-situ shape identification regardless of the locations or orientations of
crystals.
(Flusser and Suk, 1993) are adopted to assess the irregularity of particles. The Fourier descriptors
describe the shape of a particle contour, while geometric moments reflect the affine invariant
feature inside characteristic.
For clarity, all the above shape feature indices used for in-situ image analysis are listed in
Table 2.
3.3 Crystal texture feature
Texture feature describes the surface property of crystals. It is determined by the
characteristics of pixels in a region rather than one pixel, and therefore can be referenced to
eliminate the noise influence. Recently, a texture analysis method based on defining fractal
dimension and energy signature was developed for particle characterization (Zhang et al., 2014).
However, the texture feature had been rarely applied to crystal shape classification in the
literature. Herein the crystal texture feature is adopted to discriminate spatial variation of pixel
intensity for different particle types, e.g. the texture feature of impurities is different from that of
a valid particle even though they may have similar shapes. A texture computation method based
on the gray level co-occurrence matrix (GLCM) has been well recognized for image surface
analysis (Gadelmawla, 2004), and a few important image analysis parameters (e.g. contrast,
energy, and entropy) can be derived from GLCM. Besides, the fractal dimension index
(Bouboulis et al., 2006) has the properties of self-similarity and irregularity, which can be used to
evaluate the geometrical texture feature (Zhang et al., 2014).
To quantitatively assess the texture feature of individual crystal images, the above four
typical indices of texture feature are taken into account as listed in Table 3, including contrast,
energy, entropy, and fractal dimension.
4. Particle sieving
Crystal particles are subject to breakage and agglomeration inevitably during the
crystallization process. Moreover, there are an amount of particles far away from the camera lens
focus of an in-situ imaging system, which should be separately considered for effective image
analysis. Generally, tiny pieces and agglomerated particles should be sieved out beforehand. It
Zhou et al., 2009). However, for images including small crystals, such sieving may delete by
mistake valid crystals of small size. It should be noted that the concave–convex degree of a valid
particle is apparently larger than that of two or more agglomerated particles in a captured image.
The concave–convex degree reflects the area ratio of a particle area over the minimum convex
hull area (Berg et al., 2008) of the particle shape, as listed in Table 2. An adaptive particle sieving
method in terms of a real-time area threshold and concave–convex degree is therefore proposed
to effectively remove meaningless particles, based on real-time size estimation of valid crystals
by using the k-means clustering method (Jain et al., 1999).
Firstly, the areas of all the particles are extracted in an image in terms of the pixel level, as
defined in Table 1. Then these areas are classified into k clusters (i.e. k = 4), large, medium, small
and extra-small, as follows.
Denote by X = {x (i)| i= 1, 2, , m} the area set, where m is the number of particles, and by
(j), j = 1, , k the cluster centroids computed from X, where j is the cluster index. The k-means
clustering algorithm is performed by iterating the following two steps until (j) converge to the
optimal values, with an initially random choice of (j) within X:
(1) Assign x(i) into the nearest cluster indexed by c(i) which is defined as
min (25)
(2) Update the cluster centroids (j) of X by
(26)
After clustering, the cluster corresponding to the minimum of (j) is indexed by j*, i.e.
arg min (27)
Then all the particles within the extra-small cluster of j* are regarded as tiny particles or
meaningless pieces to be deleted.
Similarly, the concave–convex degrees (defined in Table 2) of all the particles in the same
image are computed and classified into k clusters (e.g. k = 2) using the above k-means clustering
algorithm. Consequently, particles belonging to the cluster corresponding to the minimum of (j),
i.e. the lowest concave–convex degree, are deleted.
effectively sieved out.
5. Particle size measurement
Although imaging systems have been developed for monitoring crystallization processes in
the past years, in-situ measurement of particle size is still under investigation (Nagy et al., 2013).
A feasible pixel equivalent calibration method is proposed to measure real crystal sizes from the
captured images. Note that the depth of the imaging field for a crystallizer is relatively short and
fixed, such that the calibrated size is almost not affected by the imaging depth. A micro-scale
circle with a known diameter is herein taken for calibration, in consideration of that a circle is not
affected by the geometric direction while assessment on a black circle area in contrast to a
transparent background is not affected by the line width of the edge circle. The proposed
calibration method consists of subpixel edge detection and circle fitting, which are detailed in the
following subsections.
5.1 Subpixel edge detection
In order to guarantee the measurement precision, the subpixel edge should be detected. The
gray moment edge detection method (Tabatabai and Mitchell, 1984) has been well recognized for
subpixel edge detection in terms of one- and two-dimensional data. The rationale behind a gray
moment edge localization algorithm is that the edge distribution of an image is in coincidence
with its gray moment in contrast to a transparent background. To ensure computation efficiency, it
is proposed to use 45 pixels to span the micro-scale unit circle for calibration and positioning,
which is shown in Figure 4(a) in terms of the sequence of these pixels named as edge operators.
Each edge operator corresponds to an ideal edge element defined over a unit circle with four
parameters: h1, h2, , , as shown in Figure 4(b).
Using the gray moment edge detection method, the first three sample moments are
determined by
(28)
where Ii is the intensity of the ith grid shown in Figure 4(a), and i is the corresponding weights.
Denote by p1 and p2 the area ratios of h1 and h2 in the unit circle, respectively. The values of
1 2 2 2 2 1 1 1 1 2 2 2 1 1 1 2 4 1 1 1 2 4 p s s p s s p h m p p h m p (29)
where 2
2 1
m m
,3
3 1 1 2 3
2 3
m m m m
s
.
The parameter is obtained by
cos
(30)
The edge linear equation is formulated by
1 2 1 2
cos sin ,
cos sin ,
x y p p
x y p p
(31) where 45 45 0 1 1 45 45 0 1 1 / /
j j j
j j
j j j
j j
x x I I
y y I I
and2 2
0 0 0
2 2
0 0 0
sin /
cos /
y x y
x x y
.
where Ii is the intensity of the ith grid, and (xi, yi) are co-ordinates of the center of ith grid shown
in Figure 4(a).
5.2 Circle fitting
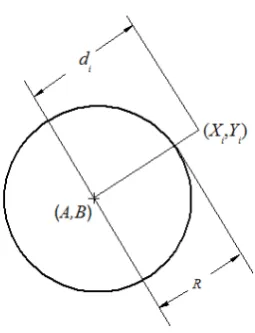
By using the above edge detection, the edge points (Xi, Yi), i = 1, 2, …, N are obtained.
Denote by (A, B) the circle center, by R the circle radius, and by di the distance between the ith
edge point and the circle center, as shown in Figure 5.
There stands
(32)
Let , there is
(33)
2 2 2
2 2
a A
b B
c A B R
(34)
Define an error function of circle fitting by
2
2 2 2
( , , ) i [( i i i i )]
Q a b c
X Y aX bY c (35)For Q a b c( , , )0, there exists the global minimum of Q according to the least-squares
fitting circle methodology (Watson, 1999). The minimum can be determined by taking the partial
derivatives of Q with respect to the variables (a, b, c) and letting them zero. Using the
corresponding (a, b, c), R can be determined from Eq. (34).
Hence, the calibrated pixel equivalent (unit: mm/pixel) is computed by
(36)
where Da is the diameter of the adopted circle scale for calibration
Based on the above subpixel edge detection, the pixel numbers of the length and width of a
particle shape are measured in terms of the best-fit rectangle method (Wang, 2006), respectively.
Denote by La the measured pixel number for the particle length and by Sa the measured pixel
number for the particle width as defined in Table 1. The real 2D sizes of the crystal, i.e. the real
physical length denoted by Lp and the real physical width denoted by Wp, are computed by
(37)
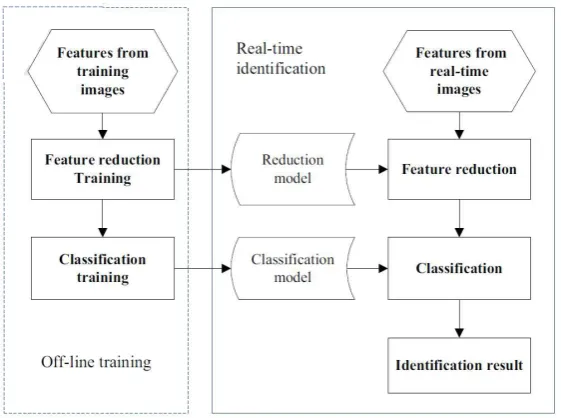
6. Shape identification
The proposed shape identification method is composed of feature dimension reduction and
shape classification. Both are conducted off-line for model building, and then are implemented
for real-time shape identification. The identification procedure is illustrated in Figure 6.
6. 1 Feature dimension reduction
To avoid nonlinear correlations involved with multiple feature variables established herein, a
feature dimension reduction method is proposed to facilitate shape identification and
classification.
Initially, the number of Fourier descriptors (listed in Table 2) should be specified based on
suggested to take the minimum perimeter as the number of Fourier descriptors. Otherwise, the
number of Fourier descriptors is fixed as 64 (Calderon De Anda et al., 2005a, 2005b).
Considering that the number of Fourier descriptors is relatively large and the geometric
moment feature has 7 parameters, it is suggested to use a principal component analysis (PCA)
method for a preliminary dimension reduction of these feature variables.
To deal with the nonlinearity of feature variables, the kernel discriminant analysis (KDA)
method (Lu et al., 2005) may be used. However, the computation of the projection function in
KDA includes eigen-decomposition of the kernel matrix, which demands high computation effort.
Inspired by the spectral regression kernel discriminant analysis (SRKDA) (Cai et al., 2011)
having moderate computation effort, the SRKDA algorithm in combination with the optimal
parameter selection is given as below.
All the feature variables denoted byX[ ,x x1 2, ,xN]Tare mapped into the kernel space,
1 2
( )x [ ( ), ( ),x x , (xN)]T
, by using a nonlinear mapping function, .
Denote by c the number of classes, and let
1
1 1
[0, 0, , 0,1,1, ,1, 0, 0, , 0]
k k c
i i
i i k
T k m m m y
(38)
wherek1, 2, ,candy0 [1,1, ,1]T. There are
Vyy (39)
K y (40)
where k is the kernel matrix and V is defined by
,
1/ ,
0, .
k k j
i j
l x and x class k
V otherwise (41)
To accommodate for computation loss, the following linear approximation is used,
(KI) y (42)
where is an adjustable parameter and I is the identity matrix. It follows that
* 1
(K I)
y (43)
Consequently, the regression objective in terms of the L1-norm is:
= arg 2
1 1
min ( ( , ) ) | |
N N
T
i i i
i i
K x x y
(44)To solve the above regression problem, the least angel regression (LARS) (Efron and
kernel function for the convenience of computation.
Note that the parameter of RBF function used in the above SRKDA may affect the
classification accuracy. The linear minimum distance classification (LMDS) (Baudat and Anouar,
2000) is used to determine the optimal parameters based on the linear separability principle in the
high dimensional space. Briefly, the training set is equally divided into two parts, Mt and Nt,
where t = 1, 2, …, l/2 and l is the training sample number. The class center vector Uk (k = 1, 2, …,
c) denotes the sample mean of each class in Mt , where c is the number of classes. The distance
between Uk and Nt can be computed and the class for Nt is determined by the criterion of
minimum distance. The classification accuracy rates are computed with respect to different RBF
parameters. The optimal parameter is determined in terms of the highest linear classification
accuracy rate.
At first the training set is divided into two parts (Mkand Nk), (k1, 2, ,K/ 2),the
sample number is K ; Secondly, class center vector Uc (c1, 2, , )C are generated for Mk
with the arithmetic average, the number of classes is C ; Thirdly, calculate the distance between
c
U andNk, and the class forNkis determined with the minimum distance criterion; Fourthly,
classification accuracy rates with different parameters are obtained; Consequently, the optimal
parameter range is selected with the most high classification accuracy rate.
6.2 Shape classification
For image-based monitoring of a crystallization process, the number of training images is
usually far smaller than the number of testing images captured in real time. To guarantee effective
classification of feature variables after dimension reduction, the support vector machine (SVM)
method is adopted which is generally effective even for a small number of training samples.
The one-against-one approach of SVM (Hsu and Lin, 2002) is used for multi-class
classification with a voting strategy (Chang and Lin, 2011). It constructs c(c − 1)/2 classifiers
where c is the number of classes. For the training vectors xt, t = 1, 2, , l from the ith and jth
classes, the following optimization is established for binary classification,
min
(45)
where wij is the weight vector, bij is the bias term, and Cp is the penalty parameter. Here the
training vectors xt are mapped into a higher dimensional space by the function .
By training the SVM parameters are derived to establish the shape classification model,
where the kernel function is taken as the RBF function with the kernel parameter g. To determine
g and penalty parameter Cp for computation, a cross-validation method is used which computes
the accuracy rate for different Cp and g so as to determine the best accuracy with the smallest Cp.
7. Case study
A cooling crystallization process of LGA was tested based on using a non-invasive imaging
system to verify the effectiveness of the proposed imaging analysis method for real-time crystal
morphology identification.
7.1 Experimental setup
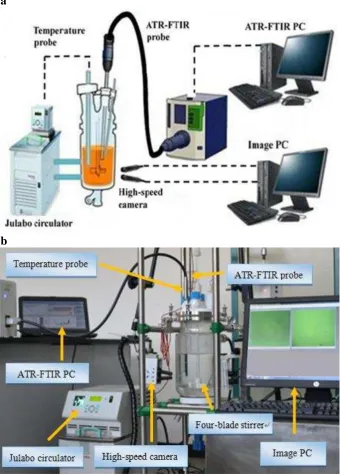
The experimental set-up for capturing the crystal images is shown in Figure 7. The
crystallizer consists of a 4-l (Liter) jacketed glass vessel, a thermostatic circulator (Product no.
Julabo-CF41), a Pt100 temperature probe, and a PTFE 4-paddle agitator. The LGA material
(chemical formula: C5H9NO4, molecular weight: 147.13g/mol, purity: 99%, product of Sigma)
and distilled water were used for experiment. LGA has two recognized polymorphic forms:
prismatic -form and needle-like -form. A non-invasive imaging system including two
high-resolution cameras made by Hainan Six Sigma Intelligent Systems Ltd. (product no.
StereoVisionCrystal-G) was used to take colorful crystal images during the cooling process. The
cameras (UI-2280SE-C-HQ) with CCD sensors and USB Video Class standard were made by
IDS Imaging Development Systems GmbH, which is able to take 6 images per second.
To perform a cooling crystallization test, the initial solution (35g/L) was prepared using the
above LGA material and 2L distilled water in the 4L crystallizer, stirred by a PTFE 4-Paddle
agitator at a speed of 150rpm. The solution was first heated up to 75°C and the temperature was
maintained for 90min to guarantee complete dissolution of the LGA solute. Then the solution was
with respect to the time during the cooling process until the end of crystallization.
7.2 Image analysis and measurement results
In order to measure the real crystal sizes, a circle micro-scale with the diameter of 350 mm
was used to calibrate pixel equivalent before in-situ image analysis. The micro-scale circle was
placed in the camera lens focus. It is seen from Figure 8(a) that the captured image was not
distorted obviously, so the distortion correction was not considered. Figure 8(b) shows the image
of circle scale after image compression and graying. By comparison, Figure 8(c) shows that the
proposed subpixel edge detection method gives accurate positioning, though the gray image of
the circle scale in Figure 8(b) suffers from obvious noise. To verify the accuracy of the pixel
equivalent calibration, three additional circle scales were computed for comparison as listed in
Table 4. It is seen that the measurement error is negligible, well demonstrating effectiveness of
the proposed pixel equivalent calibration method.
After pixel equivalent calibration, in-situ image analysis was conducted for the captured
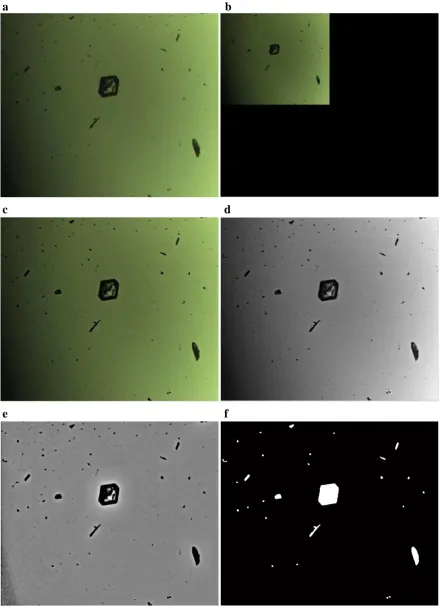
crystal images during the crystallization process, as shown in Figure 9(a)–(f). Figure 9(a)
represents one of the original colorful images. Figure 9(b) shows the pre-processed image by
using the compression method based on wavelet decomposition. Note that the sub-image at the
top-left corner in Figure 9(b) is the compressed image which mainly includes the low frequency
components, while the remaining area in Figure 9(b) mainly includes high frequency components
that are viewed as noise to be removed. Figure 9(c) shows the compressed image de-blurred by
using the guided filtering and shock filtering. Based on the preliminarily established gray levels
of LGA particles for image texture feature exaction, Figure 9(d)–(f) shows the results of gray
level processing, image enhancement and segmentation. The particle intensity and the
background were taken as 1 and 0 for image segmentation, respectively.
To demonstrate the superiority of the proposed image processing method, the multi-scale
method (Calderon De Anda et al., 2005b) and the IA method (Zhou et al., 2011) are also
performed for the original image shown in Figure 9(a). The results are shown in Figure 10. It is
seen that all the particles are effectively detected by the proposed method for crystal morphology
proposed method, while the other two methods leave out certain part of the particle shape.
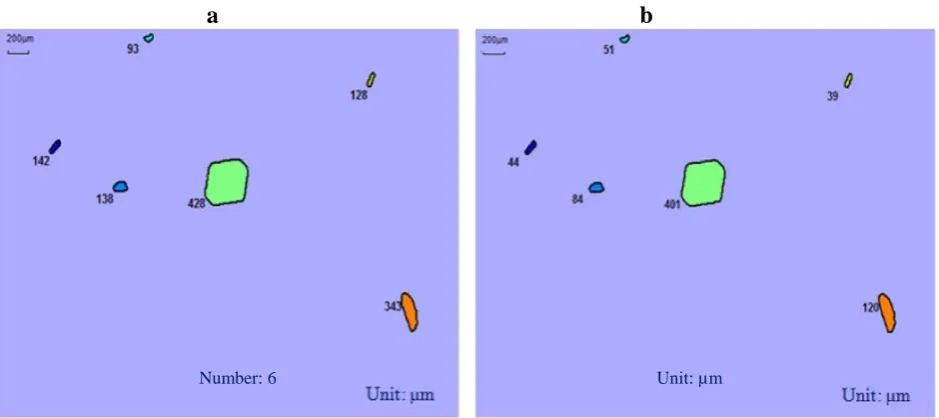
Subsequently, using the proposed particle sieving method, the identified crystals are shown
in Figure 11 along with the marks of measured sizes. By comparing Figure 9(f) with Figure 11, it
is seen that there are 34 particles in the sampled image, including 6 valid particles, 26 tiny pieces
and 2 agglomerated particles, as properly sieved out by the proposed method. Moreover, Figure
11 shows the 2D sizes (Lp and Wp) of valid crystals computed using the formula in (37), which
can be used for analyzing CSD.
To further demonstrate the effectiveness of the proposed image analysis method under worse
imaging conditions, another gray image taken from the crystallization process with higher
turbidity is analyzed as shown in Figure 12. It is seen that valid particles are properly sieved out
from the obscure image, together with good measurement of the crystal sizes.
7.3 Identification results of crystal shape
It is well known that LGA has two basic crystalline forms of prismatic -form and
needle-like -form. Figure 13 shows a captured image of these crystalline forms from the LGA
aqueous solution. It is seen that these forms are different from each other in the image shape and
texture. The fundamental features listed in Tables 2 and 3 are adopted to distinguish these two
forms. Considering that there usually exist agglomerated particles together with impurities in the
LGA solution in practice, another shape denoted by ‘others’ is adopted to indicate these abnormal
particles.
For using the proposed shape identification method, 50 particles of visually confirmed
-form and -form were chosen randomly from the captured images, which were used as the
training set. The testing set was taken as 100 valid particles chosen from the captured images.
By using the SRKDA method to perform feature dimension reduction, the feature dimension
is reduced to two and the parameter of RBF function is taken as 2.3 in terms of the LMDS
method. Through cross-validation, Cp and g are taken as 2 and 128 in the proposed SVM
classification method. The shape identification results are listed in Table 5. It is seen that the
established SVM model had very good recognition rate, which spends the computation time of
8GB. Note that the identification results are based on using a small number of training samples to
identify more testing samples, well demonstrating the effectiveness of the proposed shape
identification method. Note that using the morphology classifying method (Calderon De Anda et
al., 2005c) will spend the computation time of about 3.57 s for the identically reduced feature set.
It should be mentioned that the analysis time spent for each captured image was less than 8 s
by using the above computer, including all the steps of in-situ crystal morphology analysis shown
in Figure 1. This indicates that the proposed image analysis strategy can be efficiently
implemented for real-time monitoring of a cooling crystallization process like LGA.
8. Conclusions
A synthetic image analysis strategy has been proposed for in-situ crystal size measurement
and shape identification, based on using a real-time imaging system for monitoring crystallization
processes. To facilitate analyzing in-situ images affected by uneven illumination, particle motion,
and solution turbulence, practical image processing algorithms including image compression,
filtering, enhancement and segmentation have been presented. Fundamental image features of
crystals have been selected for efficient particle sieving. In particular, a novel feature index
named IDD is introduced to quantitatively describe the crystal shape, which is relatively
independent of the crystal size and geometric direction in the captured image. Moreover, the
proposed particle sieving method can effectively remove meaningless and agglomerated particles,
by using a real-time area threshold and concave– convex degree established in terms of the
k-means clustering. As a result for monitoring the LGA crystallization process, the recognition
rate is over 96% for the and forms of LGA crystals, while a short processing time (smaller
than 8 s) is spent for analyzing each captured image by using a computer with a dual core CPU of
3.40GHz and a memory size of 8GB. It is therefore demonstrated that the proposed imaging
analysis method can be effectively used for in-situ measurement of crystal morphology,
facilitating real-time monitoring of crystallization processes.
Acknowledgement
China Grants 61473054 and 21306017, and the Fundamental Research Funds for the Central
Universities of China.
References
Bagheri, G.H., Bonadonna, C., Manzella, I., et al.,2015. On the characterization of size and shape of irregular particles. Powder Technol. 270(A), 141–153.
Baudat, G., Anouar, F., 2000. Generalized discrimnant analysis using a kernel approach. Neural
Comput. 12(10), 2385–2404.
Berg, M.D., Cheong, O., Kreveld, M.V., et al., 2008. Computational Geometry: Algorithms and Applications. Springer.
Blandin, A.F., Rivoire, A., Mangin, D., et al., 2000. Using insitu image analysis to study the kinetics of agglomeration in suspension. Part. Part. Syst. Charact. 17 (1), 16–20.
Borchert, C., Sundmacher, K., 2011. Crystal aggregationina flow tube: image-based observation.
Chem. Eng. Technol. 34(4),545–556.
Borchert, C., Temmel, E., Eisenschmidt, H., et al., 2014. Image-based insitu identification of face specific crystal growth rates from crystal populations. Cryst. Growth Des. 14(3), 952–971.
Borissova, A., Khan, S., Mahmud, T., et al., 2009. Insitu measurement of solution concentration during the batch cooling crystallization of L-glutamic acid using ATR-FTIR spectroscopy coupled
with chemometrics. Cryst. Growth Des. 9(2), 692–706.
Bouboulis, P., Dalla, L., Kopoulos, V., 2006. Construction of recurrent bivariate fractal interpolation
surfaces and computation of their box-counting dimension. J. Approx. Theory 141(2),99–117.
Cai, D., He, X., Han, J., 2011. Speed up kernel discriminant analysis. VLDB J. 20(1), 21–33.
Calderon De Anda, J., Wang, X.Z., Lai,X., et al., 2005a. Real-time product morphology monitoring in crystallization using imaging technique. AIChE J. 51(5), 1406–1414.
Calderon De Anda, J., Wang, X.Z., Roberts, K.J., 2005b. Multi-scalesegmentation image analysis for the in-process monitoring of particle shape with batch crystallisers. Chem. Eng. Sci. 60(4), 1053– 1065.
Calderon De Anda, J., Wang, X.Z., Lai, X., Roberts, K.J. 2005c. Classifying organic crystals via in-process image analysis and the use of monitoring charts to follow polymorphic and morphological changes. J. Process Control 15(7), 785–797.
Camacho, D.M., Roberts, K.J., Lewtas, K., et al., 2015. The crystal morphology and growth rates of triclinic N-docosane crystallising from N-dodecane solutions. J. Cryst. Growth 416, 47–56.
Chang, C.C., Lin, C.J., 2011. LIBSVM: a library for support vector machines. ACM Trans. Intell. Syst. Technol. 2(3), 389–396.
Chen, Z.P., Lovett, D., Morris, J., 2011. Process analytical technologies and real-time process control: a review of some spectroscopic issues and challenges. J. Process Control 21(10), 1467–1482.
Dang, L.,Yang, H.,Black, S., et al., 2009. The effect of temperature and solvent composition on transformation of -to -glycine as monitored in-situ by FBRM and PVM. Org. Process Res. Dev. 13(6), 1301–1306.
Efron, B., Tibshirani, R., 2004. Least angle regression. Ann. Stat. 32(2), 407–499.
Ferreira, A., Faria, N., Rocha, F., et al., 2011. Using an online image analysis technique to characterize sucrose crystal morphology during a crystallization run. Ind. Eng. Chem. Res. 50(11), 6990–7002.
Flusser, J., Suk, T., 1993. Pattern recognition by affine moment invariants. Pattern Recognit. 26(93), 167–174.
Gadelmawla, E.S., 2004. A vision system for surface roughness characterization using the gray level co-occurrence matrix. Ndt&EInt. 37(7), 577–588.
Gonzalez, R.C., Woods, R.E., Eddins, S.L., 2009. Digital Image Processing Using MATLAB. Gatesmark Publishing. He, K., Sun, J.,Tang, X., 2013. Guided image filtering. IEEETrans. Pattern Anal. Mach. Intell. 35(6), 1397–1409.
Hsu, C.W., Lin, C.J., 2002. A comparison of methods for multiclass support vector machines. IEEE Trans. Neural Netw. 13(2), 415–425.
Jain, A.K., Murty, M.N., Flynn, P.J., 1999. Data clustering: a review. ACM Comput. Surv. 31(2), 264–
323.
Jia, C.Y., Yin, Q.X., Zhang, M.J., et al., 2008. Polymorphic transformation of pravastatin sodium
monitored using combined online FBRM and PVM. Org. Process Res. Dev. 12(6), 1223–1228.
Larsen, P.A., Rawlings, J.B., Ferrier, N.J., 2006. An algorithm for analyzing noisy, in situ images of high-aspect-ratio crystals tomonitor particle size distribution. Chem. Eng. Sci. 61(16), 5236–5248. Larsen, P.A., Rawlings, J.B., Ferrier, N.J., 2007. Model-based object recognition to measure crystal size and shape distributions from insitu video images. Chem. Eng. Sci. 62(5), 1430–1441.
Lee, D.T., 1983. On finding the convex hull of a simple polygon. Int. J. Comput. Inf. Sci. 12(2), 87–
98.
Li, C.H., Lee, C.K., 1993. Minimum cross entropy thresholding. Pattern Recognit. 26 (93), 617–625. Lu, J., Plataniotis, K.N., Venetsanopoulos, A.N., et al., 2005. An efficient kernel discriminant analysis method. Pattern Recognit. 38(10), 1788–1790.
Mallat, S.G., 1989. A theory for multi resolution signal decomposition: the wavelet representation. IEEE Trans. Pattern Anal. Mach. Intell. 11(7), 674–693.
Monnier, O., Fevotte, G., Hoff, C., et al., 1997. Model identification of batch cooling crystallizations through calorimetry and image analysis. Chem. Eng. Sci. 52(7), 1125–1139.
Nagy, Z.K., Fevotte, G., Kramer, H., et al., 2013. Recent advances in the monitoring, modeling and control of crystallization systems. Chem. Eng. Res. Des. 91(10), 1903–1922.
Osher, S., Rudin, L.I., 1990. Feature-oriented image enhancement using shock filters. SIAM J. Numer. Anal. 27(4), 919–940.
Pourghahramani, P., Forssberg, E., 2005. Review of applied particle shape descriptors and produced particle shapes in grinding environments. PartI: particle shape descriptors. Miner. Process. Extr. Metall. Rev. 26(2), 145–166.
Presles, B., Debayle, J., Févotte, G., et al., 2010.Novel image analysis method for in situ monitoring the particle size distribution of batch crystallization processes. J. Electron. Imaging 19(3), 409–421. Qiao, N., Li, M.Z., Schlindwein, W., et al., 2011. Pharmaceutical cocrystals: an overview. Int. J. Pharm. 419(1–2), 1–11.
Sha, J.M., Liu, Z., Pang, S., 2012. The application of multi-scale retinex algorithm in infrared image enhancement for air-to-ground guided missile. J. Proj. Rocket. Missiles Guid. 32(1), 3–6.
Simon, L.L., Pataki, H., Marosi, G., et al., 2015. Assessment of recent process analytical technology (PAT) trends: a multi author review. Org. Process Res. Dev. 19 (1), 3–62.
Simone, E., Saleemi, A.N., Nagy, Z.K., 2015. In situ monitoring of polymorphic transformations using a composite sensor array of Raman, NIR, and ATR-UV/vis spectroscopy, FBRM, and PVM for an intelligent decision support system. Org. Process Res. Dev. 19(1), 167–177.
Tabatabai, A.J., Mitchell, O.R., 1984. Edge location to subpixel values in digital imagery. IEEE Trans. Pattern Anal. Mach. Intell. 6(2), 188–201.
Wang, W., 2006. Image analysis of particles by modified ferret method: best-fit rectangle. Powder Technol. 165(1), 1–10.
Wang, X.Z., Calderon De Anda, J., Roberts, K.J., 2007. Real-time measurement of the growth rates of individual crystal facets using imaging and image analysis: a feasibility study on needle-shaped crystals of L-glutamic acid. Chem. Eng. Res. Des. 85(7), 921–927.
Wang, X.Z., Roberts, K.J., Ma, C.Y., 2008. Crystal growth measurement using 2D and 3D imaging and the perspectives for shape control. Chem. Eng. Sci. 63(5), 1173–1184.
Watson, G.A., 1999. Least squares fitting of circles and ellipses to measured data. BIT Numer. Math. 39(1), 176–191.
Wilkinson, M.J., Jennings, K.H., Hardy, M., 2000. Non-invasive video imaging for interrogating pharmaceutical crystallization processes. Microsc. Microanal. 6, 996–997.
Yu, Z.Q., Chew, J.W., Chow, P.S., et al., 2007. Recent advances in crystallization control an industrial perspective. Chem. Eng. Res. Des. 85(7), 893–905.
Zhang, B., Abbas, A., Romagnoli, J.A., 2011. Multi-resolution fuzzy clustering approach for image-based particle characterization for particle systems. Chemom. Intell. Lab. Syst. 107(1), 155– 164.
Zhang, B., Willis, R., Romagnoli, J.A., et al., 2014. Image-based multi resolution-ANN approach for online particle size characterization. Ind. Eng. Chem. Res. 53(17), 7008–7018.
Zhang, R., Ma, C.Y., Liu, J., et al., 2015. On-line measurement of the real size and shape of crystals in stirred tank crystalliser using non-invasive stereovision imaging. Chem. Eng. Sci. 137(10), 9–21. Zhou, Y., Srinivasan, R., Lakshminarayanan, S., 2009. Critical evaluation of image processing
approaches for real-time crystal size measurements. Comput. Chem. Eng. 33(5), 1022–1035.
Zhou, Y., Lakshminarayanan, S.,Srinivasan, R., 2011. Optimization of image processing parameters for large sets of in-process video microscopy images acquired from batch crystallization processes:
Table 1 Crystal size feature
Size feature Description
Length Length pixel number of the best-fit rectangle for the particle shape
Width Width pixel number of the best-fit rectangle for the particle shape
Area Number of all pixel points within the particle image
[image:26.595.48.535.207.353.2]Perimeter Number of the particle edge pixel points with the freeman chain code of eight directions
Table 2 Crystal shape feature
Shape feature Description
Circularity degree The degree of particle shape closing to circle
Rectangle degree The ratio of a particle area over its best fitting rectangle area
Elongation ratio The ratio between the length and width of a particle
Concave-convex degree The ratio of a particle area over its minimum convex hull area
Eccentricity The ratio of the distance between ellipsoid foci over the semi-major axis of ellipsoid
Fourier descriptors Fourier transform coefficients of the particle shape contour
Geometric moments Seven Hu moment invariants in the particle shape
Inner distance descriptor Defined by Eq. (24)
Table 3 Crystal texture feature
Texture feature Description
[image:26.595.63.542.538.608.2]Contrast The clarity and grooving depth of texture from GLCM Energy The quadratic sum of each element value from GLCM Entropy The random measure of containing information from GLCM Fractal dimension Geometrical texture feature with Box-counting dimension
Table 4 Verification results for pixel equivalent calibration
No. Real size (µm) Measured size (µm) Error (%)
1 250 245.74 -1.70
2 170 172.91 1.71
[image:26.595.49.545.662.753.2]3 120 122.45 2.04
Table 5 Recognition Rate for LGA crystallization
Particle type Real number Total identified
number Correctly identified number Recognition Rate
Alpha type 38 40 37 0.97
Beta type 52 52 51 0.98
others 10 8 8 0.80
Figure 1. Schematic diagram of crystal morphology analysis
Start
End Image compression
Image filtering
Image enhancement
[image:27.595.112.485.59.244.2]Image segmentation
[image:27.595.240.357.347.567.2]Figure 4. Two-dimensional edge model: (a) the approximate edge model of operator input; and (b)
the ideal edge model
[image:30.595.68.507.66.287.2] [image:30.595.233.361.392.559.2]a
[image:32.595.128.469.69.545.2]b
Figure 7. Experimental set-up of the crystallizer equipped with the non-invasive imaging system:
(a) schematic diagram; and (b) external view
a b c
Figure 8. Subpixel edge detection: (a) original image; (b) gray-scale image; (c) edge detection
[image:32.595.110.485.600.728.2]a b
c d
[image:33.595.78.520.63.679.2]e f
Figure 9. LGA image processing: (a) original micrograph image; (b) compressed image; (c)
a b c
Figure 10. Comparison of image processing results: (a) the proposed method; (b) multi-scale
method; and (c) IA method
a b
Figure 11. Measurement results: (a) lengths of valid crystals and (b) widths of valid crystals
[image:34.595.66.533.65.206.2] [image:34.595.64.534.345.554.2]a b c
Figure 12. Measurement results for a gray image: (a) original image; (b) lengths of valid crystals
and (c) widths of valid crystals
a b
[image:35.595.67.534.64.206.2] [image:35.595.143.455.333.477.2]