room-temperature multiferroics.
White Rose Research Online URL for this paper: http://eprints.whiterose.ac.uk/94549/
Version: Accepted Version
Article:
Henrichs, L, Cespedes, O, Bennett, J et al. (10 more authors) (2016) Multiferroic clusters: a new perspective for relaxor-type room-temperature multiferroics. Advanced Functional Materials, 26 (13). pp. 2111-2121. ISSN 1616-301X
https://doi.org/10.1002/adfm.201503335
[email protected] https://eprints.whiterose.ac.uk/ Reuse
Unless indicated otherwise, fulltext items are protected by copyright with all rights reserved. The copyright exception in section 29 of the Copyright, Designs and Patents Act 1988 allows the making of a single copy solely for the purpose of non-commercial research or private study within the limits of fair dealing. The publisher or other rights-holder may allow further reproduction and re-use of this version - refer to the White Rose Research Online record for this item. Where records identify the publisher as the copyright holder, users can verify any specific terms of use on the publisher’s website.
Takedown
If you consider content in White Rose Research Online to be in breach of UK law, please notify us by
1 DOI: 10.1002/ ((please add manuscript number)) Article type: Full Paper
Title: Multiferroic clusters: a new perspective for relaxor-type room-temperature
multiferroics
Leonard F. Henrichs*, Oscar Cespedes, James Bennett, Joachim Landers, Soma Salamon, Christian Heuser, Thomas Hansen, Tim Helbig, Oliver Gutfleisch, Doru C. Lupascu, Heiko Wende, Wolfgang Kleemann, and Andrew J. Bell
Dedication: For Jule, Jesper and Oscar
L. F. H., Dr. J. B., Prof. A. J. B.
University of Leeds, Institute for Materials Research, Engineering Building, LS2 9JT Leeds, United Kingdom
E-mail: [email protected] Dr. O.C.
University of Leeds, School of Physics and Astronomy, E. C. Stoner Laboratory, LS2 9JT
Leeds, United Kingdom
J. L., S.S., Dr. A. H., Prof. H.W., Prof. W.K.
University of Essen, Faculty of Physics and Center for Nanointegration Duisburg-Essen (CENIDE), Lotharstr. 1, 47048 Duisburg, Germany
Dr. T.Hansen.
2 T.Helbig., Prof. O.G.
Technical University of Darmstadt, Materials Science and Earth Science, Alarich-Weiss-Straße 16, 64287 Darmstadt, Germany
Prof. D.C.L.
University of Duisburg-Essen, Institute for Materials Science and Center for Nanointegration
Duisburg-Essen (CENIDE), Universitätsstr. 15, 45141 Essen, Germany
Keywords: multiferroics, magnetoelectric, piezoresponse force microscopy, magnetic force
microscopy, multiferroic cluster
Abstract
Multiferroics are promising for sensor and memory applications, but despite all efforts invested in their research no single-phase material displaying both ferroelectricity and large
magnetization at room-temperature has hitherto been reported. This situation has substantially been improved in the novel relaxor ferroelectric single-phase
(BiFe0.9Co0.1O3)0.4-(Bi1/2K1/2TiO3)0.6, where polar nanoregions (PNR) transform into static-PNR (SPNR) as
evidenced by piezoresponse force microscopy (PFM) and simultaneously enable congruent multiferroic clusters (MFC) to emerge from inherent strongly magnetic Bi(Fe,Co)O3 rich
regions as verified by magnetic force microscopy (MFM) and secondary ion mass
spectrometry (SIMS). The material’s exceptionally large Néel temperature TN = 670 ± 10 K, as found by neutron diffraction, is proposed to be a consequence of ferrimagnetic order in
MFC.
On these MFC, exceptionally large direct and converse magnetoelectric coupling coefficients, ≈ 1.0 x 10⁻⁵ s/m at room-temperature, were measured by PFM and MFM respectively. We
3
to play a vital role in the strong ME coupling, by providing an electrically and mechanically flexible environment to MFC. This new class of non-ergodic relaxor multiferroics bears great potential for applications. Especially the prospect of a ME nanodot storage device seems
appealing.
1. Introduction
After a climax in research on multiferroics and magnetoelectrics in the 1970s followed by a
decline in the subsequent two decades, there has been a steep rise in the number of
publications in this area since 2000, which is still ongoing.[1, 2] Major fields for applications are in sensors and logical devices such as magnetic sensors[3, 4], magnetoelectric (ME) memory[5] and voltage-driven magnetic tunnel-junctions[6].
However, one of the major obstacles is that most single-phase multiferroics only exhibit ME
coupling well below room-temperature, which in combination with their relatively low coupling-coefficients between 10-11– 10-10 s/m,[1, 7] makes them unsuitable for practical devices so far. In recent years, substantial progress in finding room-temperature multiferroics
displaying strong ME coupling coefficients has been made.[8] For example, both in the solid solution perovskite (PbZr0.53Ti0.47O3)0.6–(PbFe1/2Ta1/2O3)0.4 (PZTFT) and in certain Aurivillius
phases, strong ME coupling has been observed using PFM under magnetic field.[9, 10]
However, demand for further research on single-phase materials remains unabated, for them to become promising candidates for technical applications.
In contrast, composite multiferroics, which consist of separated ferroelectric (FE) and
ferromagnetic (FM) phases, exhibit much higher coupling-coefficients, which are in the order
single-4
phase materials and composites cannot be easily compared to each other. In order to permit such an analogy the ME coupling-coefficient for composites is usually defined as an AC effect with low AC fields and frequencies between 100 Hz and 1 MHz[1] in contrast to the static effect of single-phase multiferroics.
Certainly the most intensely investigated multiferroic material is BiFeO3, which is
ferroelectric (TC ≈ 1100 K) and weakly ferromagnetic at room-temperature in thin-film form,
whereas for bulk single crystals the weak ferromagnetism is supressed by a cycloidal spin-superstructure.[8, 12] In recent years, tremendous effort has been spent on enhancing its multiferroic properties by modifying it structurally or chemically. It was found, that the FE long-range order is reduced by adding Bi1/2K1/2TiO3 (TC ≈ 710 K) to the system and the
material, hence, becomes relaxor FE[13] due to quenched cationic charge disorder similarly as, e.g., in the archetypical relaxor PbMg1/3Nb2/3O3 and in solid solutions of BKT and LiNbO3,[14] while the magnetic properties are also changed as compared to pure BiFeO3.[15]
Here, we show for the first time that relaxor ferroelectrics exhibiting polar nanoregions (PNR) possess the ability to form congruent ferroelectric and magnetic regions, which we will refer
to as multiferroic clusters (MFC), in the single-phase perovskite
(BiFe0.9Co0.1O3)0.4-(Bi1/2K1/2TiO3)0.6 (BFC-BKT). PNR transform into static-PNR (SPNR) below the freezing
temperature T 300°C which is characteristic for a non-ergodic relaxor state.[16] The
magnetization of the MFC probably arises from ferrimagnetic order, due to coupling of Fe3+- and Co3+- ions within inherent Fe and Co rich regions. As expected, giant direct and converse ME coupling, ≈ 1.0 x 10⁻⁵ s/m (corresponding to a voltage coefficient dE/dH ≈ 1.3
kV/(cm Oe)), is observed on MFC on the nano-scale using in-situ PFM under magnetic field and MFM in combination with tip induced poling.
5 2. Results
Polycrystalline, ceramic samples with average grain size of 1.8 m of the composition
(BiFe0.9Co0.1O3)0.4-(Bi1/2K1/2TiO3)0.6 (BFC-BKT) and density of approx. 6.52 g/cm3 were investigated. X-ray diffraction revealed that samples are phase pure and have a pseudo-cubic perovskite crystal-structure (see Figure S1). For every multiferroic or magnetoelectric
material, both dielectric and magnetic properties are essential. Therefore, these properties will be presented in the following sections before coming to results of ME coupling.
2.1. Electrical Characterisation
Polarization vs. electric field (P-E) loops, permittivity vs. temperature as well as PFM images are presented in Figure 1.
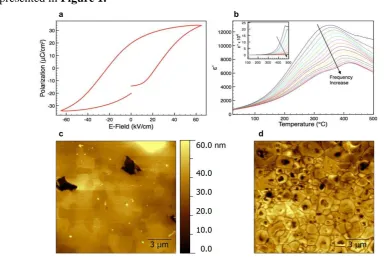
Figure 1. Electrical characterisation of BFC-BKT ceramics. a, Polarization vs. electric field loop
recorded within 1 s at room-temperature. b, Permittivity vs. temperature curves at logarithmically equidistant frequencies ranging from 1 kHz to 1 MHz. The inset shows an analogous plot of the imaginary part of permittivity. c, d, Topography and PFM image (X-amplitude) of a polished ceramic. A non-ergodic relaxor state is confirmed by frequency dispersion in b and by the presence of static-PNR which occur as dark and bright spots in d
[image:6.595.89.476.353.610.2]6
The material displays relaxor ferroelectric behaviour which is evident by the P-E-loop in Figure 1a and by the frequency dispersion of the relaxation peak between 350 to 400 °C in permittivity vs. temperature curves (Figure 1b). It should be noticed that relaxor-typical PNR
have been observed previously in BF-BKT.[13, 17] They are due to random electric fields emerging from the intrinsic cationic charge disorder and are supposed to freeze into a dipolar
cluster-glass state on cooling below the low-f peak temperature, Tm 300°C.[18]]
On the other hand, reasonably large external electric fields, |E| > 20 kV/cm (Figure 1a), suffice to break the glassy disorder and to align all dipolar moments at saturation. This picture
is supported by PFM images as shown in Figure 1d, which reveal the presence of SPNR visible as dark and bright spots in Figure 1d.[19] These are usually located in the center of a grain (compare topography in Figure 1c) and are separated by a dipolar ‘matrix’ exhibiting
low PFM response (corresponding to brown areas), which presumably contains the dynamic PNR. SPNR differ from regular domains, since these are adapted to the crystal lattice via ‘ordered’ fields and covalent bonds, while SPNR are stabilized by a local excess of a certain
component of random electric fields (‘random field fluctuation’).[20] 2.2. Magnetic phases
As mentioned previously, alongside dielectric properties, magnetic properties are key to
characterizing multiferroics. This is all the more true for perovskite single-phase multiferroics,
whose magnetic properties are usually much weaker than the ferroelectric. Here, the origin of magnetism is often questionable, since small amounts of magnetic secondary phases
7
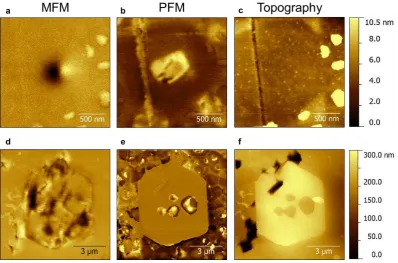
Using MFM, magnetic features with sizes ranging from 0.5-1.5 m were found. Figure 2a
[image:8.595.99.498.170.433.2]shows an example of such a feature, which exhibits a magnetic dipolar response, indicating magnetization along an in-plane orientation (see also Figure 6).
Figure 2. MFM and PFM images of a multiferroic cluster (top) and of a CoFe2O4 impurity phase particle (bottom). a,b MFM (phase) and PFM (X-amplitude) images respectively of the very
same area showing congruent ‘magnetic cluster’ and static-PNR with similar shape and size. This multiferroic cluster is not distinguishable from the rest of the material by topography (c). A typical CoFe2O4 particle in contrast, is only magnetic and not ferroelectric as evident by MFM (d) and PFM (e) images respectively, and can be clearly distinguished from the main perovskite phase in topography (f).
Most importantly, we found by PFM that for each magnetic feature there was an SPNR in the
very same location which had approx. the same size and shape. Due to their congruency, we will refer to them as multiferroic clusters (MFC) henceforth. It will be shown later that the magnetization of the MFC is switchable by magnetic fields, which means that they are in fact
8
is very important, since this has not yet been directly observed for a single-phase material to the best of our knowledge.
However, a magnetic impurity phase was also found in the form of micrometre sized particles
using MFM (see Figure 2d). Their chemical composition is most likely CoFe2O4 (see Figure S2) while their volume content is estimated to be below 1% according to SEM-EDX
maps. However, MFC are certainly not due to CoFe2O4 particles since they are multiferroic while CoFe2O4 particles lack any piezoelectric contrast and thus are clearly not ferroelectric as evidenced by the PFM image in Figure 2e, whereas the surrounding matrix is FE but not
FM (see Figure 2d and e).
Furthermore, the CoFe2O4 particles are considerably larger (approx. 6 m) than MFC (approx.
1 m) and can be easily distinguished from the rest of the material by AFM topography since they ‘stick out’ of the sample surface by several 100 nm (see Figure 2f), apparently due to a
lower polishing rate as compared to the rest of the material. In contrast, the MFC cannot be distinguished from the rest of the material by topography (see Figure 2c). Thus, we assume
that they have similar mechanical properties and perovskite crystal structure as the vast majority of the material, which is also supported by the fact that they are ferroelectric. Nevertheless, we will refer to the relaxor ferroelectric material that surrounds the MFC as ‘matrix’, although we expect it to have a very similar crystal structure as the MFC. We will
show later, how the chemical composition of MFC, CoFe2O4and matrix differ (see Figure 3).
Another fact that makes it extremely unlikely that the MFC are somehow connected to magnetic secondary phases, is that all MFC that were investigated had almost the same size
9
But what might be the nature of the MFC? We propose that they are ferrimagnetic due to
coupling of Fe3+- and Co3+-ions which would deliver a net magnetic moment of approx. 1 B per Fe-Co pair. This agrees with recent neutron diffraction data of Sosnowska et al.[21] on BiFe0.8Co0.2O3 which confirm a ferrimagnetic G-type spin arrangement. Furthermore, we presume the MFC to originate from an increased local concentration of the BFC component which seems to form chemical clusters. In the same area, an SPNR forms as an ‘island’ of
long range FE order within a matrix of disordered PNR, because the BFC component is the one which establishes long range FE order. In contrast, BKT is the component which tends to
induce relaxor properties in the system (BiFeO3)x-(Bi1/2K1/2TiO3)1-x.[13, 22]
Although a higher local concentration of Fe and Co is expected to be the origin of the MFC,
we were not able to resolve it using SEM-EDX analysis, probably because of insufficient sensitivity of the technique (see Figure S3). Therefore, time-of-flight secondary ion mass
spectrometry (TOF-SIMS) was employed, which combines an extremely high elemental sensitivity (in the range of ppm and below) with high lateral resolution of down to 50 nm. It is widely used for the spatially resolved determination of dopant concentrations in
semiconductors.
Results of SIMS mapping with Bi ion bombardment and positive secondary ions, are
10
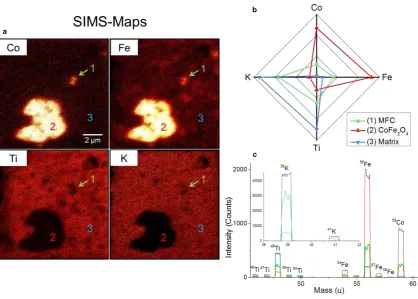
Figure 3. Secondary ion mass spectrometry (SIMS). a, Maps of elemental distribution according to
labels showing multiferroic cluster (MFC, 1), CoFe2O4 secondary phase particle (2) and matrix (3). Note that Bi signals could not be analysed since a Bi-ion beam was used as probe. Shape and size of the MFC are in good agreement with MFM and PFM measurements. b, Radar chart illustrating relative elemental intensities of the three areas according to mass spectra shown in c. As expected, the MFC has an increased Fe and Co content as compared to the matrix but lower K and Ti content. In comparison, the CoFe2O4 particle has a much higher Fe and Co content than the MFC.
All relevant elements could be unambiguously identified using their isotope pattern (see Figure 3c). Maps of elemental composition confirm the existence of Co and Fe rich regions as proposed above.
The maps (Figure 3a) show an area which contains an MFC (marked by green arrow, 1) and a CoFe2O4 secondary phase particle (2). As expected, the MFC exhibits a higher concentration
of Co and Fe, and lower concentration of K and Ti than the surrounding matrix as visible by bright and dark spots in the respective elemental maps. Note that dark spots occurring in all
11
shape of the MFC are in good agreement with MFM and PFM measurements. The large feature marked by 2 is identified as a CoFe2O4 particle by the very high content of Co and Fe
as compared to K and Ti and its much larger size of approx. 5 m typical for these particles
(see Figure 2). Note that Bi is not displayed in Figure 3, since a beam of Bi ions was used to analyse the sample surface which resulted in a homogeneous distribution of Bi across the whole area. Using the Bi ion beam was, however, necessary to achieve the necessary
resolution. The radar chart in Figure 3b shows relative elemental intensities of Fe, Co, K and Ti for MFC, CoFe2O4 particle and matrix according to mass spectra shown in Figure 3c (for
details of data processing see Supporting Information and Figure S5). In comparison to other areas, the CoFe2O4 particle almost exclusively contains Fe and Co, whereas the matrix contains mostly K and Ti. In contrast, the MFC contains all elements in medium
concentration in agreement with our expectations.
It is important to note, that for CoFe2O4 the intensities of Fe and Co have approx. the correct
ratio of 2:1 (measured 2.23:1) as expected from chemical composition. In SIMS, intensities for different elements usually cannot be directly related to elemental composition due to their different ionization probabilities causing different sensitivity factors for different elements. K
as an alkali metal, which is easily ionized, has for example much higher intensities than other elements. However, this is not the case for Fe and Co which have very similar ionization
energies (762.5 and 760.4 kJ/mol respectively)[23] and relative sensitivity factors in mass spectrometry.[24] In case of the MFC, the measured ratio of Fe to Co signals is 2.5:1 which is close to the ratio as in CoFe2O4. Taking into account the lower K and Ti concentration as
12
SIMS experiments furthermore exclude, that the MFC as imaged by MFM are due to deeper lying magnetic particles, since SIMS is very surface sensitive (1-2 nm penetration depth). After the two different magnetic phases had been characterized on a microscopic level, we
also tried to distinguish them on a macroscopic level. To this end, magnetic properties as function of temperature were carefully analysed as illustrated in Figure 4.
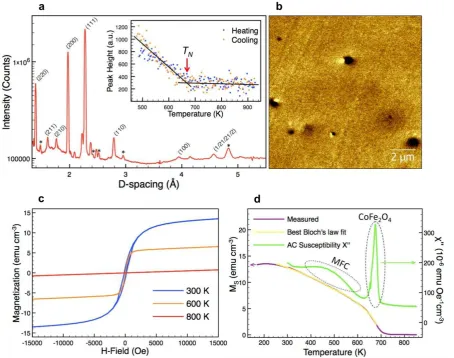
Figure 4. Magnetic characterisation of BFC-BKT ceramics. a, Neutron diffraction pattern of
polycristalline ceramic at room-temperature (logarithmic intensity scale). Peak height of magnetic (½½½) peak vs. temperature (inset) indicates TN = 670 ± 10 K. This extremely high TN might be attributed to MFC. Peaks due to CoFe2O4 phase are marked by *. b, MFM phase image showing typical MFC. c, Magnetization vs. magnetic field (M-H) loops T = 300, 600 and 800 K.
[image:13.595.73.528.223.581.2]13
Neutron diffraction experiments confirm antiferromagnetic order along the (111) pseudocubic crystallographic direction of the BFC-BKT component, as evidenced by the presence of a magnetic (½½½) peak at approx. 4.58 Å, which is twice the d-spacing of the pseudocubic
(111) nuclear peak at approx. 2.29 Å similar as in the related (BiFeO3)x-(Bi1/2K1/2TiO3)1-x.[15] It is very important to note, that this magnetic peak is due to BFC-BKT and not caused by the
CoFe2O4 impurity phase, which does not exhibit a Bragg reflection at this position. What is more important, the TN = 670 ± 10 K (see inset Figure 4a) is even higher than the
exceptionally large TN of pure BiFeO3 (650 K) although a much lower TN (below 490 K)
would be expected according to the substantially smaller Fe content in BFC-BKT as compared to pure BiFeO3 (as known from BiFeO3 based solid solutions). [15, 25, 26] Even the increased amount of Fe in the MFC, as found by SIMS, could not account for the large TN on its own. Likewise, it is not expected that adding Co would result in a higher TN since the TN of BiCoO3 is approx. 470 K.[27] Thus, the unusually large TN emphasizes the extraordinary magnetic properties of BFC-BKT and indicates a fundamental difference to BiFeO3 regarding the properties governing the magnetic transition temperature. This difference might be due to
ferrimagnetic coupling in MFC between Fe and Co as proposed above, hence we assign the magnetic peak to the MFC. In that case, one would have to speak of a Curie instead of Néel temperature. The low intensity of the magnetic peak reflects the fact that MFC only occupy a small fraction of the sample’s volume. However, a ferromagnetic contribution to the (111)
peak, as expected for ferrimagnetism, was not observed, which we attribute to the fact that the
ferromagnetic contribution is too small to be observed superimposed to the very intense nuclear (111) peak.
14
12.3 emu cm-3. The spontaneous magnetization, MS ≈ 2M(25 kOe)-M(50 kOe) vs. T (Figure 4c), decreases above approx. 200 K, follows the best-fitted Equation (1) between 250 and 680 K, and shows a Curie transition to a paramagnetic state at TC ≈ 704±2 K (for details of
measurement of MS see Supporting Information). The imaginary part of the AC-susceptibility
( ) is sensitive to magnetic energy dissipation and thus phase transitions. It exhibits two
distinctly different peaks (Figure 4c) and thus indicates two magnetic contributions as
expected from previous experiments. The broad peak with center at 471.8 K has a signature that differs significantly from the sharp peak at 673.7 K indicating two magnetic contributions as expected. Hence, we fitted the MS vs. T curve by a function containing two Bloch’s Law
terms corresponding to two magnetic phases:
(1)
with i(0) = volume-magnetization of contribution i at 0 K, i= critical exponent of contribution i
15
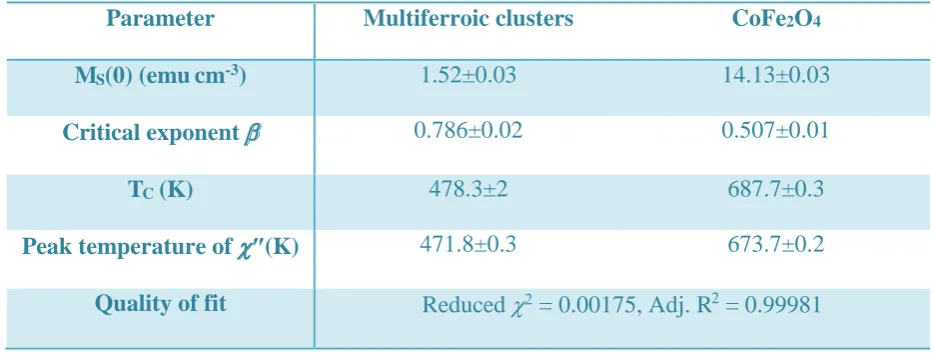
Parameter Multiferroic clusters CoFe2O4
MS(0) (emucm-3) 1.52±0.03 14.13±0.03
Critical exponent 0.786±0.02 0.507±0.01
TC (K) 478.3±2 687.7±0.3
Peak temperature of (K) 471.8±0.3 673.7±0.2
[image:16.595.62.529.108.286.2]Quality of fit Reduced = 0.00175, Adj. R2 = 0.99981
Table 1. Fitting parameters of Bloch’s law fit according to Equation (1). Curie temperatures of the
fits are in good agreement with measured centers of peaks in imaginary AC susceptibility .
The above function fits the MS vs. T curve very well and Curie temperatures obtained from
fitting are in good agreement with maxima of peaks in (471.8 K vs. 478.3 K and 673.7 K
vs. 687.7 K). These temperatures might be interpreted as average Curie temperatures of a
given magnetic phase. The relatively small discrepancies in measured and fitted Curie temperatures can be readily explained by different temperature sweep rates used in DC and AC measurements (i.e. sample’s temperature lagging the sensor) and/or the field dependence
of TC (MS measured at 25 and 50 kOe while at 10 Oe).
We attribute the sharp peak in to CoFe2O4 and the broad peak to the MFC, mainly due to
the different peak shapes. While we expect a sharp peak and critical exponent close to 0.5 for a classical magnetic material like CoFe2O4, the cluster nature of the MFC supposedly causes a
broader peak shape and larger critical exponent due to percolation statistics (see Supporting Information for detailed explanation). This is in line with Neutron diffraction, since TN is well
16
Although, the macroscopic MS of the sample is presumably dominated by the CoFe2O4 phase (see Table 1), the contribution of the MFC (approx. 10%) cannot be neglected, since the MS vs. T curve is fitted much less accurately by just one Bloch’s law term. However, it will be shown
in the following paragraphs, that the MFC show strong local ME coupling, which is not influenced by the secondary phase.
2.3. Converse Magnetoelectric Coupling
After elucidation of the material’s magnetic properties, we started to investigate ME coupling
17
Figure 5. MFM measurements in combination with electric field poling. a, 3D representation of
the same MFC as in Figure 2. c,d,e, MFM images of the MFC as in a, before (c) and after ex-situ switching with out-of-plane magnetic fields of ±0.48 T (d,e) as indicated by blue arrows. Symbols above images, represent single magnetic domains according to the dipolar magnetic MFM response. g,h, PFM images of MFC recorded after ex-situ magnetic switching, before (g) and after (h) electric poling by scanning a rectangular area as indicated by red dashed rectangle while applying a DC bias. Configurations of MFC’s polarization are illustrated by symbols below PFM images. f, MFM image after electric field poling, showing ME switching (compare
e). b, MFM phase cross-sections of MFC before and after ME switching across the blue and red
[image:18.595.81.524.82.562.2]18
As mentioned earlier, the MFC exhibits a magnetic dipolar response as for a single domain particle, with an in-plane orientation of the magnetization as illustrated above the image.[28] Using ex-situ magnetic fields which were applied outside the sample environment of the
atomic force-microscope, we switched the MFC (Figure 5d and e), and thus proved that it is in fact magnetic and not an imaging artifact. More importantly, we were able to switch the
MFC by poling it with an electric field. Figure 5g and h show the dielectric structure of the MFC before and after poling, by scanning a rectangular area around it as indicated by the red dashed rectangle while applying a DC voltage of 20 V. For imaging an AC voltage of 2 V was applied. After electric poling, the MFC’s magnetization was switched from a complete
out-of-plane (Figure 5e) to a partly in-out-of-plane (Figure 5f) orientation as indicated by symbols. This
experiment could be reproduced very accurately. For a discussion of possible artifacts, see Supporting Information.
2.4. Direct Magnetoelectric Coupling
19
Figure 6. In-situ PFM under magnetic field experiments. a,b Selected out-of-plane PFM images
[image:20.595.72.517.82.545.2]20
Figure 6 shows selected out-of-plane in-situ PFM images under magnetic field. In total 21 PFM images constituting a complete magnetic field loop with 0, ±375 and 75 Oe as starting-point, magnetic field range and step-size respectively, were recorded. Images in row a clearly
display a magnetic field-induced change of an MFC, in the top right corners of the images. The direction of magnetic field, relative to the sample surface is indicated by blue arrows
beside the PFM images. Other regions exhibiting strong ME switching are marked by blue rectangles.
By taking the average PFM-signal of a highly ME active region marked by red rectangles in
row b, the change of out-of-plane polarization of this area as a function of magnetic field can
be obtained which is shown in Figure 6c (for calculation of P/PS from PFM signals see
below). This plot reveals a large change of polarization over a relatively small magnetic field
range. The curve exhibits a V-like shape, where the polarization varies roughly linearly with magnetic field but, regardless of its direction.
If we consider that the underlying ME coupling mechanism is linear and intrinsic, the V-shape of the curve might be explained by the fact that the MFC exhibits a low magnetic coercivity. Thus, the linear ME coupling coefficient might change its sign at low fields when inverting
the magnetic field direction.
The curve shape might also be explained by a stress-strain-mediated ME coupling mechanism,
via magnetostriction and piezoelectricity. Many magnetostrictive materials such as ferrite spinels or metal alloys exhibit such a V-shape magnetostriction curve.[3] The resultant magnetostrictive strain in turn would be coupled to polarization linearly via the piezoelectric
effect and thus would explain the observed shape of the curve.
Furthermore, strong sporadic switching events were observed (see green dot in Figure 6c).
21
PFM with ex-situ magnetic fields in multiferroic (PbZr0.53Ti0.47O3)0.6–(PbFe0.5Ta0.5O3)0.4. The
authors attributed this behaviour to sudden releases of elastic energy.
Since the ME response appears to be roughly linear within the experiment’s uncertainty in a
small range of magnetic fields and for the sake of quantifying the effect in a comparable way, we will estimate the linear ME coupling-coefficient for a limited range of magnetic fields,
although the coupling is clearly non-linear over the whole range of magnetic fields tested in this experiment. The direct linear ME coupling-coefficient can be expressed as[2]
(2)
with Pi = electrical polarization and Hj = magnetic field components, respectively.
To estimate the change of polarization over a range of magnetic fields, PFM signals need to
be quantified. A calibration factor KBFC connecting PFM signals to a polarization change for BFC-BKT can be obtained by using a standard calibration sample, periodically poled lithium niobate (PPLN) together with macroscopic piezoelectric d33 coefficients (for details and
discussion of the calibration see Supplementary Information).
KBFC can be used to estimate the ME coupling-coefficient as follows:
(3)
where Ps is 33.9 C/cm2 and is obtained from a macroscopic P-E-loop (see Fig. 1a)
measurement and m/KBFC = 0.123 %/Oe is the slope of the linear fit to the orange data points in Figure 6c (inset) and corresponds to the change of polarization with magnetic field.
22
Evans et al.[10] and five orders larger than the macroscopic effect obtained on (BiFeO3)0.6– (Na0.5Bi0.5TiO3)0.4.[26]
Nevertheless, we want to stress that the calculated value is an estimate of the order of
magnitude rather than an exact determination of the ME coefficient. It is, however, intuitive that the coefficient should be large, since relatively small magnetic fields (375 Oe at most)
result in considerable switching of the MFC, which should be due to an extremely large ME coupling coefficient.
The strong ME coupling correlates well with the fact that MFC exhibit both ferroelectric and
presumably ferrimagnetic order. Another reason for the exceptionally large ME coupling, might be the dielectrically flexible matrix, surrounding the MFC. The dynamic and flexible PNR might facilitate ME reorientation of the MFC’s polarization by accommodating strain
due to the reorientation process, which effectively reduces clamping of the MFC. In case of a large scale single domain multiferroic material, this might not be possible.
We will also try to compare the direct to the converse ME coefficient from the experiment
presented in Figure 5. The converse linear ME coupling-coefficient c can be expressed as following:
(4)
with 0 = vacuum-permeability, Mi = volume-magnetization, and Ej = electric field components.
Based on the magnitude of MFM signals, we can assume that the magnetization is reasonably
large. Numerical values for 0M and P for the MFC from Figure 5 and Figure 6 (marked by red rectangle), respectively, are expected to be similar when converted to SI-units although P
23
coefficient due to the large reorientation of approx. 46.8% of the MFC’s magnetic moment
upon application of electric field. The reorientation can be estimated from the MFM cross section through the MFC (Figure 5b) by comparing the relative heights of signals
corresponding to bright and dark areas. This reorientation is almost identical as compared to that of the polarization displayed in Figure 5c over a change of magnetic field of 375 Oe.
Therefore we expect a similar order of magnitude for the direct and converse ME coupling coefficients.
3. Conclusions
We could show that inherent multiferroic clusters (MFC) exist in BFC-BKT which are ferroelectric and strongly magnetic as observed by PFM and MFM respectively. Although
exact co-location of the magnetic and ferroelectric properties has not been proven absolutely, it is far more probable to assume that the MFC are true single phase multiferroic regions than a coincidental juxtaposition of separate magnetic and ferroelectric nano-regions, as supported
by the very similar size and shape of all investigated MFC (see Figure S4) and by neutron diffraction experiments.We presume that their substantial magnetization is due to
ferrimagnetism from antiparallel alignment of Fe and Co spins. This scenario is far more likely than e.g. ferromagnetic order, since this would require a different magnetic exchange mechanism than the superexchange mechanism (e.g. as in LSMO), which has so far not been
observed for any ferroelectric material. Furthermore, nano-sized Fe and Co rich clusters, as required for ferrimagnetism, were observed by SIMS microscopy. Another indication of the
materials exceptional magnetic properties is its extremely high Néel (Curie) temperature TN = 670 ± 10 K which might be assigned to the MFC. . At the same time, the non-ergodic relaxor
24
we propose that formation of MFC is governed by the ferrimagnetic BFC component and the relaxor-state inducing BKT component which presumably also improves the dielectric
properties of the solid solution. However, the relaxor nature does not only enable formation of
MFC, but is also expected to be partly responsible for the exceptionally large ME coupling. Dynamic PNR surrounding the MFC form a dielectrically and mechanically flexible
environment, which presumably facilitates reorientation of the MFC’s polarisation by
accommodating strain. Thus, clamping of MFC is effectively reduced.A caveat is the
formation of small amounts of CoFe2O4 secondary phase which should be eliminated in future
work. We were able to distinguish magnetic contributions due to MFC and CoFe2O4 by carefully analysing DC and AC magnetometry data, as a function of temperature. This
approach should be also applicable to other single-phase multiferroics where magnetic secondary phases usually pose a problem for magnetic characterisation. We can exclude without doubt that CoFe2O4 particles were erroneously regarded as MFC, nor did CoFe2O4
particles exhibit the observed local ME coupling effects.
We expect our findings to spark significant new research in this new class of non-ergodic
relaxor multiferroics, also on thin film, single crystal or oriented ceramic materials, especially since the material is lead free and consists only of abundant elements. Compositions closer to the one estimated for the MFC, (BiFe0.7Co0.3O3)0.6-0.8-(Bi1/2K1/2TiO3)0.4-0.2, might be ideal
starting points for such experiments. Since the ME coupling is restricted to well-separated magnetic regions, applications of electrically addressable magnetic MFC might be envisaged
for future ME random access memory devices (MERAM)[5] based on BFC-BKT thin films. They are suitable for fulfilling the dream of an electrically controlled magnetic nanodot
25
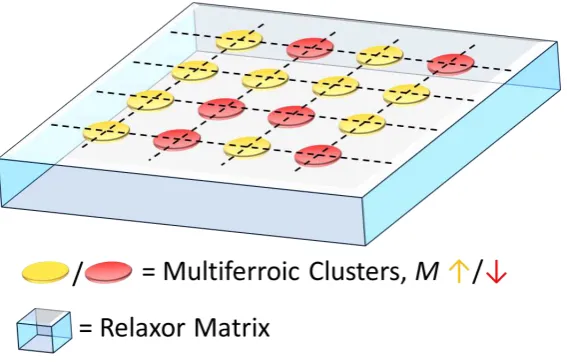
Figure 7. Schematic illustration of a possible ME memory device. An epitaxial BFC-BKT thin-film
might be engineered to contain an array of multiferroic clusters within a relaxor ferroelectric matrix. Information is stored in an electrically controlled magnetic bit, adressable e.g. via a cross-bar system.
4. Experimental Details
BFC-BKT ceramic pellets were prepared analogously to [30]. As starting materials Bi2O3, Fe2O3, TiO2, CoO (all Sigma Aldrich) and K2CO3 (Alfa-Aesar) (all 99.9% purity) were mixed in appropriate proportions and a Dynomill Typ KDLA by Willy A Bachofen was used for
milling. Pellets were sintered at 1065 °C for 2 hours.
For electrical testing, silver electrodes were applied onto coarsely polished samples at 550 °C using silver paint. P-E-loops and permittivity vs. temperature measurements were carried out
on a Radiant Precision 10kV HVI II and a HP 4284 A Precision LCR Meter in junction with a tube furnace respectively.
For magnetic measurements and X-ray diffraction, the powder of sintered and crushed pellets was used and measurements were carried out on a SQUID-VSM (MPMS 3) by Quantum Design using the VSM oven option and a Phillips X’PERT respectively.
26
achieved by polishing in several steps using various polishing-cloths in combination with diamond abrasive-liquids where the diamond particle-size was gradually reduced for
consecutive steps, until a final polishing step involving 200 nm sized colloidal silica particles
was reached.
PFM and MFM experiments were carried out on a 5420 AFM by Agilent Technologies with
the MAC Mode III extension.
For PFM experiments, DCP11 conductive-diamond coated tips by NT-MDT were used. The tip was electrically grounded whilst a ‘bottom-electrode’ underneath the sample and in
electrical contact with it, was biased. All PFM imaging was carried out at a frequency of 70 kHz of the AC voltage.
To avoid distortions by an inherent background-signal,[31] X-amplitude (often referred to as mixed signal) was recorded instead of R-amplitude (often referred to as amplitude) and Phase, while Y-amplitude was minimized by applying a phase-shift between reference and measured
signal electronically.
Magnetic fields for in-situ under magnetic field PFM experiments were generated by the
Magnetic Lateral Field Module 5420 by ScienTec with magnetic fields of up to ±750 Oe. PPP-MFMR AFM tips by Nanosensors were used for MFM experiments in a constant frequency mode. Additional MFM measurements were carried out on an AttoMFM I by
Attocube. A TOF.SIMS 5 by ION-TOF was used for SIMS measurements.
For neutron diffraction experiments, the two-axis diffractometer D20 at ILL (Grenoble,
France) was used.[32] The wavelength of neutrons was 2.41 Å using an HOPG (002)
monochromator in reflection, at 42° take-off angle, while a position sensitive detector (PSD),
covering a continuous 2 range of 153.6° over a total solid angle of 0.27 sr, was used.
27
Supporting Information is available from the Wiley Online Library or from the author.
Acknowledgements
L. F. H acknowledges project funding by the European Commission through the ITN NANOMOTION (PITN-GA-2011-290158).
Furthermore, he wishes to express his gratitude to E. Soergel and V. Shvartsman for many fruitful discussions and to M. Fenner from Keysight Technologies (formerly Agilent Technologies) for technical support.
L. F. H. thanks Philippa M. Shepley for Magneto-optical Kerr measurements.
Processing of AFM-images was done using the free AFM software ‘Gwyddion’[33] for which excellent user support by D. N is gratefully acknowledged.
O.C. acknowledges grant EP/K00512X/1 which enabled SQUID-VSM measurements. D. C. L. thanks the Deutsche Forschungsgemeinschaft (DFG) for partial support through Forschergruppe 1509, "Ferroische Funktionsmaterialien" (Lu729/12).
H. W., J.L. and S.S. thank the Deutsche Forschungsgemeinschaft (DFG) for partial support through Schwerpunktprogramm 1681, „Feldgesteuerte Partikel
-Matrix-Wechselwirkungen“ (WE2623/7-1) and Stiftung Mercator (MERCUR).
Received: ((will be filled in by the editorial staff))
Revised: ((will be filled in by the editorial staff)) Published online: ((will be filled in by the editorial staff))
References
[1] M. Fiebig, J. Phys. D: Appl. Phys. 2005, 38, R123.
28
[3] E. Lage, C. Kirchhof, V. Hrkac, L. Kienle, R. Jahns, R. Knöchel, E. Quandt, D. Meyners, Nat. Mater. 2012, 11, 523.
[4] C. Israel, N. D. Mathur, J. F. Scott, Nat. Mater. 2008, 7, 93.
[5] X. Chen, A. Hochstrat, P. Borisov, W. Kleemann, Appl. Phys. Lett. 2006, 89, 202508. [6] M. Gajek, M. Bibes, S. Fusil, K. Bouzehouane, J. Fontcuberta, A. Barthelemy, A. Fert, Nat Mater 2007, 6, 296.
[7] W. Eerenstein, N. D. Mathur, J. F. Scott, Nature 2006, 442, 759; N. Hur, S. Park, P. A. Sharma, J. S. Ahn, S. Guha, S. W. Cheong, Nature 2004, 429, 392; Y. Kitagawa, Y. Hiraoka, T. Honda, T. Ishikura, H. Nakamura, T. Kimura, Nat. Mater. 2010, 9, 797.
[8] J. F. Scott, NPG Asia Mater 2013, 5, e72.
[9] L. Keeney, T. Maity, M. Schmidt, A. Amann, N. Deepak, N. Petkov, S. Roy, M. E. Pemble, R. W. Whatmore, J. Am. Ceram. Soc. 2013, 96, 2339; D. M. Evans, M. Alexe, A. Schilling, A. Kumar, D. Sanchez, N. Ortega, R. S. Katiyar, J. F. Scott, J. M. Gregg, Adv. Mater. 2015, 27, 6068.
[10] D. M. Evans, A. Schilling, A. Kumar, D. Sanchez, N. Ortega, M. Arredondo, R. S. Katiyar, J. M. Gregg, J. F. Scott, Nat. Commun. 2013, 4, 1534.
[11] W. Eerenstein, M. Wiora, J. L. Prieto, J. F. Scott, N. D. Mathur, Nat. Mater. 2007, 6, 348; C. A. F. Vaz, J. Phys.: Condensed Matter 2012, 24, 333201.
[12] Y.-H. Chu, L. W. Martin, M. B. Holcomb, R. Ramesh, Mater. Today 2007, 10, 16. [13] H. Matsuo, Y. Noguchi, M. Miyayama, M. Suzuki, A. Watanabe, S. Sasabe, T. Ozaki, S. Mori, S. Torii, T. Kamiyama, J. Appl. Phys. 2010, 108.
[14] W. Zuo, R. Zuo, W. Zhao, Ceram. Int. 2013, 39, 725.
[15] J. Bennett, A. J. Bell, T. J. Stevenson, R. I. Smith, I. Sterianou, I. M. Reaney, T. P. Comyn, Mater. Lett. 2013, 94, 172.
[16] R. Dittmer, D. Gobeljic, W. Jo, V. V. Shvartsman, D. C. Lupascu, J. L. Jones, J. Rödel, J. Appl. Phys. 2014, 115.
[17] T. Ozaki, H. Matsuo, Y. Noguchi, M. Miyayama, S. Mori, Japanese Journal of Applied Physics 2010, 49, 09MC05.
[18] W. Kleemann, in Mesoscopic Phenomena in Multifunctional Materials, Vol. 198 (Eds: A. Saxena, A. Planes), Springer Berlin Heidelberg, 2014, 249.
[19] D. Gobeljic, R. Dittmer, J. Rödel, V. V. Shvartsman, D. C. Lupascu, J. Am. Ceram. Soc. 2014, 1.
[20] Y. Imry, S.-k. Ma, Phys. Rev. Lett. 1975, 35, 1399.
[21] I. Sosnowska, M. Azuma, R. Przeniosło, D. Wardecki, W.-t. Chen, K. Oka, Y. Shimakawa, Inorg. Chem. 2013, 52, 13269.
[22] M. I. Morozov, M.-A. Einarsrud, T. Grande, Appl. Phys. Lett. 2012, 101, 252904. [23] CRC Handbook of Chemistry and Physics, CRC Press, 2004.
[24] J. Pisonero, B. Fernandez, D. Gunther, J. Anal. At. Spectrom. 2009, 24, 1145. [25] R. Kiyanagi, T. Yamazaki, Y. Sakamoto, H. Kimura, Y. Noda, K. Ohyama, S. Torii, M. Yonemura, J. Zhang, T. Kamiyama, J. Phys. Soc. Jpn. 2012, 81, 024603.
[26] E. V. Ramana, A. Mahajan, M. P. F. Graça, A. Srinivas, M. A. Valente, J. Eur. Ceram. Soc. 2014, 34, 4201.
[27] A. A. Belik, S. Iikubo, K. Kodama, N. Igawa, S.-i. Shamoto, S. Niitaka, M. Azuma, Y. Shimakawa, M. Takano, F. Izumi, E. Takayama-Muromachi, Chem. Mater. 2006, 18, 798. [28] C. E. Diebel, R. Proksch, C. R. Green, P. Neilson, M. M. Walker, Nature 2000, 406, 299.
29
Varela, D. C. Stanley, M. Sinko, M. J. Pechan, D. J. Keavney, F. Peiró, S. Suriñach, M. D. Baró, J. Nogués, Nat Commun 2013, 4.
[30] T. P. Comyn, T. Stevenson, A. J. Bell, "Piezoelectric properties of BiFeO3-PbTiO3 ceramics", presented at Applications of Ferroelectrics, 2004. ISAF-04. 2004 14th IEEE International Symposium, 23-27 Aug. 2004, 2004.
[31] L. F. Henrichs, J. Bennett, A. J. Bell, Rev. Sci. Instrum. 2015, 86, 083707; T. Jungk, Á. Hoffmann, E. Soergel, Journal of Microscopy 2007, 227, 72; E. Soergel, J. Phys. D: Appl. Phys. 2011, 44, 464003.
[32] C. H. Thomas, F. H. Paul, E. F. Henry, T. Jacques, C. Pierre, Meas. Sci. Technol. 2008, 19, 034001.