City, University of London Institutional Repository
Citation
:
Beck, T., Demirguc-Kunt, A. and Maksimovic, V. (2008). Financing patterns
around the world: Are small firms different?. Journal of Financial Economics, 89(3), pp.
467-487. doi: 10.1016/j.jfineco.2007.10.005
This is the accepted version of the paper.
This version of the publication may differ from the final published
version.
Permanent repository link:
http://openaccess.city.ac.uk/13644/
Link to published version
:
http://dx.doi.org/10.1016/j.jfineco.2007.10.005
Copyright and reuse:
City Research Online aims to make research
outputs of City, University of London available to a wider audience.
Copyright and Moral Rights remain with the author(s) and/or copyright
holders. URLs from City Research Online may be freely distributed and
linked to.
Financing patterns around the world: are small firms
different?
Revised: June 2008
Abstract: Using a firm-level survey database covering 48 countries, we investigate how financial and institutional development affects financing of large and small firms. Our database is not limited to large firms, but includes small and medium firms and data on a broad spectrum of financing sources, including leasing, supplier, development and informal finance. Small firms and firms in countries with poor institutions use less external finance, especially bank finance. Protection of property rights increases external financing of small firms significantly more than of large firms, mainly due to its effect on bank finance. Small firms do not use disproportionately more leasing or trade finance compared to larger firms, so these financing sources do not compensate for lower access to bank financing of small firms. We also find that larger firms more easily expand external financing when they are constrained than small firms. Finally, we find suggestive evidence that the pecking order holds across countries.
1.Introduction
Recent papers studying financing patterns around the world emphasize the
importance of institutional differences across countries on capital structure
(Demirguc-Kunt and Maksimovic, 1999; Booth, Aivazian, Demirguc-(Demirguc-Kunt, and Maksimovic, 2001;
and Fan, Titman, and Twite, 2003). A related literature has also shown that access to
external financing is shaped by the country’s legal and financial environment (La Porta,
Lopez-de-Silanes, Shleifer, and Vishny, 1997, 1998; Demirguc-Kunt and Maksimovic,
1998; and Rajan and Zingales, 1998).1 A direct implication of these studies is that, in
countries with weak legal systems, and consequently, weak financial systems, firms
obtain less external financing which results in lower growth.
Due to data limitations, empirical results in the existing literature are based on
analysis of the largest, and perhaps unrepresentative, firms across countries. Also, the
definitions of external financing used in these studies focus on equity and external debt,
and they do not take into account the possibility that in some countries firms could
substitute other forms of financing, such as supplier credit or government financing.
In this paper we investigate whether the financing patterns of small firms differ
from those of the large firms that have been the focus of the prior literature. We also
explore the relation between firms’ external financing and a country’s financial and legal
institutions and consider a broader spectrum of external financing sources that are likely
to be more relevant for smaller firms. Finally, we assess whether the relation between
1 Carlin and Mayer (2003) argue that a relation exists between a country’s financial system and the
firms’ financing patterns and firm size varies across different levels of financial and
institutional development and if this varies with the level of financing constraints.
Better understanding the financing patterns of small firms and how they change
with institutional development has important policy and resource implications. Many
policymakers in governmental and international aid organizations believe that small firms
have inadequate access to external finance in developing countries as a result of market
imperfections. In response, significant resources are being channeled into the promotion
and financing of small and medium-size enterprises (SMEs) in developing countries.
For example, the World Bank Group lends more than $2 billion a year in SME support
programs.2 Significant renewed interest has also emerged in development banks, which
seek to provide loans that promote development by lending to constrained borrowers in
developing countries, particularly small firms. Understandinghow financing patterns of
small firms differ in different institutional environments is an important first step in
assessing these costly policies.
We address these issues using a firm level data source, the World Business
Environment Survey (WBES), a major cross-sectional firm survey conducted in
developed and developing countries in 1999 and led by the World Bank. The survey has
information on financing choices for close to three thousand firms in 48 countries.3 One
of the important strengths of the survey is its coverage of small and medium enterprises
(80% of the observations are from small and medium firms). Another advantage of the
2 The World Bank provides direct and indirect support to SMEs (see World Bank Group Review of Small
Business Activities, 2002). In terms of activities, 80% of World Bank programs involve direct financial assistance to SMEs, while the remaining 20% involve indirect support such as technical assistance for SMEs and for institutions that support SME development.
WBES is that it includes information on sources of financing that are often associated
with small-firm finance such as leasing, trade credit, and finance from government and
informal sources. Finally, the survey includes an indicator of the extent to which firms
consider themselves financially constrained. This allows us to identify constrained firms
without having to rely on proxies based on accounting data.
Our results show that, even after we control for various firm characteristics and
country and institutional variables, smaller firms finance a lower proportion of their
investment externally, particularly because they make use of bank finance to a lesser
extent. Further, small firms’ financing constraints are not as strongly associated with
external finance, suggesting that they are less likely and able to expand external financing
as they become more financially constrained compared with large firms. Investigating the
linkages between firm size and the impact of institutional development on financing
patterns, we see that small firms benefit disproportionally from higher levels of property
rights protection by using significantly more external finance, particularly from banks.
These results underline the importance of improving the institutional environment for
increasing the access of small firms to external finance.
We would expect that small firms, facing informational asymmetries in financial
markets, would substitute subsidized financing from government and financing from
sources that rely on personal or commercial relations, such as trade credit or informal
finance. We would also expect that such sources would be more significant in countries
with poorly functioning financial systems or weak property rights protection. 4
(2006) also use this data set. See Graham and Harvey (2001) for a recent application of the survey methodology to corporate finance.
Our findings only partially confirm the prior finding that small firms substitute
bank finance with other sources of external finance, especially in countries with
underdeveloped institutions and financial markets. We do find that small firms use
significantly more informal finance than large firms. However, financing from such
sources is limited. On average the proportion of investment financed using informal
finance is less than 2%. Thus, the use of informal financing does little to relax financial
constraints faced by small firms in developing economies. Moreover, we find that small
firms do not use disproportionately more leasing or trade finance compared with larger
firms. In particular, financing from leasing does not fill the financing gap of small firms
in countries with underdeveloped institutions because the use of leasing finance is
positively associated with the development of financial institutions and equity markets.
Surprisingly, small firms also do not finance their investment significantly more from
government sources or development banks despite the fact that such programs are often
politically justified as increasing financing for small firms. On the contrary, the
coefficient is often negative and significant in some specifications. Overall, these
findings point out the limits to small firms’ ability to compensate for the
underdevelopment of their countries’ financial and legal systems. In these countries, the
alternative sources of finance either do not significantly fill the gap or, in the case of
trade credit, are less prevalent.
While our data do not allow a rigorous testing of the pecking order theory, we
also provide some insights into this debate. We find a negative relation between the
proportion of firms in a country that report being financially constrained and the
proportion of firms that issue equity. This finding is consistent with the pecking order
theory of Myers and Majluf (1984) and suggests that the majority of firms become
constrained before they issue equity.
2. Financing patterns across the world
A number of studies have focused on cross-country comparisons of financing
patterns. Rajan and Zingales (1995) explore capital structure decisions of firms in seven
developed countries and find that variables commonly used to explain financial structure
in the US are also correlated with leverage in their sample of international firms. Booth,
Aivazian, Demirguc-Kunt, and Maksimovic (2001) consider financing choices in a
sample of ten developing countries and also show that financing decisions are affected by
the same variables as in developed countries. However, they also note large fixed effects
across countries, indicating that specific country factors are at work. Booth, Aivazian,
Demirguc-Kunt, and Maksimovic (2001) conclude that much remains to be done to
understand the impact of different institutional features on capital structure.
Demirguc-Kunt and Maksimovic (1999) examine capital structure in 30 developed and developing
countries and show that differences in financing patterns are mostly due to the differences
in the development of stock markets and banks, as well as differences in the underlying
legal infrastructure. Fan, Titman, and Twite (2003) study capital structure in 39 countries
and confirm earlier findings that institutional differences between countries are much
more important in determining capital structure choices of firms compared with other
In a related literature, Rajan and Zingales (1998) and Demirguc-Kunt and
Maksimovic (1998) both show a relation among the development of financial institutions,
external financing, and firm performance. Taken together, the implication of these
studies is that a country’s institutions affect financing patterns, with direct implications
on their performance and growth.
All these studies rely on databases of listed firms so that even the small firms in
their samples are relatively large.5 The studies also implicitly define external finance
narrowly, focusing on equity finance or long-term debt. Theory suggests that firms in
countries with strong legal systems, in which property rights and in particular the rights
of investors are enforced, are likely to rely on these types of external finance. In countries
with weaker property rights protection, we would expect substitute forms of external
finance, such as informal and supplier credit or development bank financing, to be used.
Thus, a narrow definition of external financing that does not take into account other
forms of financing might overstate both the constraints on external financing available to
firms in less developed countries and the importance of legal development for the
financing of firms in these countries.6 Also, while these sources are not normally
included in the US studies of external financing, variations in leasing, supplier, and
government financing could be important when assessing differences in countries’
5 Papers looking at industry-level growth rates, such as Rajan and Zingales (1998), include firms of all sizes
but do not distinguish between large and small firms as they are aggregated into industry data.
6 In some countries, these informal financial systems are prevalent and economically significant. For
financial systems.7 Looking at all available sources of external finance is especially
important when studying financing choices of small firms as we do in this paper.
We use firm-level survey data to investigate the proportion of investment firms
finance externally, focusing on the differences between small and large firms. We
investigate individual sources of finance, such as debt finance and equity, and other
available sources such as leasing, supplier, government, and informal finance. The
firm-level data are from the World Business Environment Survey (WBES). Information on
financing patterns is available for nearly three thousand firms in 48 countries.8
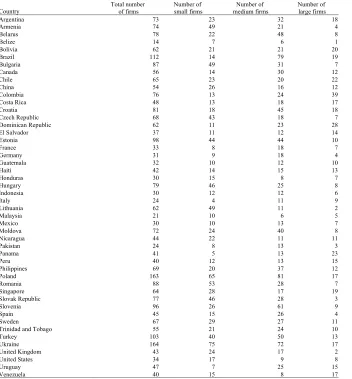
An important strength of the survey is its wide coverage of small and medium
firms. The survey covers three groups of firms. Small firms are defined as those with
five to 50 employees, medium firms are those that employ 51 to five hundred employees,
and large firms are those that employ more than five hundred employees. Forty percent
of our observations are from small firms, another 40% are from medium firms, and the
remaining 20% are from large firms. The sample is size-stratified for each country and
an effort is made to focus on small and medium firms. Thus, the survey data have a
selection bias because respondents are not necessarily a representative sample of firms
from their countries. However, analysis of mostly smaller firms does represent a nice
complement to earlier cross-country studies in the literature, which all inevitably include
a similar, but opposite, selection bias by focusing on the largest firms in their samples of
diverse countries. Table A1 in the Appendix reports the number of firms for each
country and for each size group in the sample.
7 Frank and Maksimovic (2001) argue that the equilibrium amount of trade finance relative to bank and
The survey data have several shortcomings. While they provide information on
complete financing patterns, financial information is limited.9 Financing patterns are
given in terms of proportions of investment, not as debt to asset ratios, as is common in
the previous literature. Furthermore, we do not have a complete set of firm level
variables to replicate the usual set of firm-level controls used in capital structure papers,
particularly profitability of firms. However, we do have information on firm
employment, sales, industry, growth, ownership, and whether the firm is an exporter or
has been receiving subsidies from national or local authorities. In particular, we have
information on how important firms consider financing obstacles to be in affecting the
operation and growth of their business. Using this information to distinguish financially
constrained from unconstrained firms, we hope to compensate for the paucity of
firm-level financial information.
Table 1 reports firm-level financing patterns averaged over all firms in each
country. In the WBES, enterprise managers were asked: “Please identify the share of
your firm’s financing over the last year coming from each of the following sources.” The
sources are internal financial sources such as retained earnings or funds from family and
friends and external financial sources such as equity, local commercial banks, foreign
banks, supplier credit, leasing arrangements, development banks, and other government
8 The survey covers 80 economies, but the sample is reduced because of missing firm-level or country
information.
9 To check the credibility of the financial data, we compare the largest WBES firms in each country with
services or informal sources, such as moneylenders. 10 These proportions adds up to
100%.11
Insert Table 1 near here
We categorize the different sources of external financing into six groups. Bank
Finance includes financing from local and foreign banks. Equity Finance is financing
through issue of stock (in the case of corporations) or from personal wealth (in the case of
non incorporated firms). Leasing Finance and Supplier Finance are funding through
leasing arrangements and trade credit, respectively. Development Finance is funding
from special development financing or other state services. Finally, finance from
moneylenders and other traditional sources are classified as Informal Finance.12
We recognize that our financing pattern variables are different from those
commonly used in the literature. For example, Demirguc-Kunt and Maksimovic (1999)
focus on debt maturity and analyze long-term debt to total asset and long-term debt to
total debt ratios. In our case, we do not have information on the amount of debt or total
assets. We know only the proportion of investment financed from a particular source
over the last year, in which the denominator (unavailable) is the total amount of internal
and external resources used for firm financing. Firm financing refers to capital
expenditures, working capital, and acquisitions. Unfortunately, the WBES data do not
allow us to distinguish between financing of working capital versus investment.
10 We recognize that whether funds from family and friends qualify as internal or external sources might be
controversial. We also have the problem that funds from friends and family might be debt or equity. However, this category is limited, because no more than 1% or 2% of investment is financed using sources from friends and family. Furthermore, we are more interested in sources rather than security types in this study.
11 We omit firms for which the proportions do not add up to one hundred.
12 There is a remainder category, which amounts on average to2% and on which we do not have detailed
As Fig. 1 and the first column of Table 1 show, in most countries including
developed ones such as the US, UK and Germany, firms use internal resources to finance
a significant portion of their investment. Firms in several developing countries, such as
Colombia, Malaysia, Poland, and others, use more external finance than firms in the US,
where financial and legal development is one of the highest rated. Not surprisingly, in
some transitional countries with poorly developed institutions such as Armenia and
Moldova, internal financing of investment can be as high as 90%. However, at the other
extreme, countries such as Italy and Trinidad and Tobago have internal financing at about
30%.
Insert Fig. 1 near here
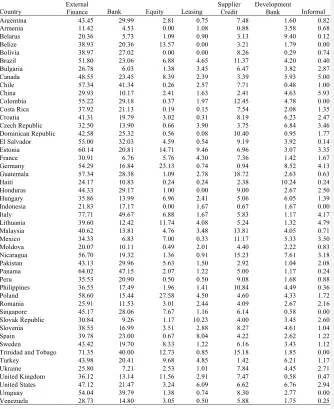
Looking at different financing sources is informative because countries with
similar overall external financing proportions can have very different financing patterns.
For example, firms in Nicaragua and Chile appear to have similar financing patterns if
one looks at only the external financing proportion. However, Nicaraguan firms finance
a large proportion of their investment using funds from development banks and supplier
credit, whereas Chilean firms use much more bank finance. More broadly, an inspection
of the table indicates that in countries in which bank and equity financing is more limited,
firms rely more on other forms of external finance. Table 1 also shows that the most
common source of external finance is bank finance followed by supplier credit.
3. Data and methodology
In our regression analysis, we relate firms’ financing patterns with other firm and
country characteristics. In Table 2 we summarize relevant facts about the level of
definitions and sources are described in Appendix Table A2. Country-level variables are
1995-1999 averages. For each country, we present data on Gross Domestic Product
(GDP) per capita, growth rate of GDP, and inflation. In addition, we present private
credit, an indicator of financial intermediary development commonly used in the
literature: the ratio of credit issued to the private sector by deposit money banks and other
financial institutions to GDP (Beck, Demirguc-Kunt, and Levine, 2000). Countries with
higher levels of private credit have been shown to grow faster (Beck, Levine, and
Loayza, 2000). Stock market development is captured by Value Traded, which is given
by value of shares traded divided by GDP and is a good indicator of stock market
liquidity. Levine and Zervos (1998) and Beck and Levine (2004) show a robust relation
between stock market liquidity and GDP per capita growth. Finally, we also present an
indicator of property rights protection, Property Rights, which is an indicator compiled by
the Heritage Foundation. Its values vary between one and five, with greater values
indicating a greater level of protection of private property rights. While not an indicator
of financial development, Property Rights measures a key input into the efficient
operation of financial contracts and thus financial development: the degree of protection
of private property rights (Beck, Demirguc-Kunt, and Levine, 2003: Ayyagari,
Demirguc-Kunt, and Maksimovic, 2008).
Insert Table 2 near here
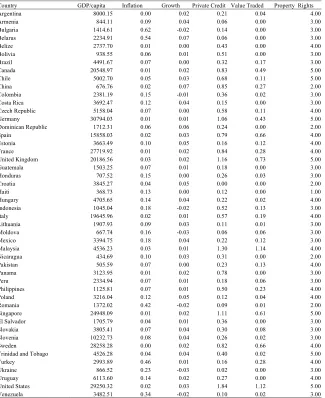
Inspection of Table 2 reveals a great deal of economic and financial variation
across the sample countries. Economic development ranges from Haiti, with an average
GDP per capita of $369 to US and Germany, with per capita income of more than
n the cases of Sweden and Argentina, up to 62% in the case of Bulgaria. Both financial
intermediary and stock market development, Private Credit and Value Traded, are higher
in more developed countries although significant variation still exists at different levels of
development. Property rights protection also increases with GDP per capita in general,
but there are many exceptions. For example, China’s income per capita is higher than
that of Pakistan’s, but property rights protection in Pakistan is rated highly at four,
whereas China’s rating is one of the lowest at two. We expect firms in countries with
higher levels of financial development to have better access to external finance. However,
it is not clear if different sources of external finance are affected by financial
development to the same extent or if firms of all sizes benefit equally.
Table 3 shows that the indicators of financial development are significantly
correlated with external financing and different sources of finance. Financial and
institutional development, as measured by any of our three indicators, is positively
correlated with the proportion of investment financed externally. Private Credit is highly
correlated with use of bank finance and stock market development: Value Traded is
correlated with the use of equity. Finally, better protection of property rights, Property
Rights, is positively correlated with bank, equity, and leasing finance. However, we also
note that many of the macroeconomic and financial indicators are correlated with each
other.
Insert Table 3 near here
Financing patterns also vary with firm characteristics, as can be seen in Table 3,
which also reports the sample statistics of the firm-level variables we consider and their
Small firms tend to rely on internal finance to a greater extent, with lower proportions of
bank finance. However, the correlations indicate that small firms also use less supplier
credit and receive less credit from development banks, while relying more on informal
finance. Subsidized firms appear to receive some of these subsidies through bank loans
and development financing. Similarly, government-owned firms seem to rely more on
development financing. Differences also are evident among industries. Manufacturing
firms are the greatest users of external finance, particularly bank finance. No significant
differences seem to emerge in financing patterns between incorporated and non
incorporated firms. Because these firm characteristics are also correlated with size, it is
important to control for them when investigating small firm financing patterns.
Papers in the literature also commonly include indicators of firms’ growth
opportunities, such as firms’ market-to-book ratio of equity (see Rajan and Zingales,
1995; and Booth, Aivazian, Demirguc-Kunt, and Maksimovic, 2001). Lacking such data
we include firms’ sales growth rate over the last three years as an indicator of future
growth opportunities. Sales growth is positively and significantly correlated with
external and equity finance.
Finally, capital structure studies cited above include indicators of firm
profitability, such as return on assets, or dividend payments to total assets to capture
financing constraints of firms. Higher dividend payout ratios are taken as indicators of
cash surplus relative to investment needs, making the firm less likely to finance
externally. While the proper interpretation of profitability ratios is much more
controversial, again higher profits are negatively associated with external financing,
profitability, we use the survey responses to identify whether the firms are financially
constrained or not. Specifically, the WBES survey asked enterprise managers to rate the
extent to which financing problems presented obstacles to the operation and growth of
their business. A rating of one denotes no obstacle; two, a minor obstacle; three, a
moderate obstacle; and four, a major obstacle. In the regressions this variable allows us
to capture the extent to which a firm is financially constrained without relying on
accounting data such as profits, dividends, and the like.13 The correlations in Table 3,
Panel B suggest that firms reporting higher financing obstacles use less equity finance but
substitute with external finance from other sources such as leasing, supplier,
development, and informal sources. The correlations also indicate that small firms report
facing higher financing obstacles. We expect those firms reporting higher financing
obstacles to have a greater need for external finance and thus use this variable as a proxy
for cash constraints of firms.
However, the level of the constraint is also likely to be endogenous, because the
firms become more and more constrained as they increase their external finance, making
it difficult to identify causality. We try to account for this effect both in our regressions
and our interpretation by excluding the financing obstacle variable and running the
regression across subsamples of firms with different reported financing constraints. Also,
13 Using survey data has problems because managers can blame financing obstacles for their own poor
the relation between financing constraints and patterns might vary across different firm
size groups, which we explore through interaction terms.
The level variables do not correspond one-to-one to more conventional
firm-level controls used by earlier papers. For example, papers in the literature generally
include descriptors of firms’ operating characteristics, or asset tangibility, such as net
fixed assets to total assets and net sales to net fixed asset ratios as determinants of capital
structure. Firms that operate with greater fixed assets are shown to have greater
borrowing capacity, whereas those firms with a higher sales-to-asset ratio are more likely
to need more short term financing to support sales (see Demirguc-Kunt and Maksimovic,
1999). We do not have these variables available. Instead, we use indicators of firms’
industry and type of business to capture, at least partially, the differences in its operating
characteristics.
Because Table 3 indicates a high degree of correlation between financing patterns
and institutions, as well as other firm- and country-level variables, we use multivariate
regression to clarify these relations. The dependent variables are the proportions of
investment financed by external financing or through different sources of external
finance.
As the observations are censored by zero and one hundred, we use Tobit
regressions to estimate the financing patterns. We use two different models to assess the
relation between firm and country characteristics and firms’ financing patterns. In all
cases, the dependent variable is the proportion of investment financed by firm i in
country k through external finance or different external financing sources, respectively.
relation between firms’ financing patterns and other firm characteristics. Controlling for
country fixed effects allows us to control not only for all kind of country-level factors but
also for country-level biases in firms’ responses to both financing patterns and obstacles.
Second, we replace the country-level fixed effects with our indicators of financial and
institutional development, as well as other country factors associated with financing
patterns. This allows us to directly relate firms’ financing patterns with countries’
financial and institutional development.14 In this specification, we relax the restriction
that error terms across firms within a country are independent of each other to take into
account possible unobserved country-level effects that might result in error correlations
between firms in a given country; i.e., we allow for clustering on the country level.
Finally, we return to the country-level fixed effects model to assess the differential
impact of financial and institutional development on financing patterns of firms of
different sizes.
The coefficients in the Tobit regressions cannot be interpreted as marginal effects
of the explanatory variable on the observed dependent variables. Instead, they are the
marginal effect of the underlying unobserved variables. In the text, we therefore also
discuss unconditional marginal effects of the observed dependent variable. These
marginal effects take into account not only the change in financing for firms with
14 While property rights protection is an exogenous variable, papers that study the relation between
financial development and access to finance at the country level generally suffer from simultaneity issues in that it is not clear if it is the use of a particular type of financing (debt or equity) that leads to the
development of debt or equity markets, or vice versa. See, for example, Demirguc-Kunt and Maksimovic (1998), Rajan and Zingales (1998), and others. However, because in this paper we analyze financing patterns of individual firms the causality is much more likely to go from country-level financial
financing of a specific source between zero and one hundred but also changes in the
probability that the financing proportion of a firm falls in this range (Maddala, 1986).
4. Results
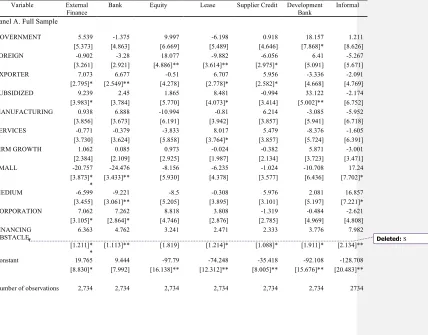
The Table 4 results show that small firms use significantly less external finance
than large firms. Here we run a baseline fixed effects regression; i.e., we include only
firm-level explanatory variables and control for country fixed effects. The lower use of
external finance by small enterprises is explained by a lower use of bank finance. While
medium-size enterprises do not use significantly less external finance than large firms,
they use less bank finance. The relation between firm size and the use of bank finance is
monotonic, increasing from small to medium and to large firms. Both small and
medium-size enterprises use significantly more informal financing sources than large firms. The
relation is also economically significant. The marginal effects suggest that small firms
finance on average 12 percentage points less of investment with external finance than
large firms, which compares with a mean External Finance of 41% and a standard
deviation of 38%. The relative economic effect is even stronger for Bank Finance, in
which the difference between small and large firms is 11 percentage points, compared
with a mean Bank Finance of 19% and a standard deviation of 28%. We do not find any
significant difference in the use of equity, trade, lease, or development finance across
firms of different sizes. Together, these results suggest that small firms cannot substitute
other financing sources such as leasing, trade, or development finance for the lower
access to bank finance. The significantly higher use of informal finance compared with
Insert table 4 near here
The incorporation dummy is positive and significant in the external finance
equation, but only at 10%. The difference is again due to greater financing from banks,
which is also significant at 10%. Although corporations rely on equity financing to a
greater extent, this effect is not significant. This suggests that private equity plays as
much a role in unincorporated firms as public equity plays in corporations. In unreported
regressions, we also look at differences between incorporated and unincorporated firms in
the use of equity finance but could not find any difference across size groups within the
two subsamples.
The results also indicate that firms reporting greater financing obstacles use more
external finance. This finding, however, is also consistent with the interpretation that, as
firms use more external finance, they tend to face greater financing constraints. Looking
at different financing sources, we see that this relation holds for all sources except equity
finance. Splitting the sample into incorporated and unincorporated firms does not yield a
significant coefficient on Financing Obstacle in the Equity Finance regression.15 This
suggests a pecking order of financial sources, in which constrained firms are not able to
issue equity to meet their financing needs.
Table 4 also identifies several other firm characteristics associated with the use of
different financing sources. Not surprisingly, government-owned firms have easier
access to resources from development institutions. Foreign-owned firms finance a large
share of investment with equity finance, but a lower share with lease and trade finance.
Exporters use more external finance, especially bank, lease, and trade finance. Subsidized
institutions. No significant differences exist in financing patterns across firms in different
sectors, and faster growing firms do not receive more external financing after accounting
for other firm characteristics.
In the remaining panels of Table 4, we explore the robustness of our findings to
the potential endogeneity of the financing obstacle variable. Panel B shows that our
findings on the relation between firm patterns and other firm characteristics is confirmed
when excluding the financing obstacle variable. Specifically, the relation between firm
size and the use of external and bank finance is confirmed. Panels C and D show that our
results are also confirmed when we split the sample according to the financing obstacle in
firms that report financing as no or minor obstacle (Panel C) and firms that report
financing as moderate or major obstacle (Panel D). However, these results also suggest
that the relation between size and financing patterns is stronger for firms that are more
financially constrained.
Having established the importance of size for financing patterns, especially for the
use of bank finance, we now assess the importance of financial and institutional
development for financing patterns by replacing the fixed country effects with
country-level indicators of financial intermediary and stock market development as well as
property right protection.
Table 5 shows the importance of financial and institutional development for
firms’ use of different financing sources. Table 5, Panel A shows that firms in countries
with higher levels of financial intermediary development, as measured by Private Credit,
use more external finance and, specifically, use more lease and development finance.
Traded, use more equity and lease finance, although overall stock market development is
not significantly associated with more extensive use of external financing sources (Table
5, Panel B). Firms in countries with better property right protection use more external
finance, especially bank and equity finance (Table 5, Panel C). These results are
confirmed when we include all three measures of financial and institutional development
together (Table 5, Panel D). Further, we find a significant effect of Private Credit, Value
Traded and Property Rights on equity finance only for incorporated, but not for
unincorporated enterprises.16 Even controlling for the level of institutional and financial
development, however, we still find the same significant association of firm size with
financing patterns as in Table 4.
Insert Table 5 near here
The effect of Private Credit and Property Rights on External Finance varies
between these two indicators. The average firm in Chile (75th percentile of Private
Credit) uses 2 percentage points more external finance than the average firm in Costa
Rica (25th percentile of Private Credit). The average firm in Uruguay (75th percentile of
Property Rights) uses 6 percentage points more external finance than the average firm in
Venezuela (25th percentile of Property Rights).17
Turning to the country-level control variables, we do not find a robust association
of the level of economic development, as measured by GDP per capita, with financing
patterns. Similarly, firms in faster growing economies do not experience different
financing patterns from firms in countries that grow more slowly. Higher levels of
inflation have a negative effect on the overall reliance on external finance and are
associated with lesser use of bank and supplier finance.
Together, these results suggest a strong impact of financial and institutional
development, especially of property rights protection on the use of external finance by
firms. But does this effect vary across different firm size groups?
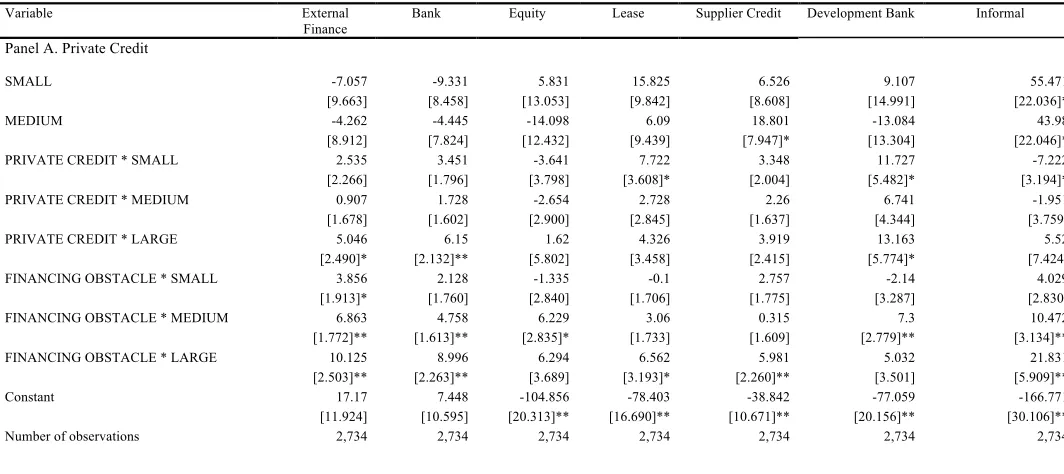
Table 6 explores the variation of the relation between financial and institutional
development with financing patterns across different size group of firms. Specifically,
we return to the fixed effects specification of Table 4 and introduce interaction terms of
Private Credit, Value Traded, and Property Rights with dummies for large, medium-size
and small firms. Similarly, we explore whether the significant relation between financing
obstacles and financing patterns varies across firms of different sizes.
Insert Table 6 near here
We find evidence that private credit increases the use of external financing
sources by large firms, especially bank and development finance. Small firms seem to
benefit somewhat from financial intermediary development by a larger use of lease and
development finance and lower use of informal finance. No differential effect exists of
financial intermediary development on medium-size firms. Small and large firms in
countries with higher levels of stock market development use more lease finance, perhaps
because leasing firms have fewer problems funding their loans. Finally, better property
right protection is conducive to higher use of external, especially bank finance. The
positive effect of Property Rights on Bank Finance decreases in firm size: Small firms
benefit relatively more from better property right protection than medium-size firms that
in turn benefit more than large firms.
The effect of property rights protection on closing the external financing gap
between small and large firms is relatively large. Small firms in Uruguay (75th percentile
of Property Rights) finance 9 percentage points more investment with external finance
than small firms in Venezuela (25th percentile of Property Rights), while the difference
is only 5 percentage points for large firms.
Table 6 also indicates that for large firms higher financing constraints are
associated with greater levels of external finance than medium-size enterprises. And
similarly for medium-size enterprises, higher constraints are associated with greater
levels of external finance than small enterprises. Given the endogenous nature of this
variable, it is difficult to assess causality, but these results are consistent with larger firms
more easily being able to meet their financing needs and being constrained at higher
levels of external finance. When we look at financing sources, we see that this finding is
mostly due to a monotonic increase in the relation between financing obstacles and bank
finance. Constrained large firms also use more lease, supplier, and, surprisingly,
informal finance.
The Table 6 results thus show that better property right protection can level the
playing field between small and large firms in terms of the use of external and especially
bank finance. However, financially constrained firms still have an easier time expanding
their use of external finance if they are large instead of small.
The estimates so far can be interpreted to show that firms with greater financing
needs are more likely to rely on different sources of external finance. However, thus far,
we have not imposed any a priori ordering of sources of external financing. The pecking
external finance makes it efficient for the firm to access equity last after all other sources
of external finance are exhausted.18
Traditional pecking order theory does not consider the incentives of investors to
acquire costly proprietary information about the issues. Fughlieri and Lukin (2001)
predict that, when the cost of acquiring proprietary information is not too high, a reverse
pecking order could occur. In this reverse pecking order, firms are more likely to issue
equity securities before incurring additional debt because equity provides more incentives
for information gathering by private investors. Consistent with this prediction, Gomes
and Phillips (2006) find that a reverse pecking order for private placements coexists with
a traditional pecking order for public issues.
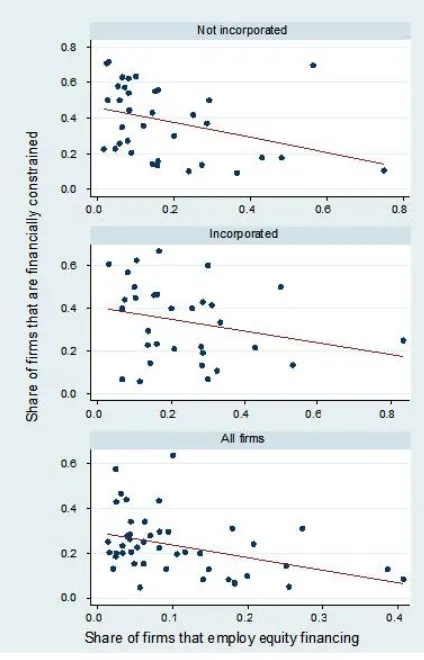
While our data do not allow us a sophisticated test of the pecking order, we can
assess the relation between financing constraints and the use of equity finance. The
simple correlation coefficient from Table 3 suggests a negative relation. However, this
refers to the proportion of investment financed with equity, while the pecking order
theory predicts that firms do not use any equity before they exhaust their capacity to
finance investment with other external financing sources. If the traditional pecking order
is correct, we would expect to see a low proportion of firms financing investment with
equity finance in countries in which a large proportion of firms report that they are
financially constrained. We therefore consider the empirical relation between the share
of firms that report to be financially constrained in a country and the share that uses
equity finance for investment. Fig. 2 shows a negative relation between the proportion of
firms in a country that report financing to be a major constraint and the proportion of
18 The empirical tests of pecking order theories in the United States have not produced unanimity. Thus, for
firms that use any equity finance for investment. This relation is robust to the exclusion
of outliers and holds both for incorporated and unincorporated enterprises.
Insert Fig 2 near here
Fig. 2 suggests that the traditional pecking order theory indeed holds: The more
firms in a country are financially constrained, the less likely is an extensive use of equity
as a source of investment finance, be it through issue of shares or private equity. This
last result is of interest given the Fughlieri and Lukin (2001) theoretical prediction that,
when costs of private information gathering are relatively low, firms that issue securities
through private placements adopt a reverse pecking order. We find no evidence of such a
reversal of the pecking order. This finding suggests that the costs of private information
acquisition are high or that the rights of minority equityholders are insufficiently strong
to provide adequate incentives to overcome the adverse selection effects in the market for
equity.
5. Conclusions
We investigate how firm financing patterns differ around the world for large
versus small firms. Using a unique firm-level survey database in 48 countries, we find
that firm size, financial development, and property rights protection are important factors
in explaining the observed variation in financing patterns. In contrast to earlier literature,
80% of our sample is composed of small and medium size firms. We examine a broader
spectrum of external financing sources, which includes not only debt and equity finance,
but also leasing and supplier finance, development bank, and informal finance.
Our results indicate that firm size plays an important role in understanding
financing patterns. Small firms use less external finance, especially bank finance. But
small firms also benefit the most from better protection of property rights in terms of
accessing formal sources of external finance, particularly bank finance. Finance from
development banks and other government sources are used to a greater extent by larger
firms. Similarly, leasing and supplier finance does not fill in the financing gap of small
firms. Thus, the most effective way of improving small firms’ access to external finance
appears to be through institutional reforms addressing the weaknesses in legal and
REFERENCES
Ayyagari, M., Demirguc-Kunt, A., Maksimovic V., 2008. How well do institutional theories explain firms’ perceptions of property rights? Forthcoming in Review of Financial Studies.
Ball, R., Kothari S. P., Robin, A.,2000. The effect of international institutional factors on properties of accounting earnings. Journal of Accounting and Economics 29, 1-51.
Beck, T., Levine, R., Loayza, N., 2000. Finance and the sources of growth. Journal of Financial Economics 58, 261-300.
Beck, T., Demirguc-Kunt, A., Laeven, L., Maksimovic, V., 2006. The determinants of financing obstacles. Journal of International Money and Finance 25, 932-952.
Beck, T., Demirgüç-Kunt, A., Levine, R., 2003. Law, endowments, and finance. Journal of Financial Economics 70, 137-181.
Beck, T., Demirguc-Kunt, A., Levine, R., 2000. A new database on the structure and development of the financial sector. The World Bank Economic Review 14, 597-605.
Beck, T., Levine, R., 2004. Stock markets, banks, and growth: panel evidence. Journal of Banking and Finance 28, 423-442.
Beck, T., Demirguc-Kunt, A., Maksimovic, V., 2004. Bank competition and access to finance. Journal of Money, Credit and Banking 36, 627-648.
Beck, T., Demirguc-Kunt, A., Maksimovic, V., 2005. Financial and legal constraints to firm growth: does size matter? Journal of Finance 60, 137-77.
Biais, B., Gollier C., 1997. Trade Credit and credit rationing, Review of Financial Studies 10, 903-937.
Booth, L., Aivazian, V., Demirguc-Kunt, A., Maksimovic, V., 2001. Capital structures in developing countries. Journal of Finance 56, 87-130.
Carlin, W., Mayer, C., 2003. Finance, investment, and growth. Journal of Financial Economics 69, 191-226.
Demirgüç-Kunt, A., Maksimovic, V., 1998. Law, finance, and firm growth. Journal of Finance 53, 2107-2137.
Demirgüç-Kunt, A., Maksimovic, V., 1999. Institutions, financial markets and firm debt maturity. Journal of Financial Economics 54, 295-336.
Demirgüç-Kunt, A., Maksimovic, V., 2001. Firms as financial intermediaries: Evidence from trade credit data. Unpublished policy working paper 2696. World Bank, Washington, DC.
Fan, J., Titman S., Twite, G., 2003. An international comparison of capital structure and debt maturity choices. Unpublished working paper. University of Texas, Austin, TX.
Frank, M. Z., Goyal, V. K., 2003. Testing the pecking order theory of capital structure. Journal of Financial Economics 67, 217-248.
Frank, M., Maksimovic, V., 2001, Trade credit, collateral, and adverse selection. Unpublished working paper. University of Maryland, College Park, MD. Available at SSRN: http://ssrn.com/abstract=87868.
Fulghieri, P., and Lukin D., 2001. Information production, dilution costs, and optimal security design. Journal of Financial Economics 61, 3-42.
Gomes, A., Phillips, G., 2006. Why do public firms issue public and private securities? Unpublished working paper. University of Maryland, College Park, MD.
Graham, J. R., Harvey, C. R., 2001. The theory and practice of corporate finance: evidence from the field. Journal of Financial Economics 60, 187-243.
Hellman, J., Jones, G., Kaufmann, D. and M. Schankerman. 2000. Measuring governance and state capture: the role of bureaucrats and firms in shaping the business environment. Unpublished working paper 51. European Bank for Reconstruction and Development, London, UK.
Hung, M., 2001. Accounting standards and value relevance of financial statements: An international analysis. Journal of Accounting and Economics 30, 401-420.
King, R. G.,Levine, R., 1993. Finance and growth: Schumpeter might be right. Quarterly Journal of Economics 108, 717-38.
La Porta, R., Lopez-de-Silanes, F., Shleifer, A., and Vishny, R. W., 1997, Legal determinants of external finance. Journal of Finance 52, 1131-1150.
La Porta, R., Lopez-de-Silanes, F., Shleifer, A., and Vishny, R. W., 1998. Law and finance. Journal of Political Economy 106, 1113-1155.
Leary, T., Roberts, M. R., 2005. Do firms rebalance their capital structures. Journal of Finance 80, 2575-2619.
Levine, R., Zervos, S., 1998. Stock markets, banks, and economic growth. American Economic Review 88, 537-558.
Love, I., 2003, Financial development and financing constraints: international evidence from the structural investment model. Review of Financial Studies 16, 765-91.
Maddala, G. S., 1986. Limited-Dependent and Qualitative Variables in Econometrics. Cambridge University Press, New York, NY.
Myers, S. C., Majluf, N. S., 1984. Corporate financing and investment decisions when firms have information that investors do not have. Journal of Financial Economics 13, 187-221.
NewYork Times, 2001. Ancient secret system moves money globally, October 3.
Rajan, R., Zingales, L., 1995. What do we know about capital structure? Some evidence from international data. Journal of Finance 50, 1421-1460.
Rajan, R., Zingales, L., 1998. Financial dependence and growth. American Economic Review 88, 559-587.
Schramm, M., Taube M., 2003, Evolution and institutional foundation of the hawala financial system. International review of financial analysis 12, 405-420.
Shyam-Sunder, L., Myers, S. C., 1999. Testing static tradeoff against pecking order models of capital structure. Journal of Financial Economics 51, 219-244.
World Bank, 2007. Review of Small Business Activities.Washington, DC: World Bank
Wurgler, J., 2000. Financial markets and the allocation of capital. Journal of Financial Economics 58, 187-214.
Formatted: Font:Not Italic
Deleted: Group
Deleted: ,
Deleted: 2007
Table 1
Financing patterns around the world. Figures given are firm averages for each country, and they are the proportion of investment financed by each source. External finance is the sum of bank, equity, leasing, supplier credit, development bank and informal finance. Bank finance includes financing from domestic as well as foreign banks. Development bank includes funding from both development and public sector banks. Informal includes funding from money lenders and traditional or informal sources.
Country External Finance Bank Equity Leasing Supplier Credit
Development
Bank Informal
Argentina 43.45 29.99 2.81 0.75 7.48 1.60 0.82
Armenia 11.42 4.53 0.00 1.08 0.88 3.58 0.68
Belarus 20.36 5.73 1.09 0.90 3.13 9.40 0.12
Belize 38.93 20.36 13.57 0.00 3.21 1.79 0.00
Bolivia 38.97 27.02 0.00 0.00 8.26 0.29 0.74
Brazil 51.80 23.06 6.88 4.65 11.37 4.20 0.40
Bulgaria 26.78 6.03 1.38 3.45 6.47 3.82 2.87
Canada 48.55 23.45 8.39 2.39 3.39 5.93 5.00
Chile 57.34 41.34 0.26 2.57 7.71 0.48 1.00
China 29.93 10.17 2.41 1.63 2.41 4.63 5.93
Colombia 55.22 29.18 0.37 1.97 12.45 4.78 0.00
Costa Rica 37.92 21.13 0.19 0.15 7.54 2.08 1.35
Croatia 41.31 19.79 3.02 0.31 8.19 6.23 2.47
Czech Republic 32.50 13.90 0.66 3.90 3.75 6.84 3.46
Dominican Republic 42.58 25.32 0.56 0.08 10.40 0.95 1.77
El Salvador 55.00 32.03 4.59 0.54 9.19 3.92 0.14
Estonia 60.14 20.81 14.71 9.46 6.96 3.07 3.35
France 30.91 6.76 5.76 4.30 7.36 1.42 1.67
Germany 54.29 16.84 23.13 0.74 0.94 8.52 4.13
Guatemala 57.34 28.38 1.09 2.78 18.72 2.63 0.63
Haiti 24.17 10.83 0.24 0.24 2.38 10.24 0.24
Honduras 44.33 29.17 1.00 0.00 9.00 2.67 2.50
Hungary 35.86 13.99 6.96 2.41 5.06 6.05 1.39
Indonesia 21.83 17.17 0.00 1.67 0.67 1.67 0.00
Italy 77.71 49.67 6.88 1.67 5.83 1.17 4.17
Lithuania 39.60 12.42 11.74 4.08 5.24 1.32 4.79
Malaysia 40.62 13.81 4.76 3.48 13.81 4.05 0.71
Mexico 34.33 6.83 7.00 0.33 11.17 5.33 3.50
Moldova 20.07 10.11 0.49 2.01 4.40 2.22 0.83
Nicaragua 56.70 19.32 1.36 0.91 15.23 7.61 3.18
Pakistan 43.13 29.96 5.63 1.50 2.92 1.04 2.08
Panama 64.02 47.15 2.07 1.22 5.00 1.17 0.24
Peru 35.53 20.90 0.50 0.50 9.08 1.68 0.88
Philippines 36.55 17.49 1.96 1.41 10.84 4.49 0.36
Poland 58.60 15.44 27.58 4.50 4.60 4.33 1.72
Romania 25.91 11.53 3.01 2.44 4.09 2.67 2.16
Singapore 45.17 28.06 7.67 1.16 6.14 0.58 0.00
Slovak Republic 30.84 9.26 1.17 10.23 4.00 3.45 2.60
Slovenia 38.55 16.99 3.51 2.88 8.27 4.61 1.04
Spain 39.78 23.00 0.67 8.04 4.22 2.62 1.22
Sweden 43.42 19.70 8.33 1.22 6.16 3.43 1.12
Trinidad and Tobago 71.35 40.00 12.73 0.85 15.18 1.85 0.00
Turkey 43.98 20.41 9.68 4.85 1.42 6.21 1.17
Ukraine 25.80 7.21 2.53 1.01 7.84 4.45 2.71
United Kingdom 36.12 13.14 11.56 2.91 7.47 0.58 0.47
United States 47.12 21.47 3.24 6.09 6.62 6.76 2.94
Uruguay 54.04 39.79 1.38 0.74 8.30 2.77 0.00
Table 2
Economic, financial and institutional indicators. Gross domestic product (GDP) per capita is real GDP per capita in US dollars. Inflation is the log difference of the Consumer Price Index. Growth is the growth rate of GDP in US dollars. Private credit is financial sector credit to private sector divided by GDP. Value Traded is the value of shares traded to GDP. Property Rights is rating from one to five of the degree to which property rights are protected in a nation. All country variables are 1995-1999 averages. Detailed variable definitions and sources are given in the Appendix.
Country GDP/capita Inflation Growth Private Credit Value Traded Property Rights
Argentina 8000.15 0.00 0.02 0.21 0.04 4.00
Armenia 844.11 0.09 0.04 0.06 0.00 3.00
Bulgaria 1414.61 0.62 -0.02 0.14 0.00 3.00
Belarus 2234.91 0.54 0.07 0.06 0.00 3.00
Belize 2737.70 0.01 0.00 0.43 0.00 4.00
Bolivia 938.55 0.06 0.01 0.51 0.00 3.00
Brazil 4491.67 0.07 0.00 0.32 0.17 3.00
Canada 20548.97 0.01 0.02 0.83 0.49 5.00
Chile 5002.70 0.05 0.03 0.68 0.11 5.00
China 676.76 0.02 0.07 0.85 0.27 2.00
Colombia 2381.19 0.15 -0.01 0.36 0.02 3.00
Costa Rica 3692.47 0.12 0.04 0.15 0.00 3.00
Czech Republic 5158.04 0.07 0.00 0.58 0.11 4.00
Germany 30794.03 0.01 0.01 1.06 0.43 5.00
Dominican Republic 1712.31 0.06 0.06 0.24 0.00 2.00
Spain 15858.03 0.02 0.03 0.79 0.66 4.00
Estonia 3663.49 0.10 0.05 0.16 0.12 4.00
France 27719.92 0.01 0.02 0.84 0.28 4.00
United Kingdom 20186.56 0.03 0.02 1.16 0.73 5.00
Guatemala 1503.25 0.07 0.01 0.18 0.00 3.00
Honduras 707.52 0.15 0.00 0.26 0.03 3.00
Croatia 3845.27 0.04 0.05 0.00 0.00 2.00
Haiti 368.73 0.13 0.00 0.12 0.00 1.00
Hungary 4705.65 0.14 0.04 0.22 0.02 4.00
Indonesia 1045.04 0.18 -0.02 0.52 0.13 3.00
Italy 19645.96 0.02 0.01 0.57 0.19 4.00
Lithuania 1907.93 0.09 0.03 0.11 0.01 3.00
Moldova 667.74 0.16 -0.03 0.06 0.06 3.00
Mexico 3394.75 0.18 0.04 0.22 0.12 3.00
Malaysia 4536.23 0.03 0.01 1.30 1.14 4.00
Nicaragua 434.69 0.10 0.03 0.31 0.00 2.00
Pakistan 505.59 0.07 0.00 0.23 0.13 4.00
Panama 3123.95 0.01 0.02 0.78 0.00 3.00
Peru 2334.94 0.07 0.01 0.18 0.06 3.00
Philippines 1125.81 0.07 0.01 0.50 0.23 4.00
Poland 3216.04 0.12 0.05 0.12 0.04 4.00
Romania 1372.02 0.42 -0.02 0.09 0.01 2.00
Singapore 24948.09 0.01 0.02 1.11 0.61 5.00
El Salvador 1705.79 0.04 0.01 0.36 0.00 3.00
Slovakia 3805.41 0.07 0.04 0.30 0.08 3.00
Slovenia 10232.73 0.08 0.04 0.26 0.02 3.00
Sweden 28258.28 0.00 0.02 0.82 0.66 4.00
Trinidad and Tobago 4526.28 0.04 0.04 0.40 0.02 5.00
Turkey 2993.89 0.46 0.01 0.16 0.28 4.00
Ukraine 866.52 0.23 -0.03 0.02 0.00 3.00
Uruguay 6113.60 0.14 0.02 0.27 0.00 4.00
United States 29250.32 0.02 0.03 1.84 1.12 5.00
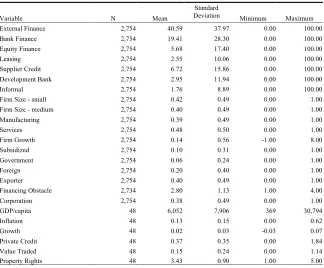
Table 3
Summary statistics and correlations. N refers to firm level observations for 48 countries. Bank finance, Equity, Leasing, Supplier credit, Development bank, and Informal are financing proportions that stand for the proportion of investment financed externally, by bank debt, equity, leasing, supplier credit, development, and public sector banks and money lenders, respectively. Firm size-small takes the value one if the firm is a small firm and zero otherwise. Firm size–medium takes the value one if the firm is a medium firm and zero otherwise. Manufacturing takes the value one for firms in manufacturing and zero otherwise. Similarly, Services takes the value one for firms in the services sector and zero otherwise. Firm growth is given by percent change in sales. Government and Foreign are dummy variables that take the value one if the firm has government or foreign ownership and zero if not. Exporter is a dummy variable that indicates if the firm is an exporting firm. Subsidized is also a dummy variable that indicates if the firm receives subsidies from the national or local authorities. Corporation is a dummy that indicates whether a firm is incorporated. GDP/ capita is real Gross domestic product (GDP) per capita in US dollars. Inflation is the log difference of the Consumer Price Index. Growth is the growth rate of GDP in US dollars. Financing Obstacle is an index that measures how problematic financing is to the operation and growth of a business. Private Credit is the financial sector credit to the private sector divided by GDP. Value Traded is the value of shares traded to GDP. Property Rights is a rating from one to five of the degree to which property rights are protected in a nation. All country variables are 1995-1999 averages. Detailed variable definitions and sources are given in the Appendix. * indicates a significance level of 5%.
Panel A. Summary statistics
Variable N Mean
Standard Deviation
Minimum Maximum
External Finance 2,754 40.59 37.97 0.00 100.00
Bank Finance 2,754 19.41 28.30 0.00 100.00
Equity Finance 2,754 5.68 17.40 0.00 100.00
Leasing 2,754 2.55 10.06 0.00 100.00
Supplier Credit 2,754 6.72 15.86 0.00 100.00
Development Bank 2,754 2.95 11.94 0.00 100.00
Informal 2,754 1.76 8.89 0.00 100.00
Firm Size - small 2,754 0.42 0.49 0.00 1.00
Firm Size - medium 2,754 0.40 0.49 0.00 1.00
Manufacturing 2,754 0.39 0.49 0.00 1.00
Services 2,754 0.48 0.50 0.00 1.00
Firm Growth 2,754 0.14 0.56 -1.00 8.00
Subsidized 2,754 0.10 0.31 0.00 1.00
Government 2,754 0.06 0.24 0.00 1.00
Foreign 2,754 0.20 0.40 0.00 1.00
Exporter 2,754 0.40 0.49 0.00 1.00
Financing Obstacle 2,734 2.80 1.13 1.00 4.00
Corporation 2,754 0.38 0.49 0.00 1.00
GDP/capita 48 6,052 7,906 369 30,794
Inflation 48 0.13 0.15 0.00 0.62
Growth 48 0.02 0.03 -0.03 0.07
Private Credit 48 0.37 0.35 0.00 1.84
Value Traded 48 0.15 0.24 0.00 1.14
Property Rights 48 3.43 0.90 1.00 5.00
Panel B. Correlation matrix of dependent and independent variables Variable External Finance Bank Finance Equity Finance
Leasing Supplier Credit
Development Bank
Informal Firm size-small Firm size- medium
Manufacturing Services Firm Growth External Finance 1
Bank Finance 0.6282* 1
Equity Finance 0.3517* -0.0902* 1
Leasing 0.2158* -0.0471* -0.0083 1
Supplier Credit 0.3727* -0.0145 -0.0432* -0.0013 1
Development Bank 0.2255* -0.0809* -0.0238 -0.0042 -0.0185 1
Informal 0.1591* -0.0792* -0.0107 0.0003 0.0001 -0.0114 1
Firm size-small -0.1846* -0.2160* 0.0163 0.0098 -0.0393* -0.0616* 0.0539* 1
Firm size-medium 0.0807* 0.0681* 0.0058 0.0118 0.0498* 0.0505* -0.0055 -0.6900* 1
Manufacturing 0.0649* 0.1261* -0.0589* -0.0332 0.0228 0.0201 -0.0172 -0.2242* 0.1094* 1
Services -0.0441* -0.0901* 0.0265 0.0429* -0.0037 -0.0377* 0.0127 0.2055* -0.1201* -0.7700* 1
Firm Growth 0.0572* 0.0049 0.0754* 0.0306 -0.0047 0.0306 -0.0267 -0.0223 0.0249 -0.0211 0.0199 1 Subsidized 0.0868* 0.0581* -0.0059 0.0301 -0.0267 0.1207* -0.0211 -0.1347* 0.0479* 0.0374* -0.0742* 0.0171 Government 0.0566* 0.0313 0.0148 -0.0115 -0.016 0.0649* 0.0034 -0.1563* 0.0755* 0.1145* -0.0786* -0.0293 Foreign 0.0736* 0.0813* 0.0284 -0.0497* -0.0136 0.0192 -0.0301 -0.2342* 0.0238 0.1194* -0.0426* 0.0398* Exporter 0.1440* 0.1523* 0.03 0.0471* 0.0228 0.0124 -0.0194 -0.2489* 0.0899* 0.3683* -0.2960* 0.0911* GDP/capita 0.0814* 0.0572* 0.0815* 0.0195 -0.0247 0.0171 0.0048 -0.0487* 0.0427* -0.0772* 0.0658* 0.0614* Inflation -0.1574* -0.1558* -0.0422* 0.0062 -0.0645* 0.0335 0.0022 0.1028* -0.0266 0.0456* -0.1142* -0.0430* Growth 0.1107* 0.0414* 0.1395* 0.0518* -0.0173 0.0153 0.0205 -0.0054 0.0214 -0.0073 0.0246 0.1330* Financing Obstacle 0.0237 -0.0034 -0.0422* 0.0408* 0.0359 0.0373 0.0675* 0.0832* 0.0186 0.0524* -0.1144* -0.0967* Private Credit 0.0955* 0.1008* 0.0002 0.0207 0.0057 0.0167 0.0005 -0.0493* -0.0161 -0.0263 0.0576* 0.0121 Value Traded 0.0441* 0.0157 0.0487* 0.0584* -0.0161 0.0246 0.0044 -0.0108 0.0217 -0.0627* 0.0525* 0.0217 Property Rights 0.1683* 0.1243* 0.1722* 0.0593* -0.0006 -0.0113 -0.0179 -0.0062 0.0371 -0.1034* 0.0708* 0.0848* Corporation 0.0154 0.0299 0.0071 0.02 0.0016 -0.0024 -0.0171 -0.1397* 0.1114* 0.0361 -0.0389* 0.028
Subsidized Government Foreign Exporter GDP/capita Inflation Growth Financing Obstacle
Private Credit
Value Traded Property Rights
Corporation
Subsidized 1
Government 0.1186* 1
Foreign 0.0441* 0.0706* 1
Exporter 0.1111* 0.1187* 0.2186* 1
GDP/capita 0.1011* -0.0093 0.0958* 0.0934* 1
Inflation -0.0407* 0.0327 -0.1004* -0.0831* -0.3787* 1
Growth 0.0385* 0.0793* 0.0224 0.1352* 0.1297* -0.3494* 1
Financing Obstacle -0.0275 0.0208 -0.1423* -0.0327 -0.2306* 0.1642* -0.1258* 1
Private Credit 0.0904* -0.0485* 0.1239* 0.0566* 0.7408* -0.4703* 0.1242* -0.1940* 1
Value Traded 0.0887* -0.0550* 0.0637* 0.0445* 0.7559* -0.2920* 0.0840* -0.1812* 0.8437* 1
Table 4
Determinants of financing patterns; the role of firm size. The estimated fixed effects interval regression model is FINANCING SOURCE = α0 + α1 GOVERNMENT + α2 FOREIGN + α3 EXPORTER + α4 SUBSIDIZED + α5 MANUFACTURING + α6 SERVICES + α7 FIRM
GROWTH + α8 SMALL + α9 MEDIUM + α10 CORPORATION + α11 FINANCING OBSTACLE + α12 COUNTRY DUMMIES + ε.
FINANCING SOURCE is the proportion of investment financed by external sources, bank debt, equity, leasing, supplier credit, development banks, or informal sources. External finance is the sum of bank, equity, leasing, supplier credit, development bank and informal finance. Bank finance includes financing from domestic as well as foreign banks. Development bank includes funding from both development and public sector banks. Informal includes funding from money lenders and traditional or informal sources. GOVERNMENT and FOREIGN are dummy variables indicating whether a firm has government or foreign ownership, respectively; EXPORTER is a dummy variable that indicates whether a firm is an exporting firm; SUBSIDIZED is a dummy variable that indicates if the firm receives subsidies from the national or local authorities; MANUFACTURING is a dummy variable that indicates whether a firm is in the manufacturing sector; SERVICES is a dummy variable that indicates whether a firm is in the services sector; FIRM GROWTH is firm sales growth; SMALL is a dummy variable that indicates whether firm size is small; MEDIUM is a dummy variable that indicates whether firm size is medium; CORPORATION is a dummy variable that indicates whether a firm is incorporated; and FINANCING OBSTACLE is an index that measures how problematic financing is to the operation and growth of a business, and ranges from no obstacle (1), to minor obstacle (2), to moderate obstacle (3), to major obstacle (4). Variable definitions and sources are detailed in the Appendix. All regressions are run as tobit regressions and include country fixed effects. Panel A uses the full sample and estimates the full model, Panel B uses the full sample but omits the financing obstacle variable, Panel C restricts the sample to firms that report no or minor financing obstacles, and Panel D restricts the sample to firms with moderate or major financing obstacles. Robust standard errors are in brackets. *= significant at 5%; **= significant at 1%.
Variable External
Finance
Bank Equity Lease Supplier Credit Development
Bank
Informal
Panel A. Full Sample
GOVERNMENT 5.539 -1.375 9.997 -6.198 0.918 18.157 1.211
[5.373] [4.863] [6.669] [5.489] [4.646] [7.868]* [8.626]
FOREIGN -0.902 -3.28 18.077 -9.882 -6.056 6.41 -5.267
[3.261] [2.921] [4.886]** [3.614]** [2.975]* [5.091] [5.671]
EXPORTER 7.073 6.677 -0.51 6.707 5.956 -3.336 -2.091
[2.795]* [2.549]** [4.278] [2.778]* [2.582]* [4.668] [4.769]
SUBSIDIZED 9.239 2.45 1.865 8.481 -0.994 33.122 -2.174
[3.983]* [3.784] [5.770] [4.073]* [3.414] [5.002]** [6.752]
MANUFACTURING 0.938 6.888 -10.994 -0.81 6.214 -3.085 -5.952
[3.856] [3.673] [6.191] [3.942] [3.857] [5.941] [6.718]
SERVICES -0.771 -0.379 -3.833 8.017 5.479 -8.376 -1.605
[3.730] [3.624] [5.858] [3.764]* [3.857] [5.724] [6.391]
FIRM GROWTH 1.062 0.085 0.973 -0.024 -0.382 5.871 -3.001
[2.384] [2.109] [2.925] [1.987] [2.134] [3.723] [3.471]
SMALL -20.757 -24.476 -8.156 -6.235 -1.024 -10.708 17.24
[3.873]*
* [3.433]** [5.930] [4.378] [3.577] [6.436] [7.702]*
MEDIUM -6.599 -9.221 -8.5 -0.308 5.976 2.081 16.857
[3.455] [3.061]** [5.205] [3.895] [3.101] [5.197] [7.221]*
CORPORATION 7.062 7.262 8.818 3.808 -1.319 -0.484 -2.621
[3.105]* [2.864]* [4.746] [2.876] [2.785] [4.969] [4.808]
FINANCING
OBSTACLE 6.363 4.762 3.241 2.471 2.333 3.776 7.982
[1.211]*
* [1.113]** [1.819] [1.214]* [1.088]* [1.911]* [2.134]**
Constant 19.765 9.444 -97.79 -74.248 -35.418 -92.108 -128.708
[8.830]* [7.992] [16.138]** [12.312]** [8.005]** [15.676]** [20.483]**
Number of observations 2,734 2,734 2,734 2,734 2,734 2,734 2734
Deleted: S