Acharya, U. H. and Gijo, E. V. and Antony, J. (2010) Quality engineering of a traction alternator by robust
design. Journal of Engineering Manufacture, 224 (2). pp. 297-304. ISSN 0954-4054
http://strathprints.strath.ac.uk/
27004
/
Strathprints is designed to allow users to access the research output of the University of
Strathclyde. Copyright © and Moral Rights for the papers on this site are retained by the
individual authors and/or other copyright owners. You may not engage in further
distribution of the material for any profitmaking activities or any commercial gain. You
may freely distribute both the url (
http://strathprints.strath.ac.uk
) and the content of this
paper for research or study, educational, or not-for-profit purposes without prior
permission or charge. You may freely distribute the url (
http://strathprints.strath.ac.uk
)
of the Strathprints website.
Quality engineering of a traction
alternator by robust design
U H Acharya1, E V Gijo1,andJ Antony2*
1
SQC & OR Unit, Indian Statistical Institute, Bangalore, India
2Department of DMEM, University of Strathclyde, Glasgow, UK
The manuscript was received on 10 November 2008 and was accepted after revision for publication on 6 July 2009.
DOI: 10.1243/09544054JEM1423
Abstract: Robust design is an engineering methodology for improving productivity during research and development so that high-quality products can be developed and produced quickly and at low cost. A large electrical company was developing traction alternators for a diesel electrical engine. Customer requirement was to obtain very high efficiency which, in turn, was influenced by several design parameters. The usual approach of the ‘design–build–test’ cycle was considered time-consuming and costly; it used to take anywhere from 4 months to 1 year before finalizing the product design parameters as it involved physical assembly and also testing. Instead, the authors used Taguchi’s parameter design approach. This approach took about 8 weeks to arrive at optimum design parameter values; clearly demonstrating the cutting edge of this methodology over the traditional design–build–test approach. The pro-totype built and tested accordingly gave satisfactory overall performance, meeting and even exceeding customer requirements.
Keywords: factor, level, response, quality engineering, parameter design, robust design, noise factors, signal-to-noise ratio
1 THE PRODUCT: ALTERNATOR
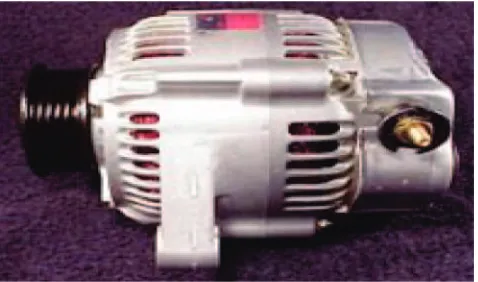
Alternators, also known as alternating current (a.c.) generators (Fig. 1), operate on the fundamental principle of electromagnetic induction to convert mechanical energy into a.c. electrical energy. The standard construction consists of armature windings mounted on a stationary element called a stator (Fig. 2) and field windings on a rotating element called a rotor. The stator consists of a cast iron frame, which supports the laminated armature core having slots on its periphery for housing the three-phase winding. The rotor is like a flywheel, and has a large number of alternate north and south poles bolted to it. The magnetic wheel is made of cast iron or steel of good magnetic quality. In the alternator, the rotor uses current supplied through slip rings to generate a moving field. Power is extracted from the stationary
field coils. The dimensions of stator, rotor, pole, and air gap between rotor and stator impact the value of efficiency of the alternator.
2 CUSTOMER REQUIREMENTS
The customer for this product had specified overall performance measures for the alternator in terms of different functional parameters in which efficiency was the most important (see Table 1). The efficiency of an alternator is defined as the ratio of the watts available in the load circuit to the mechanical power supplied. The specification for efficiency was given as minimum 90 per cent, whereas the current product was giving an efficiency of about 65 to 74 per cent, which was leading to customer complaints. The company perceived this as a threat of losing their market in the future to competitors, who could claim an efficiency of at least 90 per cent. The issue with the design department was to arrive at the best parameter values so as to achieve the customer requirements in the shortest possible time.
*Corresponding author: Quality Management, University of Strathclyde, James Weir Building, 75 Montrose Street, Glasgow G1 1XJ, UK.
3 THE CLASSICAL APPROACH
While designing a product, the objective of the design engineer is to maximize the performance of the product and reduce the variability in perform-ance from product to product. The methods like ‘design–build–test’ and ‘optimization’ do not deal with the reduction of variability in performance and do not directly give information regarding the contribution of each component to performance. Parameter design – a technique developed by Dr G. Taguchi of Japan – aims at maximizing the performance values of any product, while simultaneously reducing the variability in performance. Hence this approach of robustness in design was adopted in the present study.
4 THE TAGUCHI METHODOLOGY
Taguchi proposed a three-step strategy for the devel-opment of products. The steps are system design, parameter design, and tolerance design, with an emphasis on the use of experimental methods in the latter two steps. In 1979, Taguchi’s ideas were trans-lated in a publication [1] that was followed by many others on the subject (see e.g. references [2] to [4]).
The papers by Hunter [5] and Kackar [6] explain the essence of Taguchi’s ideas in an understandable and comprehensive manner. In the late 1980s and
beginning of the 1990s, there was discussion on the appropriateness of the statistical methods proposed by Taguchi. Publications contributing to this discus-sion were those of Le´on et al. [7], Box et al. [8], Shainin and Shainin [9], Welchet al. [10], Shoemaker
et al. [11], Box and Jones [12], Nair [13], Lucas [14], and Grize [15]. There are fewer publications that focus mainly on non-statistical issues such as prin-ciples, procedures, and objectives.
4.1 Taguchi’s three-step procedure
The design process described in Taguchi and Wu [1] and Taguchi [2] is strongly associated with the con-cept of quality engineering (see e.g. reference [16]). According to the description in Taguchi [2], system design is the stage in which different concepts and choices of technology are considered at different levels, e.g. the system level and the component level. The aim in parameter design is to decide on appro-priate levels of individual system parameters. What is an appropriate level for a parameter or an appro-priate combination of parameter levels is determined by what reduces the effect of noise on the output characteristic. Finally, in the last step, tolerances are set in a way that further minimizes the effect of noise, e.g. narrower tolerances for noise factors that have the greatest influence. Taguchi [2] emphasizes, however, that this is not the most efficient way to reduce variation caused by noise and that it should be seen as a last resort after parameter design.
The core of Taguchi’s parameter design is based on experimental methods. Since the beginning of the 1980s there has been ongoing research to suggest alternatives and improvements of the methods he
Fig. 1 The alternator
Fig. 2 Exploded view of the rotor (left) and stator (right)
Table 1 Values of functional requirements
Sl. no. Characteristic Requirement
1 Efficiency Min. 90%
2 Air gap flux density Min. 0.63
3 Full load field current Max. 31.00
4 Transient voltage dip Max. 30.00
5 Short circuit field current Max. 21.70
[image:3.595.42.281.448.589.2] [image:3.595.300.543.536.606.2]proposed. Useful references to obtain a picture of the current status of robust parameter design (RPD) are Wu and Hamada [17], Myers and Montgomery [18], Robinsonet al. [19], and Myerset al. [20].
The Taguchi method relies on crossed array designs that require a large number of runs. These designs are intended for estimating interactions between control and noise factors [11,18].
Robust design makes heavy use of orthogonal arrays, whose use for planning experiments was first proposed by Rao [21]. Orthogonal arrays are useful for studying a large number of decision variables in a small number of experiments.
The basic idea of RPD experiments is to vary con-trol factors and noise factors in the same experiment and seek possible control–noise factor interactions. The combined array approach suggested by Welch
et al. [10] and Shoemaker et al. [11] includes noise factors and control factors in the same design matrix, which often results in cost-efficient experiments.
4.2 Different approaches to analysis
An important concept in the Taguchi method is the signal-to-noise (S/N) ratio. The S/N ratio is one of Taguchi’s techniques that allows analysis which takes into account the variability caused by a factor or independent variable. In conventional statistics, fac-tors are usually analysed to determine their effect on the mean performance of some quality char-acteristic or functional parameter. The Taguchi method demonstrates, however, that some factors have an effect on changing the mean, while others have an effect on changing the variability. The role of factors affecting variability is simply missed by con-ventional experimental methods.
Thus robust design methodology means systematic efforts to achieve insensitivity to noise factors. These efforts are founded on an awareness of variation and can be applied in all stages of product design. An application of parameter design is discussed here.
5 EFFICIENCY IMPROVEMENT OF THE TRACTION ALTERNATOR 5.1 Selection of factors and levels
After a series of brainstorming sessions, 13 control factors (components) that influence efficiency were selected. In order to identify the best value of each factor (component), it was decided to vary each factor at three levels. In quality engineering it is recommended to select three levels for each factor unless it is known to be linearly related with the response. (Two levels may be adequate in such cases.) Table 2 gives a list of the control factors selected and the corresponding levels of each factor.
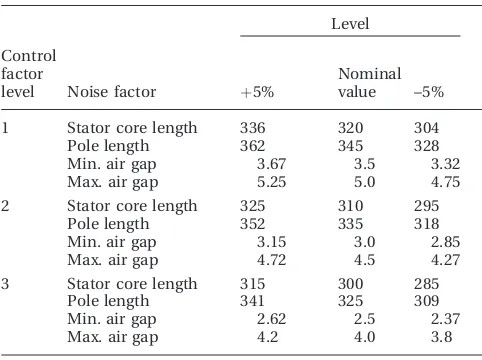
In order to consider the effect of inner noise, Taguchi recommends identification of two levels: one above and the other below the existing level for experi-mentation. During a series of meetings with the design and manufacturing team, four factors each at three levels were selected as noise factors, and levels of the noise factors were chosen with –5 per cent variation from the nominal value based on the knowledge and experience of the designers. Table 3 gives the list of noise factors and their respective levels.
5.2 Conduct of the study
[image:4.595.314.556.375.537.2]A robust design is a product or process design that performs consistently as intended, under a wide range of noise conditions, throughout its life cycle. The three major sources of noises that affect the performance of the product are: inner noise, outer noise (customer usage conditions), and product-to-product variation. Inner noise was taken into account by considering the noise factors during the
Table 2 Different control factors and their levels
Level (in mm)
Sl. no. Control factor Code 1 2 3
1 Stator o.d. A 740 730 720
2 Stator i.d. B 575 565 555
3 Stator core length C 320 310 300
4 Coil span D 4 5 6
5 Slot width E 17.5 16.5 15.5
6 Slot height F 38 36 34
7 Rotor i.d. G 395 385 375
8 Pole length H 345 335 325
9 Pole body width I 93 90 87
10 Pole shoe width J 166 162 158
11 Pole shoe height K 27 25 23
12 Min. air gap L 3.5 3 2.5
13 Max. air gap M 5.0 4.5 4.0
Table 3 Noise factors and their levels
Level
Control factor
level Noise factor þ5%
Nominal
value –5%
1 Stator core length 336 320 304
Pole length 362 345 328
Min. air gap 3.67 3.5 3.32
Max. air gap 5.25 5.0 4.75
2 Stator core length 325 310 295
Pole length 352 335 318
Min. air gap 3.15 3.0 2.85
Max. air gap 4.72 4.5 4.27
3 Stator core length 315 300 285
Pole length 341 325 309
Min. air gap 2.62 2.5 2.37
[image:4.595.314.555.578.758.2]design stage. The outer noises were chosen by con-sidering different customer usage conditions like variable voltage and variable frequency. For this purpose it was decided to try four combinations of voltage and current: (440 KVA, 220 V), (440 KVA, 627 V), (525 KVA, 540 V), and (525 KVA, 384 V). The product-to-product variation could be considered only during the manufacturing stage and hence was not studied. The response of the experiment was taken as the efficiency of the alternator.
The 13 control factors were allocated in an ortho-gonal array (OA) table L36 (23·313) called the inner
array. The L36 array was preferred (no interactions
were considered for estimation by the management) to other three-level OA designs in view of its super-iority in estimation of main effects. Interactions between any two columns of this array are con-founded with the remaining columns, thus making this array fit for main effect estimation only [3]. Thus there were 36 combinations of control factors. The noise factors were allocated in an OA table L9 (34)
called the outer array. For each combination in the inner array there were nine combinations in the outer array. Thus there were 36·9¼324 experi-mental combinations. Each of these 324 combina-tions was evaluated at four combinacombina-tions of voltage and current. Thus the total number of simulations became 324·4¼1296.
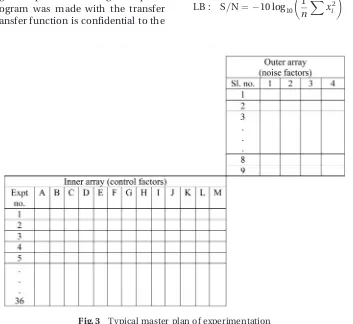
For conducting the experiment through computer simulation, a program was made with the transfer function. (The transfer function is confidential to the
company, so it is not disclosed here.) The transfer function is a mathematical model mapping the input variables considered in the study with the output variable: efficiency of the alternator. An Excel pro-gram was prepared for the transfer function. The responses were obtained by running the program for various values of the parameters, as per the master plan of the experiment given in Fig. 3.
5.3 Analysis and conclusions
As the aim of the study was to improve the efficiency of the traction alternator and simultaneously mini-mize its variation, it was necessary to account for the variation in the performance characteristics for each combination of control factors in L36over the range
of noise factors considered in L9. This was achieved
by expressing these varying data in a single measure, the S/N ratio. The S/N ratio measures the level of performance and the effect of noise factors on per-formance. The higher this ratio, the more the system is doing what it is intended to do regardless of noise factors. The S/N ratio formula for ‘higher the better’ (HB) response assumes the characteristics can take any value up to infinity, whereas in this case the upper limit on efficiency was 100 per cent. Thus the HB S/N ratio formula was not suitable. Hence, the S/N ratio formula for ‘lower the better’ (LB) type of characteristics was used
LB : S=N¼ 10 log10
1
n
X
x2i
Fig. 3 Typical master plan of experimentation
[image:5.595.116.469.432.756.2]wherexi¼1– efficiency for theith combination in the
L9 OA. For each experiment, 36 such losses in
effi-ciency values (xi) were obtained. Hence the
optimi-zation problem reduces to minimizing the xi values
(note that minimizingximaximizes the efficiency as
well as minimizes the variation).
Consider a typical set of experiments, say Expt no. 1 as shown in Fig. 3 which, in turn, is obtained from Tables 2 and 3. It is a combination of 13 inner array design values with nine outer array design values. The first experimental combination for the inner array is A¼740, B¼575, C¼320, D¼4, E¼17.5, F¼38, G¼395, H¼345, I¼93, J¼166, K¼27, L¼3.5, and M¼5.0. For this main experiment, using nine outer array combinations with four replications, 36 observations were obtained. These data are shown in Table 4. The S/N ratio for this set of values was calculated as follows
S=N¼ 10 log10
1
n
X
xi2
; wherexi¼1efficiency
¼ 10 log10
1
36·½ð10:9409Þ
2þ ð1
0:9402Þ2
þ ð10:9381Þ2þ. . .þ ð10:9524Þ2
þ ð10:9527Þ2
!
¼24:028 17
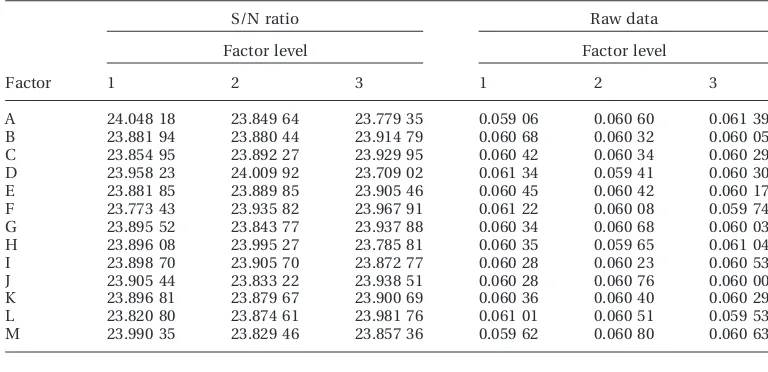
Similarly, all 36 S/N ratios were calculated. Analysis of variance (ANOVA) was performed on the S/N ratios to obtain the contribution of each of the factors to the variability in performance of the product. For identifying the significant factors, contribution per-centages for each factor were calculated. The average response for each level of the factors was calculated from the S/N ratios and is given in Table 5.
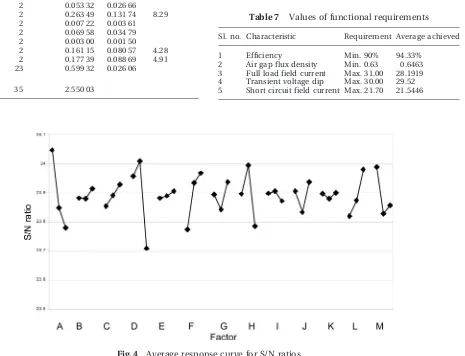
From the ANOVA table obtained as the output of ATM (Analysis by Taguchi Methods) software (Table 6), it was found that factors A, D, F, H, L, and M were those having a significant effect on effi-ciency by considering the contribution percentage of these factors on the total variation. Hence the best levels for these factors were determined from the average response curve (Fig. 4) of these factors so as to maximize the S/N ratio. The best levels were thus identified for these factors as A1, D2, F3,
H2, L3, and M1. Since the other factors did not have
a significant impact on efficiency, their best levels were decided as per manufacturing feasibility, cost, etc. The best factor level combination thus arrived at was
A1;B3;C3;D2;E3;F3;G2;H2;I1;J3;K3;L3;M1
Prediction was done with respect to the significant factors of the best combination.
[image:6.595.111.498.481.547.2]The expected average efficiency at the best com-bination was evaluated based on the additive linear model of effects on efficiency [3]
Table 4 Data for the first experiment of L36
Expt 1 2 3 4 5 6 7 8 9
1 94.09 94.02 93.81 93.71 93.77 92.98 93.38 92.57 92.49
91.40 91.43 91.46 91.60 91.63 91.64 91.80 91.82 91.84
95.49 95.51 95.51 95.39 95.44 95.27 95.28 95.10 95.16
[image:6.595.111.495.585.771.2]95.16 95.18 95.21 95.21 95.24 95.22 95.27 95.24 95.27
Table 5 Average response table
S/N ratio Raw data
Factor level Factor level
Factor 1 2 3 1 2 3
A 24.048 18 23.849 64 23.779 35 0.059 06 0.060 60 0.061 39
B 23.881 94 23.880 44 23.914 79 0.060 68 0.060 32 0.060 05
C 23.854 95 23.892 27 23.929 95 0.060 42 0.060 34 0.060 29
D 23.958 23 24.009 92 23.709 02 0.061 34 0.059 41 0.060 30
E 23.881 85 23.889 85 23.905 46 0.060 45 0.060 42 0.060 17
F 23.773 43 23.935 82 23.967 91 0.061 22 0.060 08 0.059 74
G 23.895 52 23.843 77 23.937 88 0.060 34 0.060 68 0.060 03
H 23.896 08 23.995 27 23.785 81 0.060 35 0.059 65 0.061 04
I 23.898 70 23.905 70 23.872 77 0.060 28 0.060 23 0.060 53
J 23.905 44 23.833 22 23.938 51 0.060 28 0.060 76 0.060 00
K 23.896 81 23.879 67 23.900 69 0.060 36 0.060 40 0.060 29
L 23.820 80 23.874 61 23.981 76 0.061 01 0.060 51 0.059 53
mExpected¼Tþ ðA1TÞ þ ð D2TÞ þ ð F3TÞ
þ ðH2TÞ þ ð L3TÞ þ ð M1TÞ
where T is the overall average and A1, D2, F3, H2, L3,
and M1are the respective level averages of efficiency
in the experiment. Thus
mExpected¼A1þD2þF3þH2þL3þM15T
¼94:474%
This value is much higher than the customer’s requirement. The 95 per cent confidence interval was computed as 94.222 to 94.726 per cent, indicating that the requirement of minimum 90 per cent effi-ciency will be certainly met.
5.4 Confirmatory trials
[image:7.595.39.278.314.494.2]During experimentation, no physical assembly was carried out; however, with this optimum combina-tion, five assemblies were made and tested in the design laboratory of the company as per the stan-dard test procedures for various functional perfor-mances. The efficiency obtained from the best combination was found to be very satisfactory (more than the customer’s requirement). At this factor level combination, the other functional requirements such as air gap flux density, full load field current, transient voltage dip, and short circuit field current of the alternator were also found to be satisfactorily meeting the customer requirements (Table 7).
5.5 Benefits
With the design–build–test approach this type of exercise was usually taking a cycle time of 8 to 12 months, whereas by this robust design approach, the best design could be identified in merely 8 weeks: a remarkable reduction in development cycle time. The company could clearly see the advantage of Taguchi methods.
[image:7.595.82.547.399.755.2]Fig. 4 Average response curve for S/N ratios Table 6 ANOVA table for S/N ratios
Source of variation
Degrees of freedom
Sum of squares
Mean square
Contribution (%)
A 2 0.466 50 0.233 25 16.25
B 2 0.009 05 0.004 52
C 2 0.033 75 0.016 87
D 2 0.621 28 0.310 64 22.32
E 2 0.003 46 0.001 73
F 2 0.260 90 0.130 45 8.19
G 2 0.053 32 0.026 66
H 2 0.263 49 0.131 74 8.29
I 2 0.007 22 0.003 61
J 2 0.069 58 0.034 79
K 2 0.003 00 0.001 50
L 2 0.161 15 0.080 57 4.28
M 2 0.177 39 0.088 69 4.91
Pooled error
23 0.599 32 0.026 06
Total 35 2.550 03
Table 7 Values of functional requirements
Sl. no. Characteristic Requirement Average achieved
1 Efficiency Min. 90% 94.33%
2 Air gap flux density Min. 0.63 0.6463
3 Full load field current Max. 31.00 28.1919
4 Transient voltage dip Max. 30.00 29.52
5 Short circuit field current Max. 21.70 21.5446
This study demonstrated the design of a product to perform at the indented value under all operating conditions. The fundamental principle of robust design, i.e. improving quality by minimizing effect of causes of variability in performance without elim-inating them, was demonstrated through this project and the company’s research and development department has embarked on several such iterations on new products. The two major tools, the S/N ratio and the orthogonal array, are being taught across the management.
Authors 2010
REFERENCES
1 Taguchi, G.andWu, Y.Introduction to off-line quality control, 1979 (Central Japan Quality Control Associa-tion, Nagoya).
2 Taguchi, G. Introduction to quality engineering – designing quality into products and processes, 1986 (Asian Productivity Organization, Tokyo).
3 Phadke, M. S.Quality engineering using robust design, 1989 (Prentice-Hall, Englewood Cliffs, New Jersey). 4 Taguchi, G., Chowdhury, S., and Taguchi, S. Robust
engineering – learn how to boost quality while reducing costs and time to market, 2000 (McGraw-Hill, New York).
5 Hunter, J. S. Statistical design applied to product design.J. Qual. Technol., 1985,17, 210–221.
6 Kackar, R. N.Off-line quality control, parameter design, and the Taguchi method (with discussion). J. Qual. Technol., 1985,17, 176–188.
7 Le´on, R. V., Shoemaker, A. C., and Kackar, R. N. Performance measures independent of adjustment.
Technometrics, 1987,29, 253–285.
8 Box, G. E. P., Bisgaard, S.,andFung, C.An explanation and critique of Taguchi’s contributions to quality engi-neering.Qual. Reliab. Engng Int., 1988,4, 123–131. 9 Shainin, D.andShainin, P.Better than Taguchi
ortho-gonal arrays.Qual. Reliab. Engng Int., 1988,4, 143–149. 10 Welch, W. J., Yu, T. K., Kang, S. M., and Sacks, J. Computer experiments for quality control by parameter design.J. Qual. Technol., 1990,22, 15–22.
11 Shoemaker, A. C., Tsui, K. L.,and Wu, J.Economical experimentation methods for robust design. Techno-metrics, 1991,33, 415–427.
12 Box, G. E. P.andJones, S.Split-plot designs for robust experimentation.J. Appl. Stat., 1992,19, 3–25.
13 Nair, V. N.Taguchi’s parameter design: a panel discus-sion.Technometrics, 1992,34, 127–161.
14 Lucas, J. M. How to achieve a robust process using response surface methodology.J. Qual. Technol., 1994, 26, 248–260.
15 Grize, Y. L. A review of robust design approaches.
J. Chemometrics, 1995,9, 239–262.
16 Goh, T. N.Taguchi methods: some technical, cultural and pedagogical perspectives.Qual. Reliab. Engng Int., 1993,9, 185–202.
17 Wu, C. F. J.andHamada, M. Experiments – planning, analysis, and parameter design optimization, 2000 (Wiley, New York).
18 Myers, R. H.andMontgomery, D. C.Response surface methodology – process and product optimization using designed experiments, 2000 (Wiley, New York).
19 Robinson, T. J., Borror, C. M.,andMyers, R. H.Robust parameter design: a review. Qual. Reliab. Engng Int., 2003,20, 81–101.
20 Myers, R. H., Montgomery, D. C., Vining, G. G., Borror, C. M., and Kowalski, S. M. Response surface metho-dology: a retrospective and literature survey. J. Qual. Technol., 2004,36, 53–77.
21 Rao, C. R. Factorial experiments derivable from com-binatorial arrangements of arrays.J. R. Stat. Soc., Ser. B, 1947,9.
BIBLIOGRAPHY
Andersson, P.Robustness of technical systems in relation to quality, reliability and associated concepts. J. Engng Design, 1997,8, 277–288.
Benton, W. C.Statistical process control and the Taguchi method: a comparative evaluation.Int. J. Prod. Res.,1991, 29, 1761–1770.
Bergman, B.andKlefsjo, B.Quality from customer needs to customer satisfaction, 2003 (Studentlitteratur, Lund). Borkowski, J. J.andLucas, J. M.Designs of mixed resolu-tion for process robustness studies. Technometrics, 1997, 39, 63–70.
Box, G. E. P.Statistics as a catalyst to learning by scientific method part II – a discussion.J. Qual. Technol., 1999,31, 16–29.
Box, G. and Bisgaard, S. Statistical tools for improving designs.Mech. Engng, 1988,110, 32–40.
Brenneman, W. A. and Myers, R. H. Robust parameter design with categorical noise factors. J. Qual. Technol., 2003,35, 335–341.
Chan, L. K.andXiao, P. H.Combined robust design.Qual. Engng, 1995,8, 47–56.
Clausing, D. Total quality development – a step-by-step guide to world-class concurrent engineering, 1994 (ASME Press, New York).
Dabade, B. M.andRay, P. K.Quality engineering for con-tinuous performance improvement in products and pro-cesses: a review and reflections.Qual. Reliab. Engng Int., 1996,12, 173–189.
Engel, J. and Huele, A. F. A generalized linear modeling approach to robust design.Technometrics, 1996,38, 365– 373.
Ford, R. B. Process for the conceptual design of robust mechanical systems – going beyond parameter design to achieve world-class quality, 1996 (Stanford University, Palo Alto, California).
Goh, T. N.The role of statistical design of experiments in six sigma: perspectives of a practitioner.Qual. Engng, 2002, 14, 659–671.
Gremyr, I., Arvidsson, M.,andJohansson, P.Robust design methodology: status in the Swedish manufacturing industry.
Gunter, B.A perspective on the Taguchi methods. Qual. Progr., 1987, June, 44–52.
Hoehn, W. K.Robust designs through design to six sigma manufacturability. In Proceedings of the IEEE Annual International Engineering Management Conference/Sin-gapore IEEE International Engineering Management Con-ference, Singapore, 1995, pp. 241–246.
Kackar, R. N.Taguchi’s quality philosophy: analysis and commentary. In Quality control robust design, and the Taguchi method (Ed. K. Dehnad), 1989 (Wadsworth & Brooks/Cole Advanced Books & Software, Pacific Grove, California).
Lee, Y.andNelder, J. A.Robust design via generalized lin-ear models.J. Qual. Technol., 2003,35, 2–12.
Lucas, J. M. Achieving a robust process using response surface methodology. Paper presented at the American Statistical Association Conference, Washington, DC, 1989. Matthiasen, B. Design for robustness and reliability – improving the quality consciousness in engineering design. PhD Thesis, Technical University of Denmark, 1997. Myers, R. H., Khuri, A. I., and Vining, G. G. Response surface alternatives to the Taguchi robust parameter design approach.Am. Stat., 1992,46, 131–139.
Myers, R. M., Brenneman, W. A.,andMyers, R. H.A dual-response approach to robust parameter design for a gen-eralized linear model.J. Qual. Technol., 2005,37, 130–138. Park, G., Lee, T., Lee, K.,andHwang, K.Robust design: an overview.AIAA J., 2006,44, 181–191.
Park, S. H. Robust design and analysis for quality engineering, 1996 (Chapman & Hall, London).
Pignatiello, J. J.andRamberg, J. S.Top ten triumphs and tragedies of Genichi Taguchi.Qual. Engng, 1991, 4, 211– 225.
Robinson, T. J., Brenneman, W. A.,andMyers, R. M. Pro-cess optimization via robust parameter design when cate-gorical noise factors are present.Qual. Reliab. Engng Int., 2006,22, 307–320.
Robinson, T. J., Wulff, S. S., Montgomery, D. C., and Khuri, A. I. Robust parameter design using generalized linear mixed models.J. Qual. Technol., 2006,38, 65–75.
Ross, P. J.Taguchi techniques for quality engineering, 1996 (McGraw-Hill, New York).
Roy, R.A primer on the Taguchi method, 1990 (Society of Manufacturing Engineers, Dearborn, Michigan).
Saitoh, K., Yoshizawa, M., Tatebayashi, K.,andDoi, M.A study about how to implement quality engineering in research and development (part 1). J. Qual. Engng Soc., 2003,11, 100–107.
Saitoh, K., Yoshizawa, M., Tatebayashi, K.,andDoi, M.A study about how to implement quality engineering in research and development (part 2). J. Qual. Engng Soc., 2003,11, 64–69.
Scibilia, B., Kobi, A., Chassagnon, R., and Barreau, A. Robust design: a simple alternative to Taguchi’s parameter design approach.Qual. Engng, 2001,13, 541–548.
Smith, J. andClarkson, P. J. A method for assessing the robustness of mechanical designs.J. Engng Design, 2005, 16, 493–509.
Steinberg, D. M.andBursztyn, D.Noise factors, dispersion effects, and robust design.Stat. Sin., 1998,8, 67–85. Taguchi, G. Taguchi on robust technology development – bringing quality engineering upstream, 1993 (ASME Press, New York, New York).
Thornton, A. C. Variation risk management – focusing quality improvements in product development and production, 2004 (Wiley, New Jersey).
Thornton, A. C., Donelly, S.,andErtan, B.More than just robust design: why product development organizations still contend with variation and its impact on quality. Res. Engng Design, 2000,12, 127–143.
Tribus, M.andSzonyi, G.An alternative view of the Tagu-chi approach.Qual. Progr., 1989,22, 46–52.
Vining, G. G.and Myers, R. H.Combining Taguchi and response-surface philosophies – a dual response approach.
J. Qual. Technol., 1990,22, 38–45.
Wu, Y.andWu, A.Taguchi methods for robust design, 2000 (American Society of Mechanical Engineers, New York).