Open Access
Short Report
The effect of alternative permutation testing strategies on the
performance of multifactor dimensionality reduction
Alison A Motsinger-Reif
Address: Department of Statistics, Bioinformatics Research Center, North Carolina State University, Raleigh, North Carolina, USA
Email: Alison A Motsinger-Reif - [email protected]
Abstract
Background: Multifactor Dimensionality Reduction (MDR) is a novel method developed to detect gene-gene interactions in case-control association analysis by exhaustively searching multi-locus combinations. While the end-goal of analysis is hypothesis generation, significance testing is employed to indicate statistical interest in a resulting model. Because the underlying distribution for the null hypothesis of no association is unknown, non-parametric permutation testing is used. Lately, there has been more emphasis on selecting all statistically significant models at the end of MDR analysis in order to avoid missing a true signal. This approach opens up questions about the permutation testing procedure. Traditionally omnibus permutation testing is used, where one permutation distribution is generated for all models. An alternative is n-locus permutation testing, where a separate distribution is created for each n-level of interaction tested.
Findings: In this study, we show that the false positive rate for the MDR method is at or below a selected alpha level, and demonstrate the conservative nature of omnibus testing. We compare the power and false positive rates of both permutation approaches and find omnibus permutation testing optimal for preserving power while protecting against false positives.
Conclusion: Omnibus permutation testing should be used with the MDR method.
Background
One of the main goals of genetic epidemiology is the iden-tification and characterization of polymorphisms that present an increased risk of disease. It is increasingly assumed that complex diseases are the result of a myriad of genetic and environmental risk factors [1,2]. This com-plex etiology limits the utility of traditional, parametric statistical approaches in genetic association studies [3,4]. The ubiquitous nature of gene-gene and gene-environ-ment interactions [1,5,6] has inspired the developgene-environ-ment the novel statistical approaches designed to detect epista-sis [7-9].
Multifactor Dimensionality Reduction (MDR) is one such method [10]. MDR was designed to detect interactions in categorical independent variables and a dichotomous dependent variable (i.e. case/control status or drug treat-ment response/non-response). MDR performs an exhaus-tive search of all possible single-locus through n-locus interactions (as computationally feasible) to evaluate all possible high/low risk models of disease. MDR selects a single model as optimal for each n-locus interaction as a result of these evaluations. Permutation testing (PT) is used to determine the significance of these models. MDR is nonparametric and model-free, so no hypotheses con-cerning the value of any statistical parameter nor any genetic inheritance model are made [10]. MDR has suc-Published: 30 December 2008
BMC Research Notes 2008, 1:139 doi:10.1186/1756-0500-1-139
Received: 18 July 2008 Accepted: 30 December 2008
This article is available from: http://www.biomedcentral.com/1756-0500/1/139
© 2008 Motsinger-Reif; licensee BioMed Central Ltd.
cessfully identified interactive effects in simulated data as well as real data applications in diseases such as hyperten-sion [3,11,12], cancer [10,13,14], and atrial fibrillation [15,16].
The end-goal of an MDR analysis is ultimately hypothesis generation (or refinement within candidate gene strate-gies) [17]. Hypothesis testing is used within the MDR analysis framework to determine whether resulting mod-els are significantly different than expected by chance. Sig-nificance of a model is intended to indicate an interesting model that should be followed up in replication cohorts or functional studies. In recent work, there has been more emphasis on selecting all statistically significant models [17] in order to avoid missing a true signal (false nega-tives) in exchange for risking the selection of a few false positives. This generation of multiple hypotheses opens up questions about the PT procedure used to ascribe sig-nificance to this end set of models.
PT is a commonly used non-parametric statistical proce-dure that involves re-sampling the data without replace-ment to actually construct the distribution of the test statistic under the null hypothesis rather than make spe-cific distributional assumptions. If the value of the test sta-tistic based on the original samples is extreme relative to this distribution (i.e. if it falls far into the tail of the distri-bution), then the null hypothesis is rejected [18]. Validity of PT relies only on the property of exchangeability under the null hypothesis – that the joint distribution of the data samples must remain invariant to permutations of the data subscripts. Thus, permutation tests maintain a wide applicability under a much broader range of data and research conditions than most parametric tests [19]. In addition, PT requires minimal assumptions about the data being examined, yet often has power equal to, or even greater than, parametric counterparts that require stronger, and sometimes untenable data assumptions [20]. Unlike many parametric and other nonparametric tests, the results of permutation tests (the p-values) are unbiased [18]. The chief drawback of this method is that it is computationally expensive, but the easy availability of fast computing has made this a practical approach even for large datasets.
MDR implements PT to statistically test to the best model(s) [21]. Typically, omnibus PT is used, where a sin-gle null distribution is generated from the best model of each of at least one thousand randomized datasets. With a focus on selecting all potentially interesting models from the final MDR set, this omnibus method may be too conservative. n-locus PT is an alternative, where a separate null distribution is created for each n-level of interaction. So if single-locus through five-way interactions were eval-uated in an original MDR analysis, a separate distribution
would be created for the single-locus model, for the two-locus model, etc (for a total of five null distributions).
Currently, we compare the significance cut-offs, power, and false positive rates of omnibus PT and n-locus PT implemented in MDR for a wide range of disease models. We also examine the overall false positive rate of the MDR method using both types of PT. As the MDR method gains acceptance and is increasingly used in the genetics com-munity, it is important that users understand how to properly apply PT.
Multifactor Dimensionality Reduction (MDR)
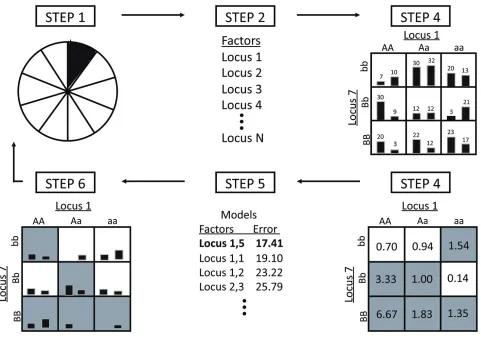
Figure 1 (adapted from [10]) outlines the MDR proce-dure. Details of the algorithm and of the alternative PT strategies implemented in the current study can be found in Additional file 1.
Data Simulations and Analysis
Simulated datasets that exhibit gene-gene interactions were generated for the purpose of evaluating the power and false positives of MDR using either omnibus or n-locus PT. Multiple disease models, as well as null data with no disease model, were generated with varying allele frequencies, heritability, and number of interacting func-tional polymorphisms. Details of the simulations and analysis are found in Additional file 1.
Results
Null data was used to check the false positive rates of both permutation-testing strategies in the absence of any signal from the data. Best models were chosen for each dataset based on low prediction error and high cross-validation consistency and compared to the appropriate permuta-tion distribupermuta-tion. Table 1 shows the false positive rate for each permutation distribution, with alpha = 0.05, where the false positive rate is estimated as the number of mod-els that were declared significant by PT out of the 100 datasets analyzed. These results demonstrate that the false positive rate is nominal for each permutation distribution – the error rate is at or below the selected alpha level.
demonstrates that the n-locus PT becomes more liberal as the level of dimensionality increases.
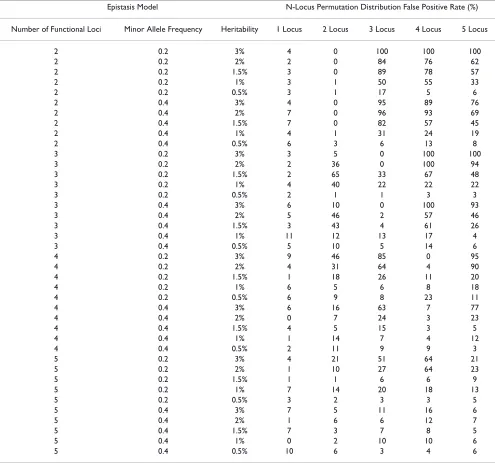
While the anti-conservative nature of n-locus PT could potentially increase power, it is undesirable if that results in an increased false positive rate. To evaluate this, we investigated the false positive rate of each n-locus permu-tation distribution for each model. MDR analysis was per-formed on each dataset for all single-locus through five-locus combinations, and a best model was chosen for each level of interaction. For each dataset, the best model for each level of interaction was compared to the appro-priate n-locus permutation distribution to estimate the false positive rate where a false positive result was any model that is not correct (may contain only incorrect loci
or correct loci with additional false positive loci) and was found statistically significant according to the appropriate permutation distribution. Summarized in Table 3, using this definition of power, the false positive rate is extremely high for any n-level interaction above the true genetic model. For example, for the two-locus interaction model with 0.2 minor allele frequency and 3% heritability, all three, four, and five locus models were statistically signif-icant.
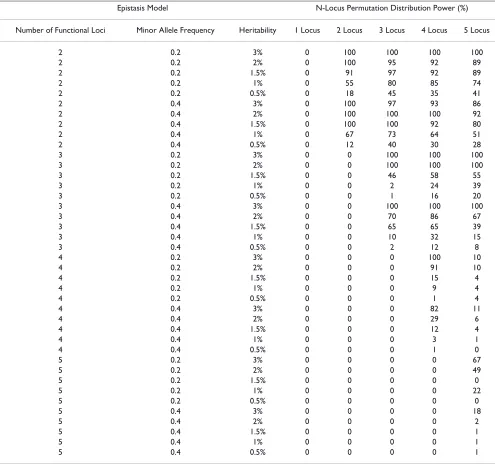
[image:3.610.61.542.83.425.2]To better understand this trend, we estimated power for each model as the number of times all functional loci (with or without additional/false positive loci) were iden-tified within the best model for any n-level interaction and was called significant according to the corresponding per-mutation distribution out of the 100 simulated datasets per model. Table 4 summarizes these results. These results suggest that the false positive rates shown in Table 3 may be driven by the inclusion of functional loci in higher-level interactions. This trend was seen for all models, but is especially apparent in higher heritability models. This suggests, especially in the case of a relatively strong signal An overview of the MDR method
Figure 1
An overview of the MDR method. Steps correspond to those described in the supplemental information.
Table 1: False positive rate for null data
Permutation Distribution False Positive Rate (%)
l Locus 2 Locus 3 Locus 4 Locus 5 Locus Omnibus
[image:3.610.53.295.679.729.2]from the data, that even containing the correct loci within the model is enough to drive it to statistical significance according to a more liberal PT procedure. This is a highly likely explanation, especially considering the nominal false positive rates demonstrated for null data (Table 1).
Table 4 shows that the power of MDR is relatively high in lower order models, especially at the n-locus level of anal-ysis. Interpretation of an MDR analysis is complicated, however, when using n-locus PT by the high level of false positives. Even though the functional loci are included in the significant models, choosing the correct order of
inter-action is difficult when n-locus PT is used for each level of interaction.
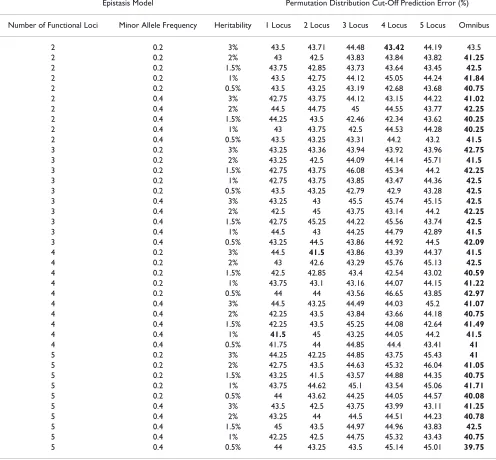
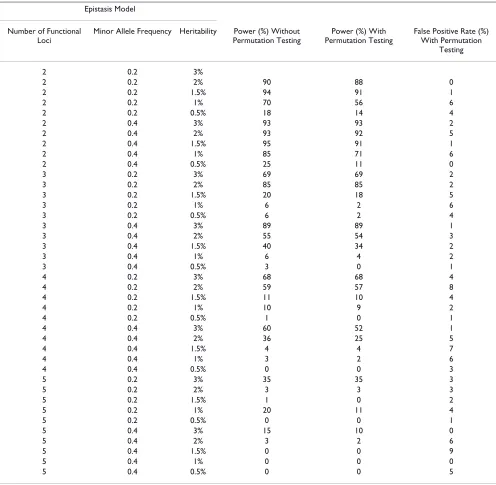
[image:4.610.57.553.105.565.2]Understanding that omnibus PT is the more conservative option, we investigated its impact on both the overall power and false positive rates of the MDR method. Table 5 summarizes these results for each disease model. First, we wanted to compare the power of MDR to detect the correct model as the final model (through minimization of prediction error and maximization of cross validation consistency) without considering statistical significance. Power was estimated as the number of times the func-tional/disease associate loci were chosen as the best
Table 2: Permutation testing significance cut-offs.
Epistasis Model Permutation Distribution Cut-Off Prediction Error (%)
Number of Functional Loci Minor Allele Frequency Heritability 1 Locus 2 Locus 3 Locus 4 Locus 5 Locus Omnibus
2 0.2 3% 43.5 43.71 44.48 43.42 44.19 43.5
2 0.2 2% 43 42.5 43.83 43.84 43.82 41.25
2 0.2 1.5% 43.75 42.85 43.73 43.64 43.45 42.5
2 0.2 1% 43.5 42.75 44.12 45.05 44.24 41.84
2 0.2 0.5% 43.5 43.25 43.19 42.68 43.68 40.75
2 0.4 3% 42.75 43.75 44.12 43.15 44.22 41.02
2 0.4 2% 44.5 44.75 45 44.55 43.77 42.25
2 0.4 1.5% 44.25 43.5 42.46 42.34 43.62 40.25
2 0.4 1% 43 43.75 42.5 44.53 44.28 40.25
2 0.4 0.5% 43.5 43.25 43.31 44.2 43.2 41.5
3 0.2 3% 43.25 43.36 43.94 43.92 43.96 42.75
3 0.2 2% 43.25 42.5 44.09 44.14 45.71 41.5
3 0.2 1.5% 42.75 43.75 46.08 45.34 44.2 42.25
3 0.2 1% 42.75 43.75 43.85 43.47 44.36 42.5
3 0.2 0.5% 43.5 43.25 42.79 42.9 43.28 42.5
3 0.4 3% 43.25 43 45.5 45.74 45.15 42.5
3 0.4 2% 42.5 45 43.75 43.14 44.2 42.25
3 0.4 1.5% 42.75 45.25 44.22 45.56 43.74 42.5
3 0.4 1% 44.5 43 44.25 44.79 42.89 41.5
3 0.4 0.5% 43.25 44.5 43.86 44.92 44.5 42.09
4 0.2 3% 44.5 41.5 43.86 43.39 44.37 41.5
4 0.2 2% 43 42.6 43.29 45.76 45.13 42.5
4 0.2 1.5% 42.5 42.85 43.4 42.54 43.02 40.59
4 0.2 1% 43.75 43.1 43.16 44.07 44.15 41.22
4 0.2 0.5% 44 44 43.56 46.65 43.85 42.97
4 0.4 3% 44.5 43.25 44.49 44.03 45.2 41.07
4 0.4 2% 42.25 43.5 43.84 43.66 44.18 40.75
4 0.4 1.5% 42.25 43.5 45.25 44.08 42.64 41.49
4 0.4 1% 41.5 45 43.25 44.05 44.2 41.5
4 0.4 0.5% 41.75 44 44.85 44.4 43.41 41
5 0.2 3% 44.25 42.25 44.85 43.75 45.43 41
5 0.2 2% 42.75 43.5 44.63 45.32 46.04 41.05
5 0.2 1.5% 43.25 41.5 43.57 44.88 44.35 40.75
5 0.2 1% 43.75 44.62 45.1 43.54 45.06 41.71
5 0.2 0.5% 44 43.62 44.25 44.05 44.57 40.08
5 0.4 3% 43.5 42.5 43.75 43.99 43.11 41.25
5 0.4 2% 43.25 44 44.5 44.51 44.23 40.78
5 0.4 1.5% 45 43.5 44.97 44.96 43.83 42.5
5 0.4 1% 42.25 42.5 44.75 45.32 43.43 40.75
model across the 100 replicates, with no false positive loci included in the model. By defining power in this context (with no PT), this estimate represents the least conserva-tive estimate. These results are equivalent to the least con-servative cut-off possible with n-locus PT. By defining power in this way, by using any significance testing the power cannot possibly be higher – all results that count towards "power" under this definition can only be changed to non-significant by using any significance test-ing. Results are summarized in the column of Table 5 labeled "Power Without Permutation Testing". This is then compared to the power of MDR to not only find the correct model, but to also ascribe statistical significance to
that model through omnibus PT. Results of this evalua-tion are presented in the column of Table 5 labeled "Power With Permutation Testing". Comparing the power with and without permutation demonstrates the results are similar. Omnibus PT does not severely limit the power of the method.
[image:5.610.55.550.101.566.2]Finally, we evaluated the impact of omnibus PT on the false positive rate. The false positive rate was estimated for each model as the number of incorrect final models that were statistically significant using omnibus PT. This calcu-lation included significance testing at each level of inter-action – not just a single test for one overall best model.
Table 3: False positive rates for n-locus permutation distributions.
Epistasis Model N-Locus Permutation Distribution False Positive Rate (%)
Number of Functional Loci Minor Allele Frequency Heritability 1 Locus 2 Locus 3 Locus 4 Locus 5 Locus
2 0.2 3% 4 0 100 100 100
2 0.2 2% 2 0 84 76 62
2 0.2 1.5% 3 0 89 78 57
2 0.2 1% 3 1 50 55 33
2 0.2 0.5% 3 1 17 5 6
2 0.4 3% 4 0 95 89 76
2 0.4 2% 7 0 96 93 69
2 0.4 1.5% 7 0 82 57 45
2 0.4 1% 4 1 31 24 19
2 0.4 0.5% 6 3 6 13 8
3 0.2 3% 3 5 0 100 100
3 0.2 2% 2 36 0 100 94
3 0.2 1.5% 2 65 33 67 48
3 0.2 1% 4 40 22 22 22
3 0.2 0.5% 2 1 1 3 3
3 0.4 3% 6 10 0 100 93
3 0.4 2% 5 46 2 57 46
3 0.4 1.5% 3 43 4 61 26
3 0.4 1% 11 12 13 17 4
3 0.4 0.5% 5 10 5 14 6
4 0.2 3% 9 46 85 0 95
4 0.2 2% 4 31 64 4 90
4 0.2 1.5% 1 18 26 11 20
4 0.2 1% 6 5 6 8 18
4 0.2 0.5% 6 9 8 23 11
4 0.4 3% 6 16 63 7 77
4 0.4 2% 0 7 24 3 23
4 0.4 1.5% 4 5 15 3 5
4 0.4 1% 1 14 7 4 12
4 0.4 0.5% 2 11 9 9 3
5 0.2 3% 4 21 51 64 21
5 0.2 2% 1 10 27 64 23
5 0.2 1.5% 1 1 6 6 9
5 0.2 1% 7 14 20 18 13
5 0.2 0.5% 3 2 3 3 5
5 0.4 3% 7 5 11 16 6
5 0.4 2% 1 6 6 12 7
5 0.4 1.5% 7 3 7 8 5
5 0.4 1% 0 2 10 10 6
As Table 5 shows, the false positive rates are near the expected 5% level.
From the results presented in Table 5, we conclude that omnibus PT controls for false positives while preserving power.
Conclusion
In this study we confirmed that the overall false positive rate of MDR is as expected according to the selected alpha level. Additionally, we demonstrated the conservative nature of omnibus testing in comparison to an n-locus strategy.
[image:6.610.55.550.100.565.2]We also demonstrated that omnibus PT is preferred to n-locus since it controls false positives without limiting power. While MDR has high power using either permuta-tion-testing scenario, final model selection is complicated by the more liberal n-locus strategy of PT. While the final goal of MDR is hypothesis generation, and the user may prefer the risk of false positives to the risk of missing a true signal, it is recommended that significance levels be assigned to one or more models from the final set using the omnibus permutation distribution, and not using cor-responding n-locus tests.
Table 4: Power (with or without additional loci) for n-locus permutation distributions.
Epistasis Model N-Locus Permutation Distribution Power (%)
Number of Functional Loci Minor Allele Frequency Heritability 1 Locus 2 Locus 3 Locus 4 Locus 5 Locus
2 0.2 3% 0 100 100 100 100
2 0.2 2% 0 100 95 92 89
2 0.2 1.5% 0 91 97 92 89
2 0.2 1% 0 55 80 85 74
2 0.2 0.5% 0 18 45 35 41
2 0.4 3% 0 100 97 93 86
2 0.4 2% 0 100 100 100 92
2 0.4 1.5% 0 100 100 92 80
2 0.4 1% 0 67 73 64 51
2 0.4 0.5% 0 12 40 30 28
3 0.2 3% 0 0 100 100 100
3 0.2 2% 0 0 100 100 100
3 0.2 1.5% 0 0 46 58 55
3 0.2 1% 0 0 2 24 39
3 0.2 0.5% 0 0 1 16 20
3 0.4 3% 0 0 100 100 100
3 0.4 2% 0 0 70 86 67
3 0.4 1.5% 0 0 65 65 39
3 0.4 1% 0 0 10 32 15
3 0.4 0.5% 0 0 2 12 8
4 0.2 3% 0 0 0 100 10
4 0.2 2% 0 0 0 91 10
4 0.2 1.5% 0 0 0 15 4
4 0.2 1% 0 0 0 9 4
4 0.2 0.5% 0 0 0 1 4
4 0.4 3% 0 0 0 82 11
4 0.4 2% 0 0 0 29 6
4 0.4 1.5% 0 0 0 12 4
4 0.4 1% 0 0 0 3 1
4 0.4 0.5% 0 0 0 1 0
5 0.2 3% 0 0 0 0 67
5 0.2 2% 0 0 0 0 49
5 0.2 1.5% 0 0 0 0 0
5 0.2 1% 0 0 0 0 22
5 0.2 0.5% 0 0 0 0 0
5 0.4 3% 0 0 0 0 18
5 0.4 2% 0 0 0 0 2
5 0.4 1.5% 0 0 0 0 1
5 0.4 1% 0 0 0 0 1
While these results are most immediately applicable to genetic epidemiologists using MDR, they may generalize to any computational method that involves PT. Addition-ally, as MDR gains acceptance and becomes more widely used, it is important that the consequences of alternative permutation strategies should be explored and under-stood. Recent work is also implementing alternative hypothesis testing strategies for MDR that are computa-tionally feasible for extremely large-scale datasets [22].
Abbreviations
MDR: Multifactor Dimensionality Reduction; PT: Permu-tation testing.
Competing interests
The authors declare that they have no competing interests.
Authors' contributions
[image:7.610.55.551.99.584.2]AAM designed the study, performed the data analysis, and wrote the manuscript.
Table 5: Power of MDR with and without omnibus permutation testing and false positive rate with permutation testing.
Epistasis Model
Number of Functional Loci
Minor Allele Frequency Heritability Power (%) Without Permutation Testing
Power (%) With Permutation Testing
False Positive Rate (%) With Permutation
Testing
2 0.2 3%
2 0.2 2% 90 88 0
2 0.2 1.5% 94 91 1
2 0.2 1% 70 56 6
2 0.2 0.5% 18 14 4
2 0.4 3% 93 93 2
2 0.4 2% 93 92 5
2 0.4 1.5% 95 91 1
2 0.4 1% 85 71 6
2 0.4 0.5% 25 11 0
3 0.2 3% 69 69 2
3 0.2 2% 85 85 2
3 0.2 1.5% 20 18 5
3 0.2 1% 6 2 6
3 0.2 0.5% 6 2 4
3 0.4 3% 89 89 1
3 0.4 2% 55 54 3
3 0.4 1.5% 40 34 2
3 0.4 1% 6 4 2
3 0.4 0.5% 3 0 1
4 0.2 3% 68 68 4
4 0.2 2% 59 57 8
4 0.2 1.5% 11 10 4
4 0.2 1% 10 9 2
4 0.2 0.5% 1 0 1
4 0.4 3% 60 52 1
4 0.4 2% 36 25 5
4 0.4 1.5% 4 4 7
4 0.4 1% 3 2 6
4 0.4 0.5% 0 0 3
5 0.2 3% 35 35 3
5 0.2 2% 3 3 3
5 0.2 1.5% 1 0 2
5 0.2 1% 20 11 4
5 0.2 0.5% 0 0 1
5 0.4 3% 15 10 0
5 0.4 2% 3 2 6
5 0.4 1.5% 0 0 9
5 0.4 1% 0 0 0
Publish with BioMed Central and every scientist can read your work free of charge
"BioMed Central will be the most significant development for disseminating the results of biomedical researc h in our lifetime."
Sir Paul Nurse, Cancer Research UK
Your research papers will be:
available free of charge to the entire biomedical community
peer reviewed and published immediately upon acceptance
cited in PubMed and archived on PubMed Central
yours — you keep the copyright
Submit your manuscript here:
http://www.biomedcentral.com/info/publishing_adv.asp
BioMedcentral
Additional material
Acknowledgements
This work was partially supported by National Institutes of Health grant GM62758. We would like to thank Dr. Marylyn Ritchie for helpful discus-sion on the manuscript.
References
1. Moore JH: The ubiquitous nature of epistasis in determining susceptibility to common human diseases. Hum Hered 2003,
56:73-82.
2. Templeton A: Epistasis and complex traits. Wade, M., Broadie, B III, and Wolf, J. 41–57. In Epistasis and the Evolutionary Process Oxford, Oxford University Press; 2000.
3. Moore JH, Williams SM: New strategies for identifying gene-gene interactions in hypertension. Ann Med 2002, 34:88-95. 4. Moore JH: Computational analysis of gene-gene interactions
using multifactor dimensionality reduction. Expert Rev Mol Diagn 2004, 4:795-803.
5. Sing CF, Stengard JH, Kardia SL: Dynamic relationships between the genome and exposures to environments as causes of common human diseases. World Rev Nutr Diet 2004, 93:77-91. 6. Thornton-Wells TA, Moore JH, Haines JL: Genetics, statistics and
human disease: analytical retooling for complexity. Trends Genet 2004, 20:640-647.
7. Culverhouse R, Klein T, Shannon W: Detecting epistatic interac-tions contributing to quantitative traits. Genet Epidemiol 2004,
27:141-152.
8. Millstein J, Conti DV, Gilliland FD, Gauderman WJ: A testing frame-work for identifying susceptibility genes in the presence of epistasis. Am J Hum Genet 2006, 78:15-27.
9. Nelson MR, Kardia SL, Ferrell RE, Sing CF: A combinatorial parti-tioning method to identify multilocus genotypic partitions that predict quantitative trait variation. Genome Res 2001,
11:458-470.
10. Ritchie MD, Hahn LW, Roodi N, Bailey LR, Dupont WD, Parl FF, et al.: Multifactor-dimensionality reduction reveals high-order interactions among estrogen-metabolism genes in sporadic breast cancer. Am J Hum Genet 2001, 69:138-147.
11. Sanada H, Yatabe J, Midorikawa S, Hashimoto S, Watanabe T, Moore JH, et al.: Single-nucleotide polymorphisms for diagnosis of salt-sensitive hypertension. Clin Chem 2006, 52:352-360. 12. Williams SM, Ritchie MD, Phillips JA III, Dawson E, Prince M, Dzhura
E, et al.: Multilocus analysis of hypertension: a hierarchical approach. Hum Hered 2004, 57:28-38.
13. Andrew AS, Nelson HH, Kelsey KT, Moore JH, Meng AC, Casella DP,
et al.: Concordance of multiple analytical approaches demon-strates a complex relationship between DNA repair gene SNPs, smoking and bladder cancer susceptibility. Carcinogen-esis 2006, 27:1030-1037.
14. Xu J, Lowey J, Wiklund F, Sun J, Lindmark F, Hsu FC, et al.: The inter-action of four genes in the inflammation pathway signifi-cantly predicts prostate cancer risk. Cancer Epidemiol Biomarkers Prev 2005, 14:2563-2568.
15. Motsinger AA, Donahue BS, Brown NJ, Roden DM, Ritchie MD: Risk factor interactions and genetic effects associated with post-operative atrial fibrillation. Pac Symp Biocomput 2006:584-595. 16. Tsai CT, Lai LP, Lin JL, Chiang FT, Hwang JJ, Ritchie MD, et al.:
Renin-angiotensin system gene polymorphisms and atrial fibrilla-tion. Circulation 2004, 109:1640-1646.
17. Motsinger AA, Ritchie MD: Multifactor dimensionality reduc-tion: an analysis strategy for modelling and detecting gene-gene interactions in human gene-genetics and pharmacogenomics studies. Hum Genomics 2006, 2:318-328.
18. Good P: Permutation Tests: A Practical Guide to Resampling Methods for Testing Hypotheses. New York, Springer-Verlag; 2000.
19. Mukherjee S, Golland P, Panchenko D: Permutation tests for clas-sification. AI Memo #2003-019. Cambridge MA, Massachusetts Institure of Technology; 2003.
20. Neuhauser M: Efficiency comparisons of rank and permutation tests. Stat Med 2005, 24:1777-1778.
21. Hahn LW, Ritchie MD, Moore JH: Multifactor dimensionality reduction software for detecting gene-gene and gene-envi-ronment interactions. Bioinformatics 2003, 19:376-382. 22. Pattin KA, White BC, Barney M, Gui J, Nelson HH, Kelsey KT, et al.:
A computationally efficient hypothesis testing method for epistasis analysis using multifactor dimensionality reduction. Genet Epidemiol in press.
Additional file 1
Methods description. Detail additional file provides detailed descriptions of the methods, data simulation and data analysis performed in the cur-rent study.
Click here for file